
TRADE_CENTER_1
@t_TRADE_CENTER_1

What symbols does the trader recommend buying?
Purchase History
پیام های تریدر
Filter
ETH/USD Inverse Head and Shoulders Breakout Targeting \$2,883
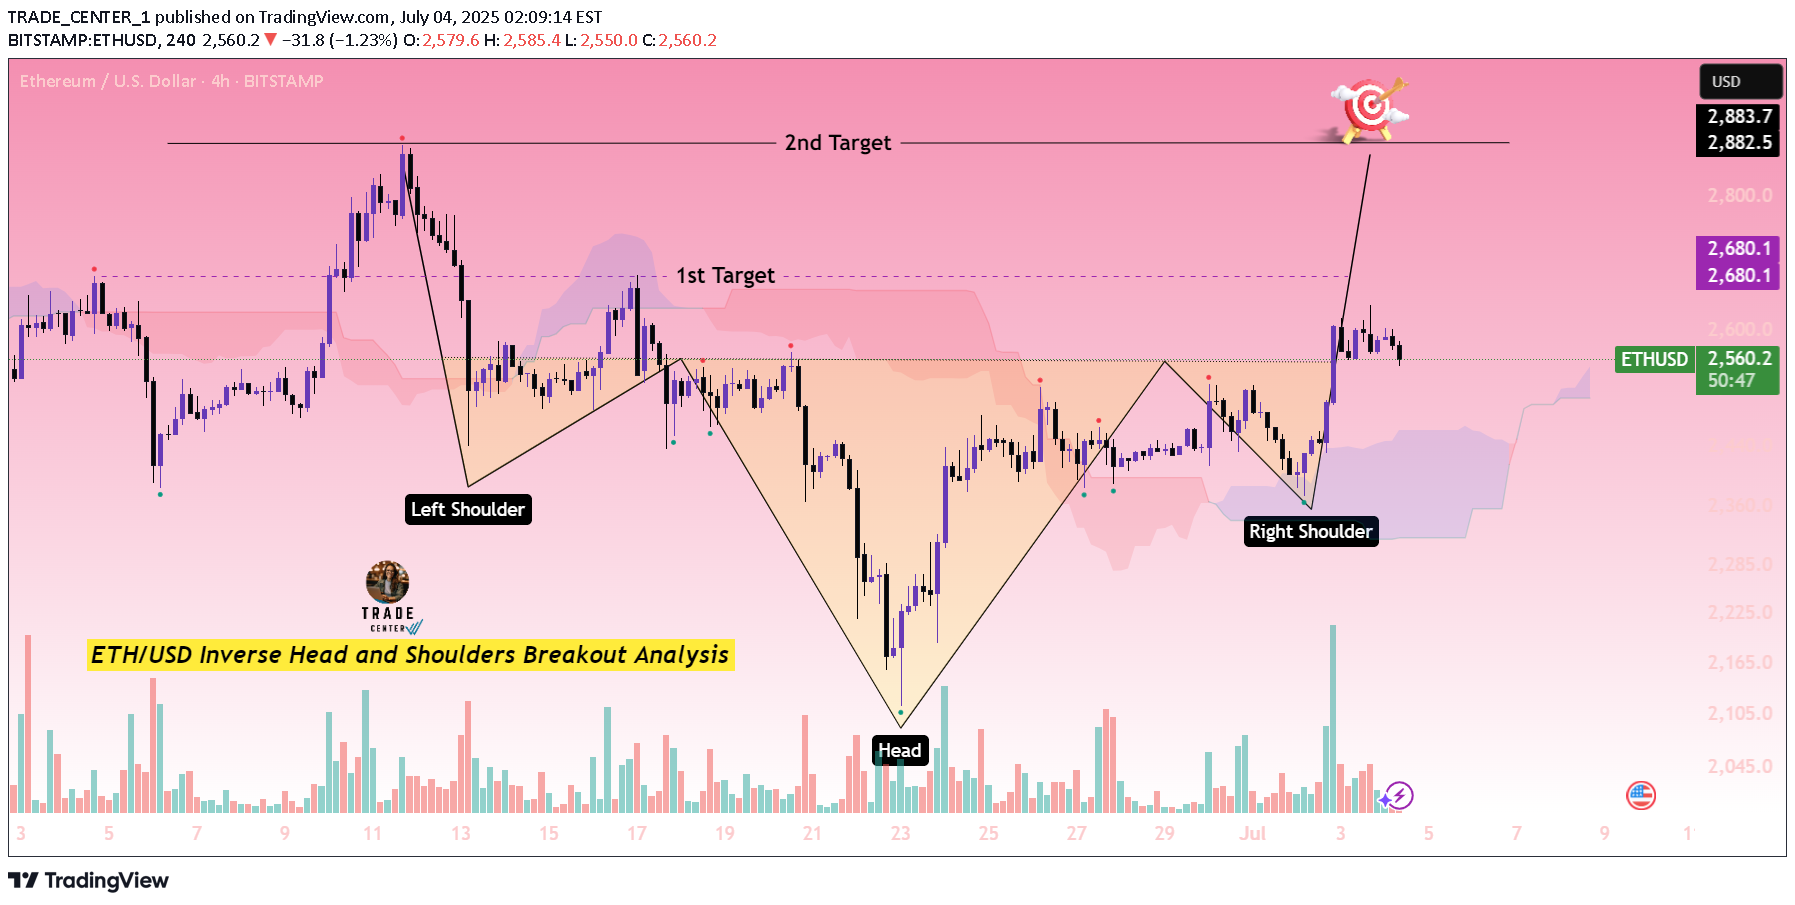
ETH/USD Inverse Head and Shoulders Breakout AnalysisThe 4-hour ETH/USD chart shows a clear inverse head and shoulders pattern, which is a classic bullish reversal setup. The left shoulder, head, and right shoulder are well-formed, and the neckline has been broken with strong bullish momentum, supported by a spike in volume—confirming the breakout.After the breakout above the neckline, Ethereum surged past the 2,559 level and is currently consolidating above that zone, indicating a possible retest of the neckline as new support.Key Levels:1st Target: 2,680 – This level is aligned with a previous resistance zone and the measured move from the neckline to the head.2nd Target: 2,883 – This is the full projection from the neckline breakout and represents a significant resistance area from past price action.As long as ETH holds above the neckline support around 2,500–2,540, the bullish structure remains valid. A break back below that zone with high volume could invalidate the pattern and open the door for downside risk.Conclusion:This well-formed inverse head and shoulders, followed by a strong breakout with volume, suggests a bullish trend reversal is underway. The pattern targets are:1st Target: $2,680 – Close to the previous peak before the right shoulder.2nd Target: $2,883 – Measured move target from head to neckline projected upward.As long as ETH stays above the neckline, bullish momentum is expected to continue.
XAU/USD Head and Shoulders Pattern Signals Bearish Reversal
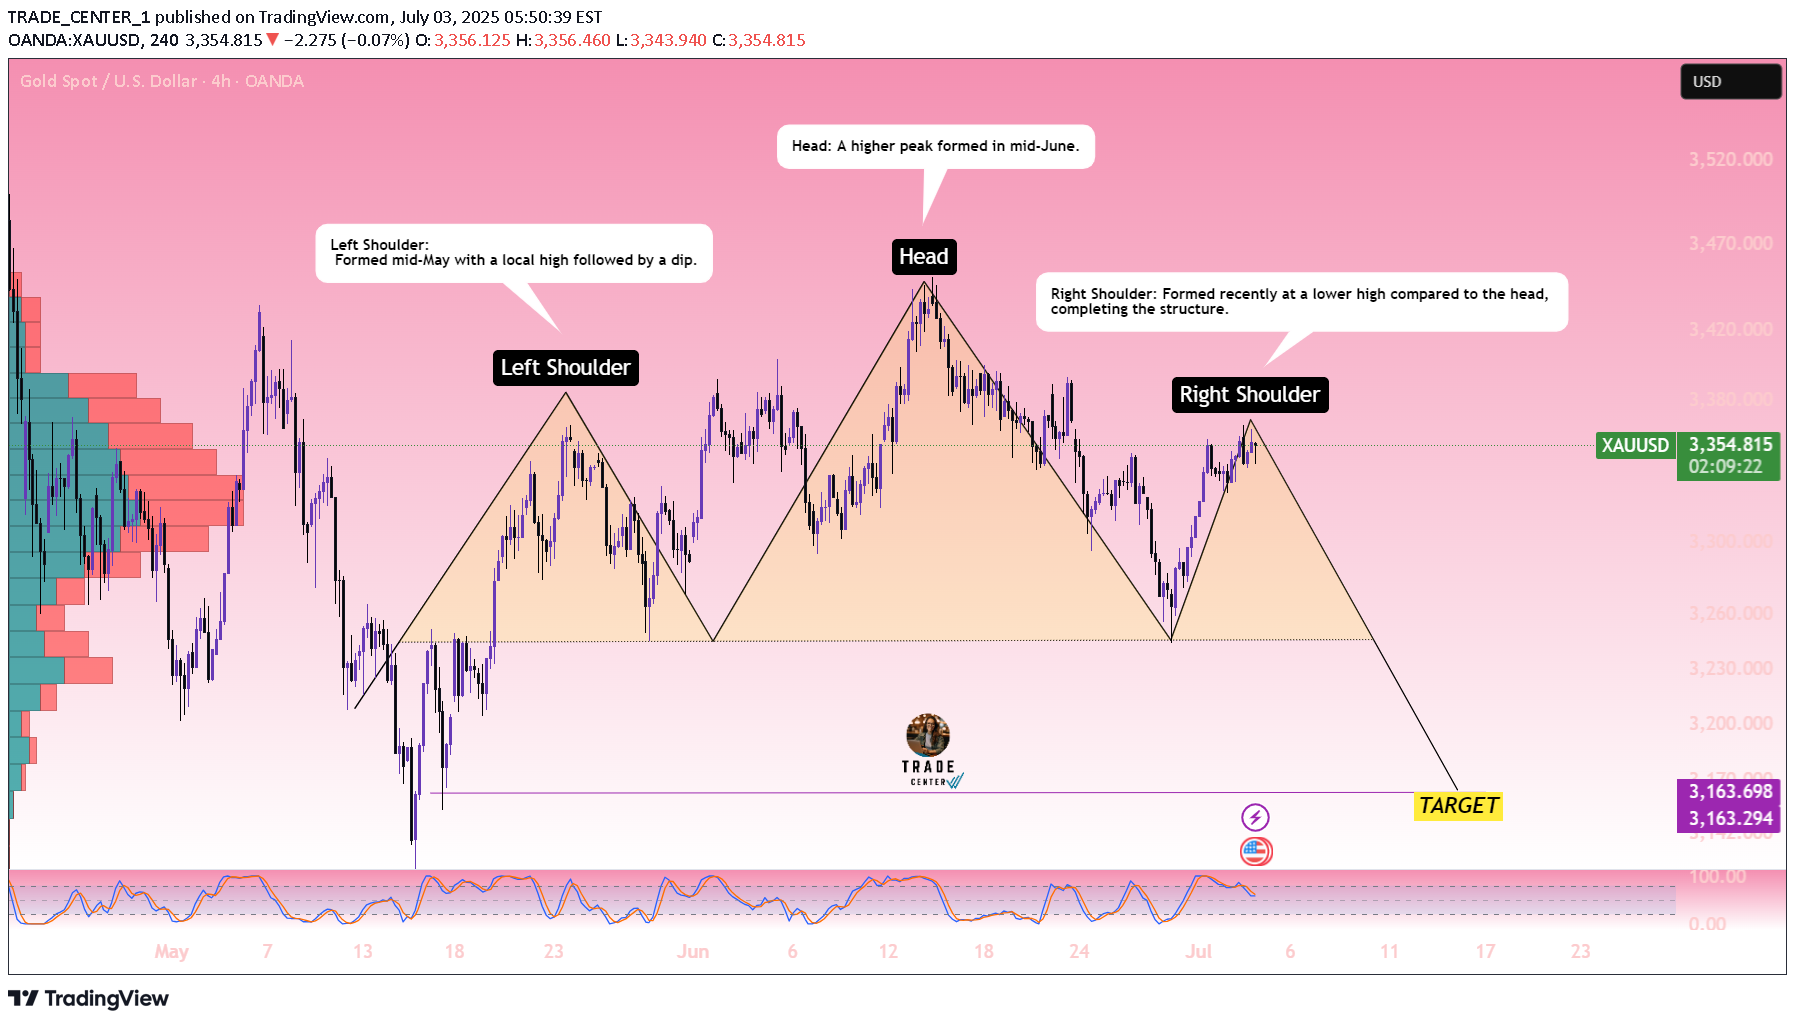
XAU/USD Head and Shoulders Breakdown AnalysisThe chart shows a classic Head and Shoulders pattern forming on the 4H timeframe, indicating a potential bearish reversal setup.Left Shoulder: Formed mid-May with a local high followed by a dip.Head: A higher peak formed in mid-June. Right Shoulder: Formed recently at a lower high compared to the head, completing the structure.The neckline has been clearly defined, and price is currently hovering just above it. If the price breaks and closes below the neckline with strong bearish momentum, it would confirm the pattern.Target: The projected target from the breakdown is around 3163, calculated by measuring the height from the head to the neckline and projecting it downward.Outlook:A confirmed break below the neckline would open the door for further downside toward the target zone. Bears will be in control if price sustains below the neckline with increasing volume.Wait for confirmation on the neckline break before considering short entries.
BTC/USD Bullish Breakout Toward Liquidity Target
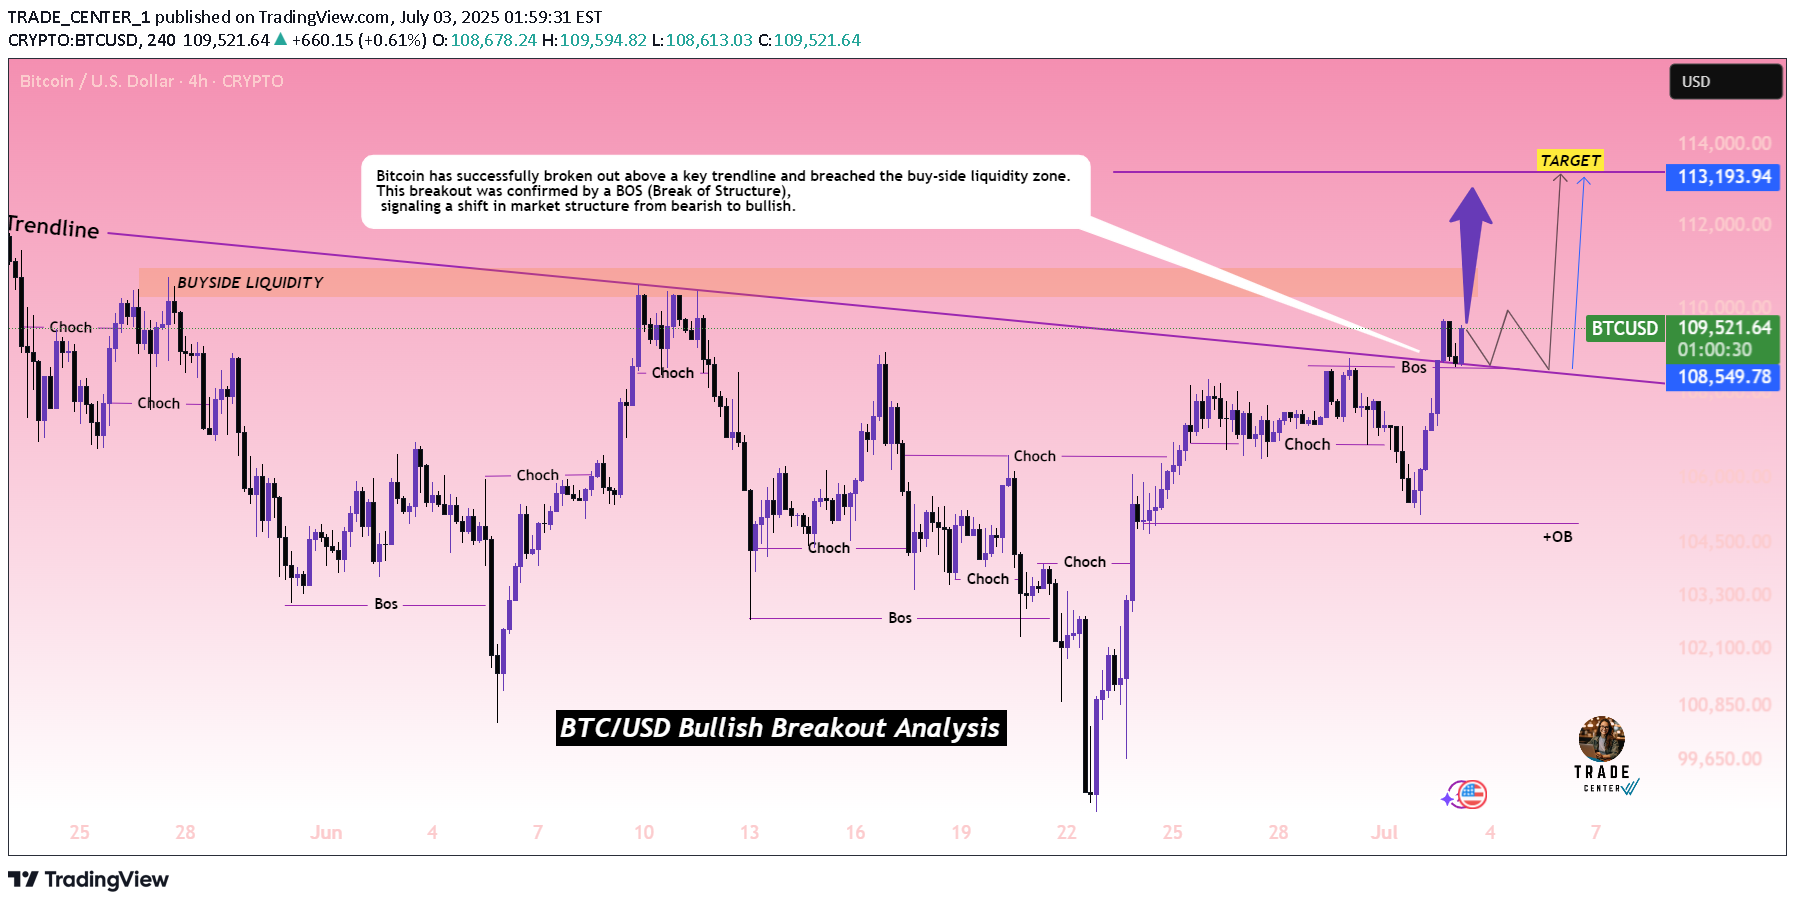
BTC/USD Bullish Breakout AnalysisBitcoin has successfully broken out above a key trendline and breached the buy-side liquidity zone. This breakout was confirmed by a BOS (Break of Structure), signaling a shift in market structure from bearish to bullish.The chart shows multiple CHoCH (Change of Character) points, culminating in a strong bullish move that cleared previous liquidity and resistance. Price action suggests a bullish continuation with a potential retracement and retest of the breakout zone (former resistance, now acting as support).The next logical target for this bullish momentum lies near the \$113,193 zone, which is clearly marked as a target area. This aligns with the previous high and a possible liquidity grab zone.Conclusion: If the price successfully retests the breakout area and holds above the trendline, BTC is likely to continue its upward trajectory toward the \$113,193 target.
Gold Bounces Back After Fake Breakout – Eyes on Key Resistance
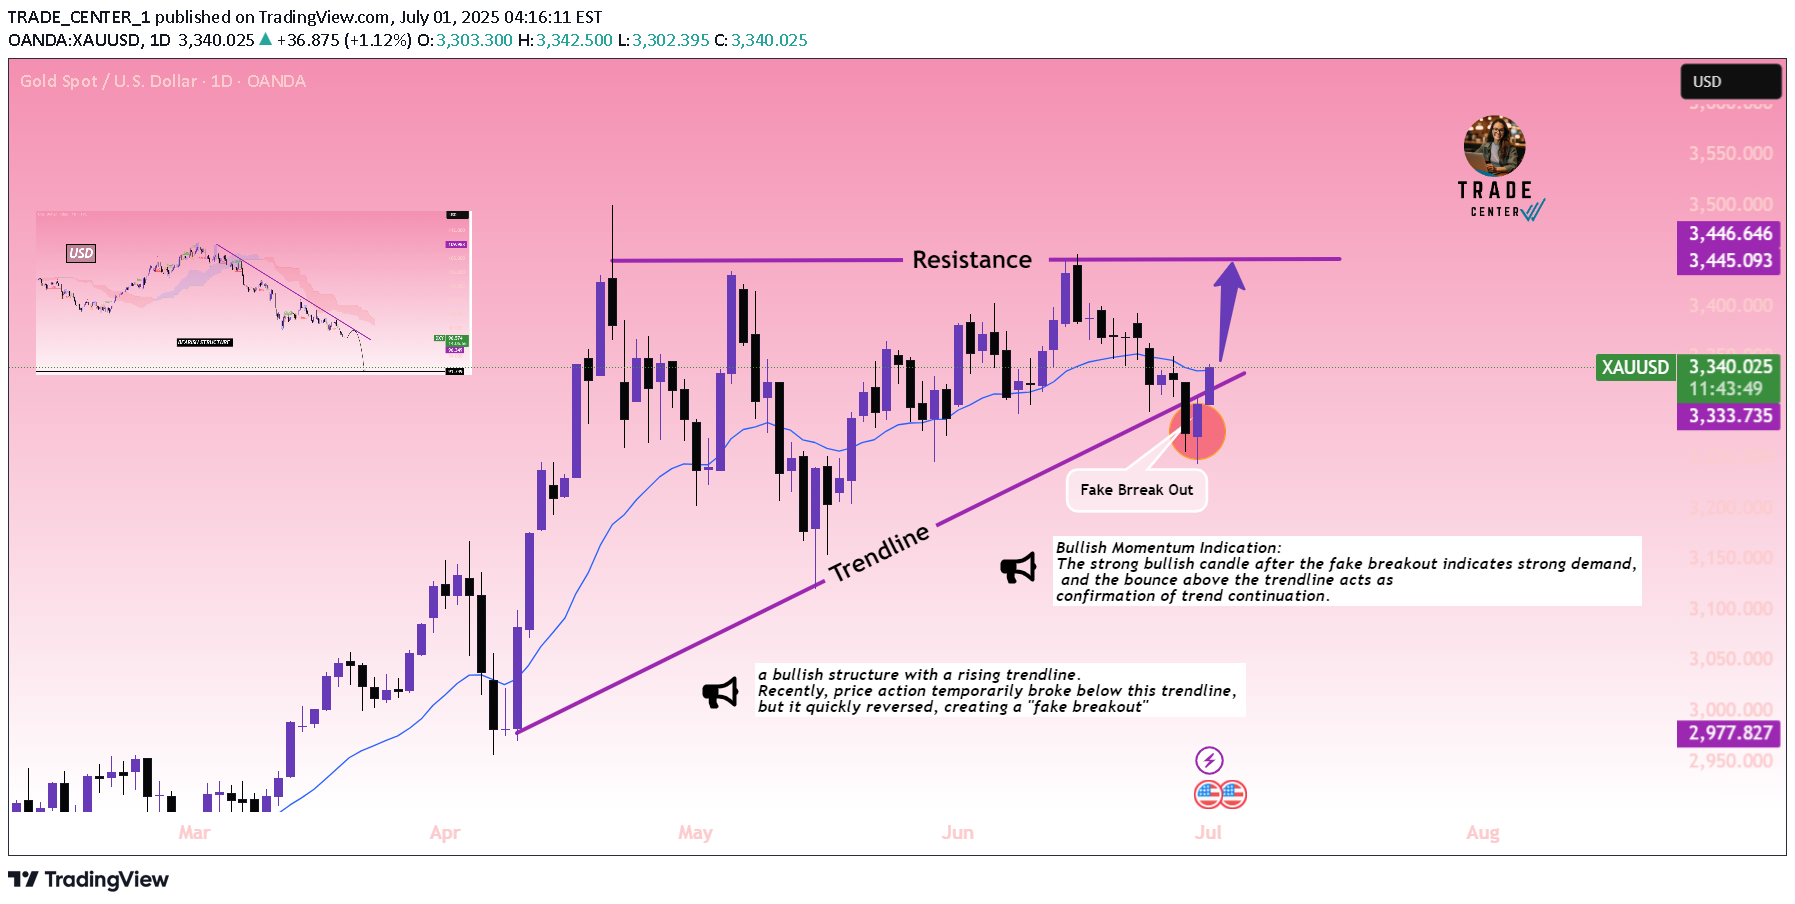
XAU/USD Daily Chart Analysis:Trendline Rejection & Fake Breakout: The chart shows a bullish structure with a rising trendline. Recently, price action temporarily broke below this trendline, but it quickly reversed, creating a **"fake breakout"** (highlighted in red). This trap likely shook out weak hands and signaled renewed buying pressure. Current Price Action: Price has reclaimed the trendline and is now trading back above it, also above the moving average, suggesting strength and a potential continuation to the upside. Resistance Zone: The major resistance level is clearly marked around 3445–3446, which previously capped price rallies. The chart suggests a bullish continuation move toward this level.Bullish Momentum Indication: The strong bullish candle after the fake breakout indicates strong demand, and the bounce above the trendline acts as confirmation of trend continuation.---Summary:Gold (XAU/USD) is showing a strong bullish recovery after a fake breakout below the trendline. If the price sustains above the trendline and moving average, there is a high probability it will target the resistance zone around 3445–3446 in the coming sessions.
Gold Forms Symmetrical Triangle — Bearish Breakdown Toward 3,123
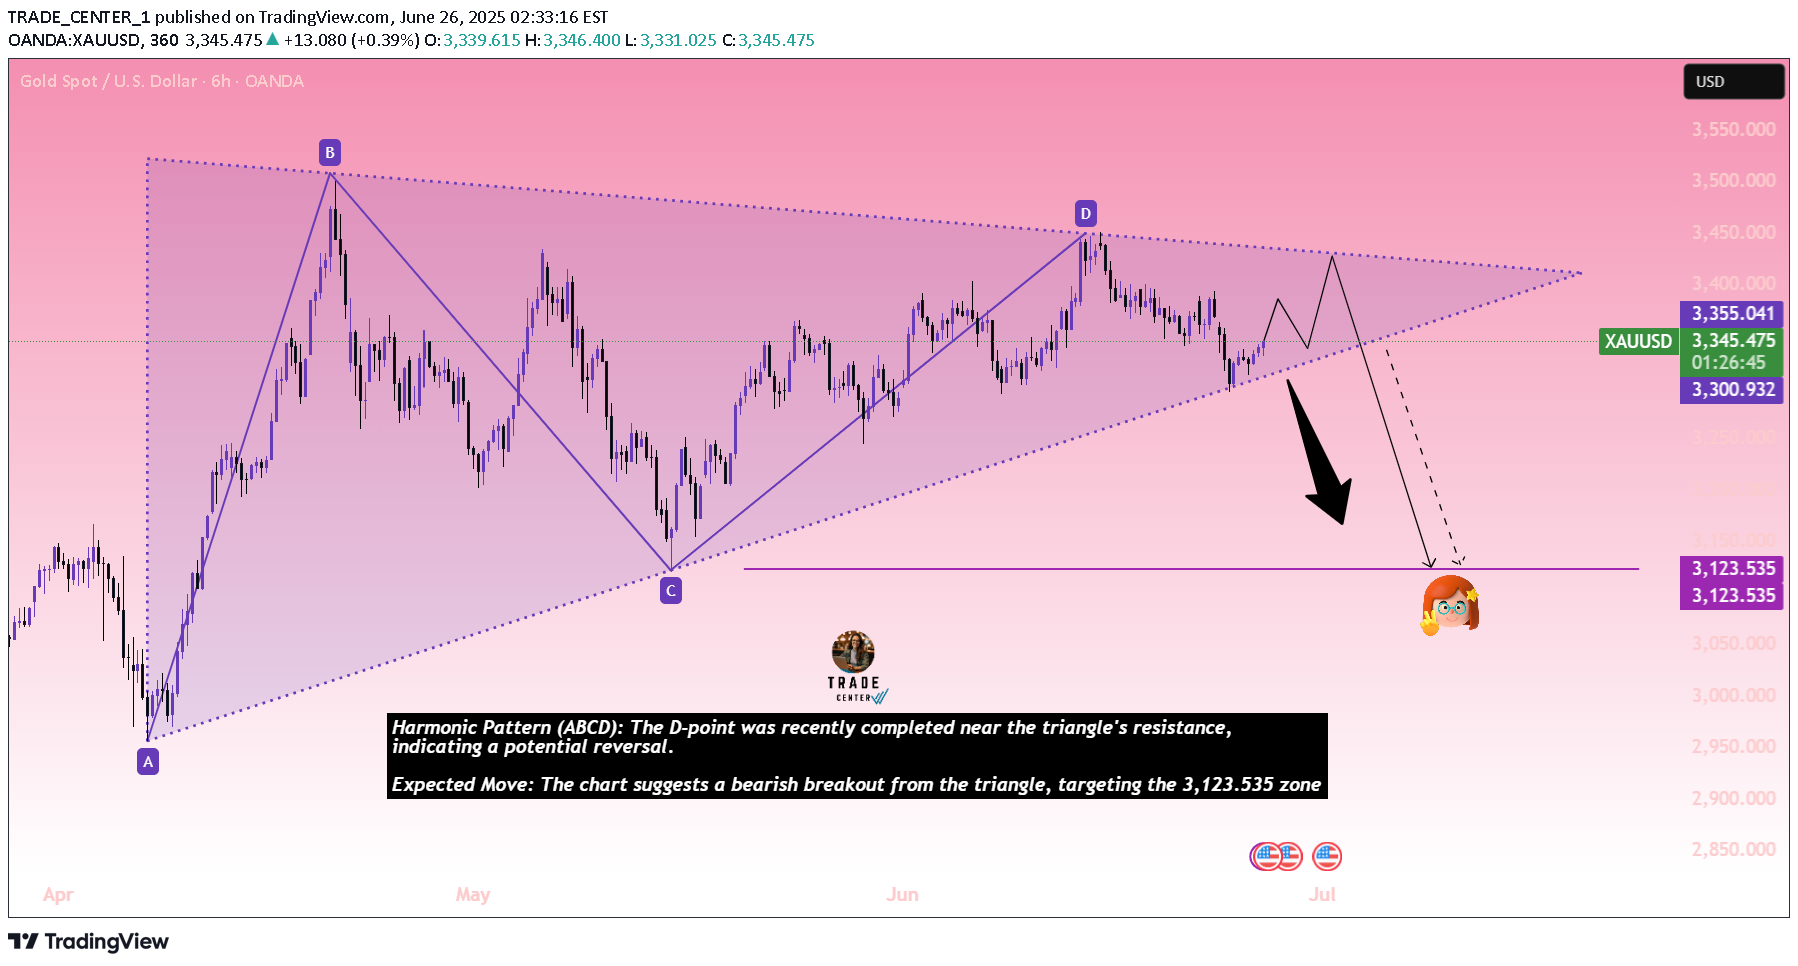
XAU/USD Technical Analysis (6H Chart)The chart shows a symmetrical triangle formation with labeled harmonic structure (ABCD pattern), currently near the upper boundary of the triangle. Key Observations:Symmetrical Triangle: Price is moving within converging trendlines, suggesting consolidation Harmonic Pattern (ABCD): The D-point was recently completed near the triangle's resistance, indicating a potential reversal.Expected Move: The chart suggests a bearish breakout from the triangle, targeting the 3,123.535 zone, as indicated by the arrow and emoji.Current Price: Trading around 3,342.930, showing early signs of downward pressure.Resistance: \~3,355.041 — key level where price might reject.Support & Target Zone:3,123.535 — horizontal support zone marked for potential bearish move.Trade Setup: Bearish Breakdown from TriangleEntry (Sell): Around 3,350 – 3,355 (near upper trendline/resistance)Stop Loss (SL): Above 3,375 (above triangle resistance to allow some buffer)Take Profit (TP):TP1: 3,300 (minor support area / midpoint)TP2: 3,200 (breakdown continuation zone)TP Final: 3,123 (major target zone shown on chart)Conclusion:If price fails to break above the upper trendline near 3,355, we can expect a bearish continuation toward 3,123. A break and close below the triangle support would confirm the sell setup.This setup expects price rejection at the upper trendline and a confirmed breakdown from the triangle. Make sure to watch for strong bearish candles or a retest confirmation before entering.
XAU/USD Bearish Continuation Short Analysis with short target
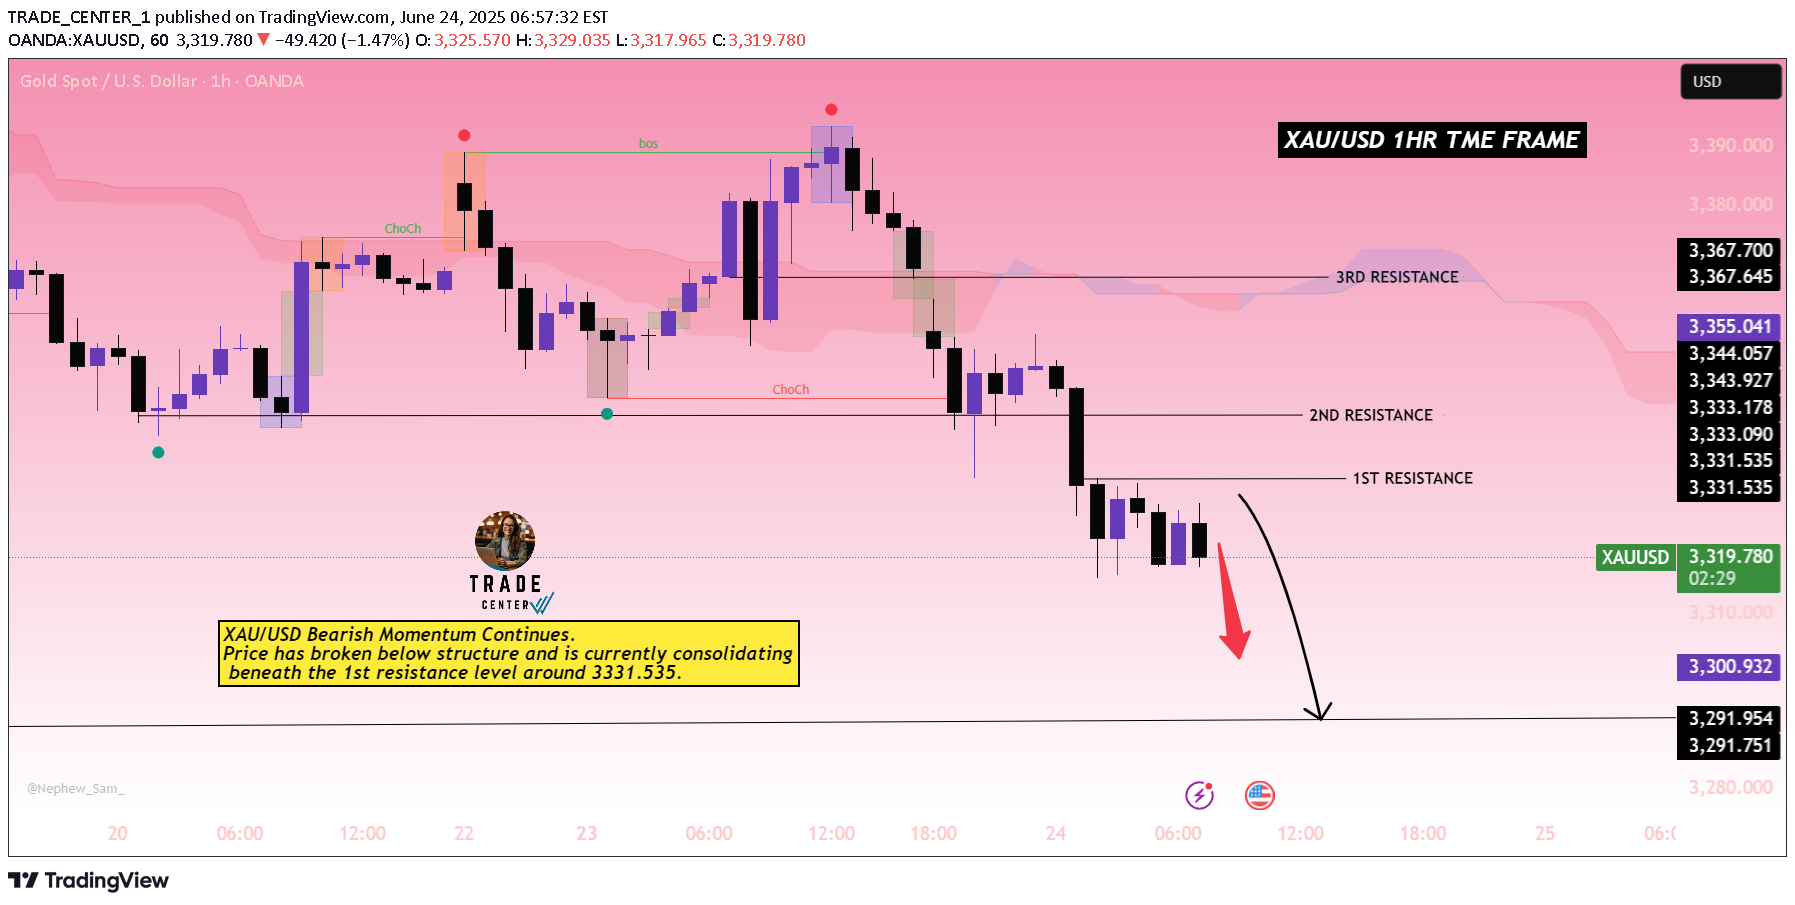
XAU/USD Bearish Momentum Continues Short AnalysisPrice has broken below structure and is currently consolidating beneath the 1st resistance level around 3331.535. Multiple signs of bearish order flow are evident, with clear change of character (ChoCh) and break of structure (BoS) confirming seller dominance. As long as price stays below 2nd resistance, the bearish bias remains valid with a potential move toward the 3290. support zone.TP for Short Analysis:Take Profit:3290.This level marks a key support zone and aligns with the projected bearish move shown by the red arrow in the chart.Congratulations target achieved
Bitcoin Bullish Flag Breakout Formation
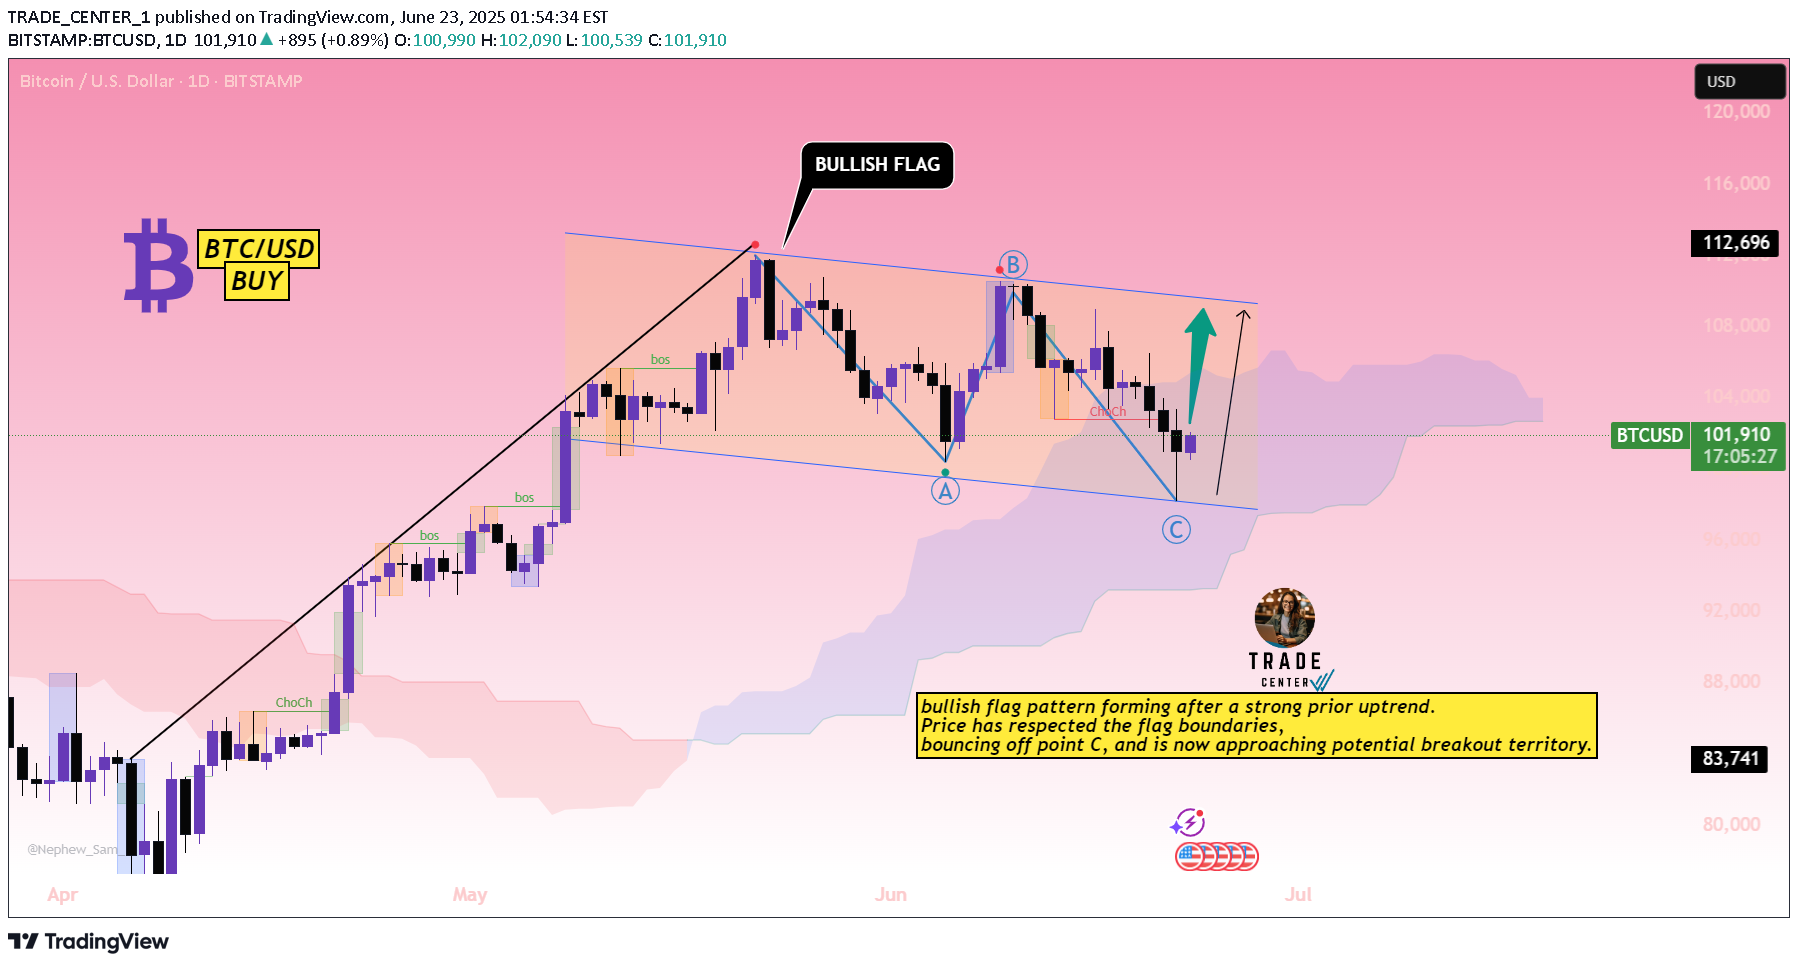
Bitcoin Bullish Flag Breakout SetupThe chart displays a bullish flag pattern forming after a strong prior uptrend. Price has respected the flag boundaries, bouncing off point C, and is now approaching potential breakout territory. If momentum continues, a bullish breakout toward the 112,696 level is likely. The Ichimoku cloud also supports a bullish reversal scenario as price pushes through resistance.congratulation market reached 109,700
ETH/USD Bullish Reversal Setup from Trendline Support
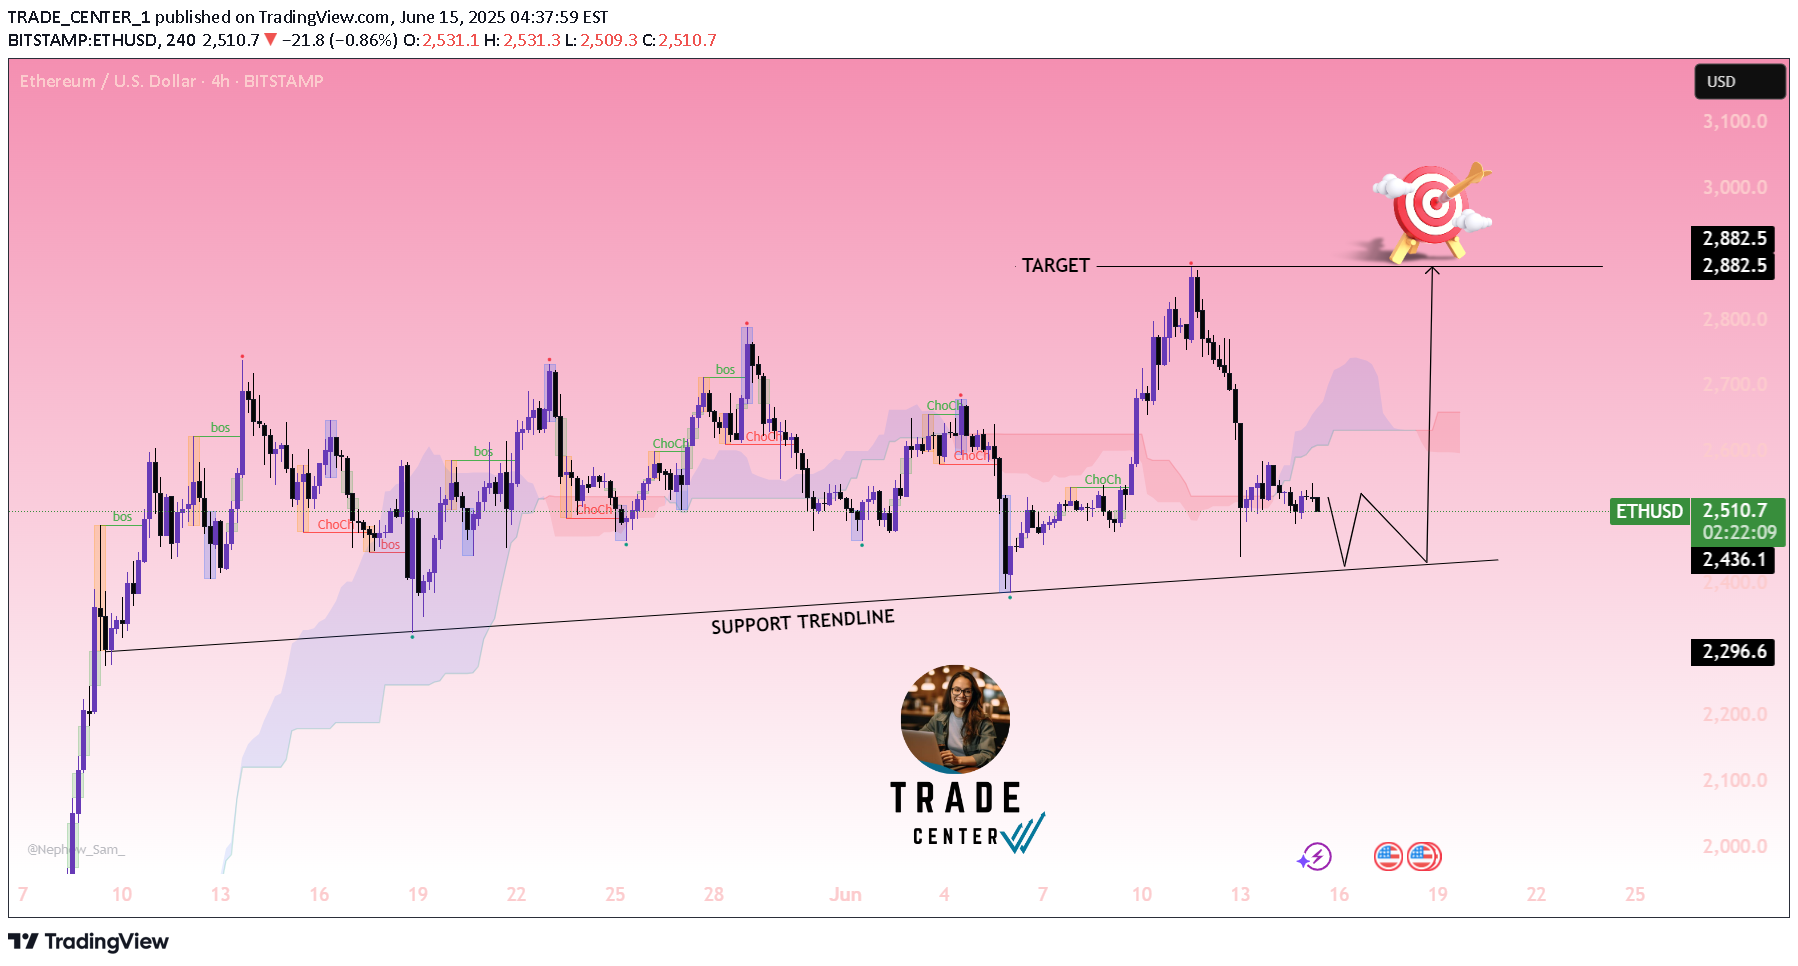
ETH/USD is respecting a support trendline and forming higher lows. Price is currently consolidating near the trendline support, suggesting potential for a bullish reversal. The projected move targets the \$2,882.5 resistance level. A strong bounce from the \$2,436–\$2,296 support zone could trigger the next upward impulse.Here is a proper Take Profit (TP) and Stop Loss (SL) setup based on the chart:Entry Zone: Around \$2,436–\$2,460 (near support trendline)Take Profit (TP): TP1: \$2,650 TP2: \$2,750 TP3 (final target): \$2,882.5Stop Loss (SL): Below the trendline and last swing low SL: \$2,296This setup offers a favorable risk-to-reward ratio if the price respects the trendline and resumes upward momentum.
4HR BTC/USD CHART SHOWS A POTENTIAL SELL SETUP
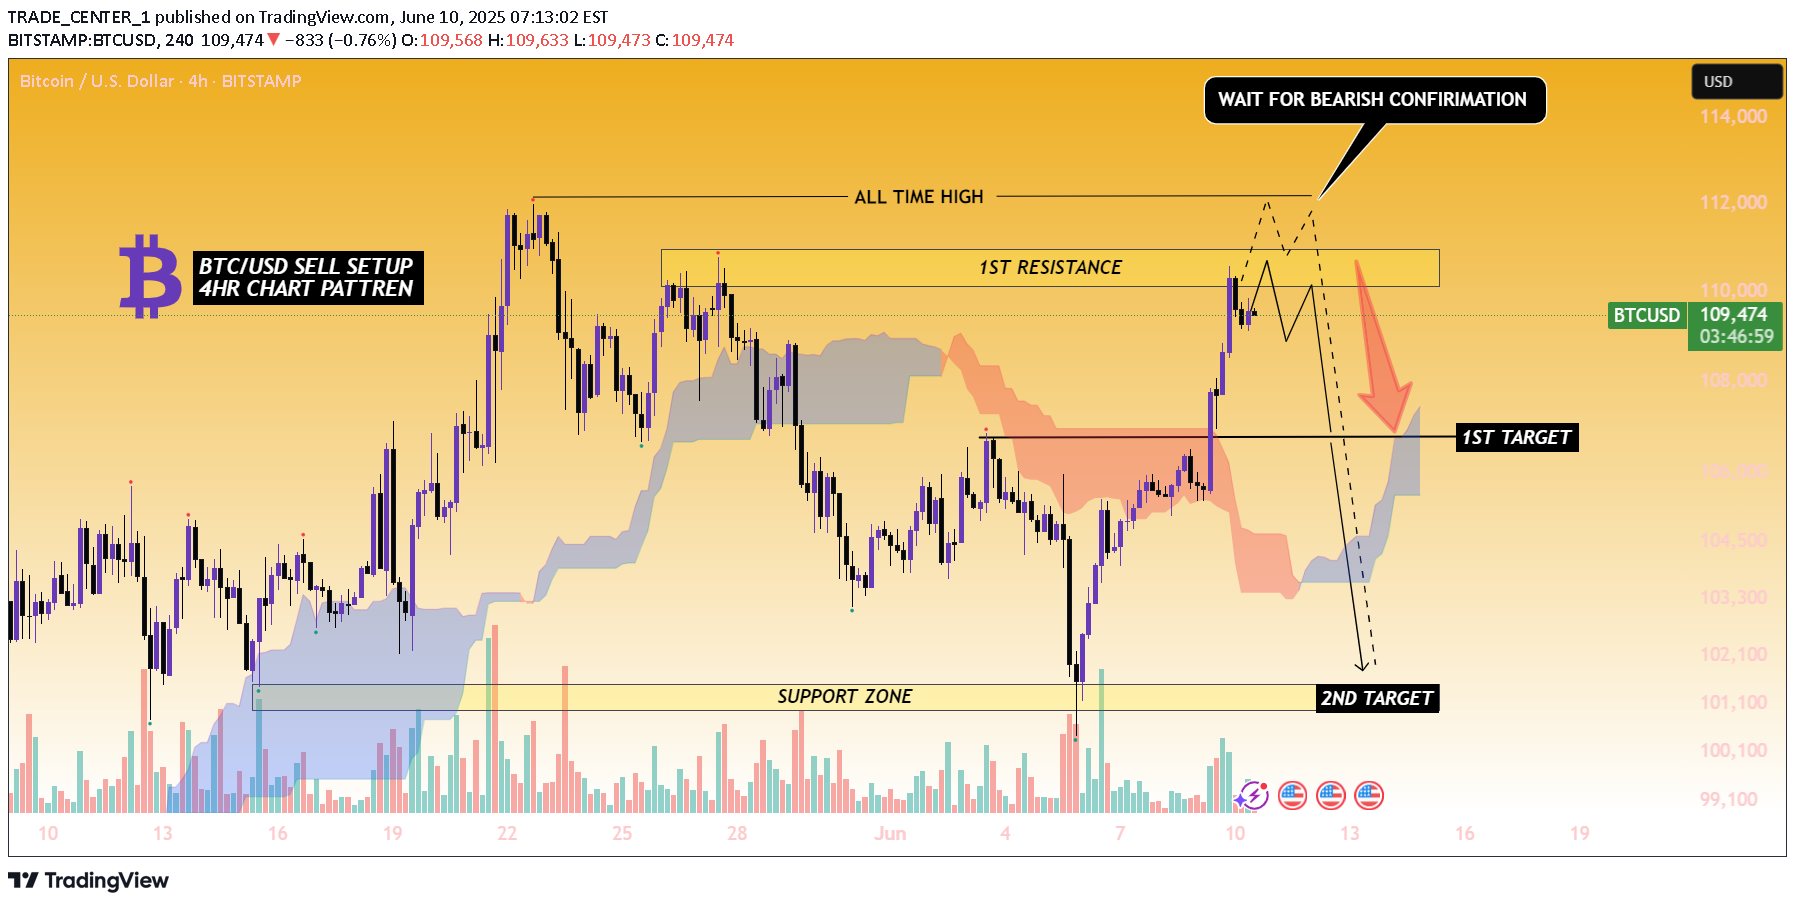
Description This 4-hour BTC/USD chart shows a potential sell setup near the previous all-time high. Price is currently testing a key resistance zone just below that high. The chart suggests waiting for bearish confirmation (e.g., a rejection or lower high) before entering a short position.If confirmed, the first target is around the 106,000 level, aligned with the cloud and previous structure. A stronger bearish move could push price toward the second target near the 101,000–100,000 support zone.1st Target: 106,000 USD2nd Target: 101,000–100,000 USD (Support Zone)This setup hinges on rejection from the resistance area — no short trade is advised until confirmation is seen.1st target reached 106,000
Gold 4H Bullish Breakout Setup – Targeting 3438 Zone
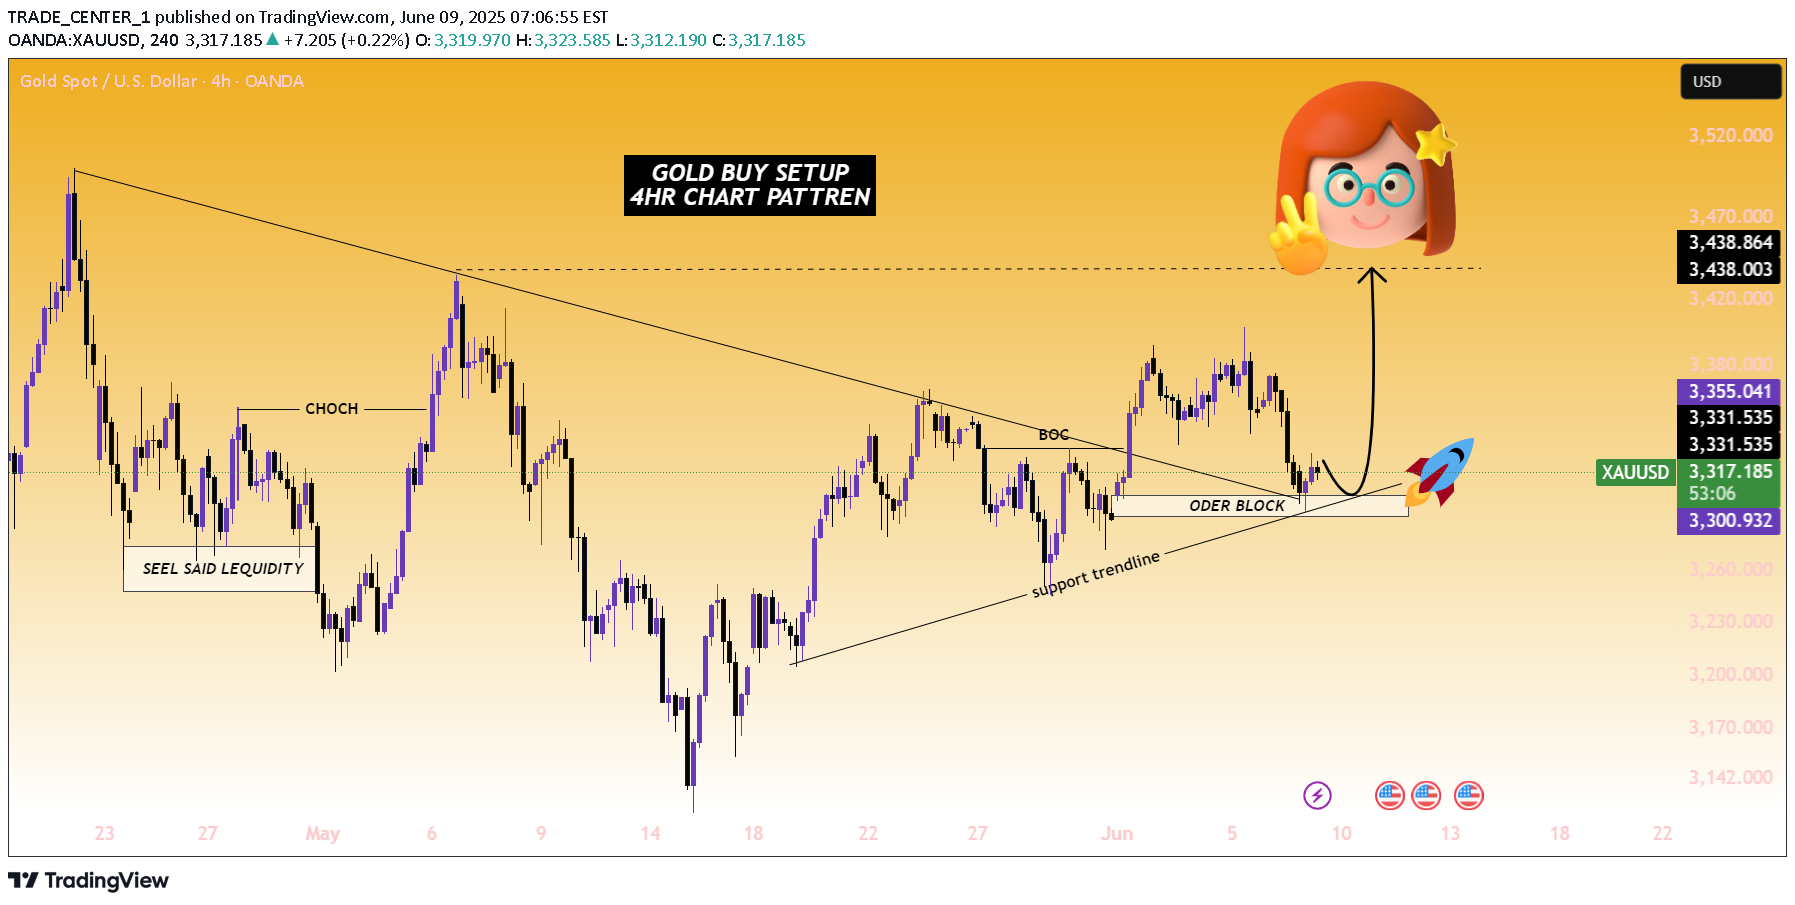
This 4-hour chart shows a bullish setup for gold (XAU/USD). Key elements include:CHoCH (Change of Character): Indicates a shift from bearish to bullish structure.Break of Structure (BoS): Confirming bullish momentum.Support Trendline & Order Block: Price is reacting to a confluence of support, suggesting a possible rebound.Projected Target:** A potential upside move towards the 3,438 zone is highlighted, aligning with previous resistance.The current price action around the order block and trendline support hints at a buying opportunity, with a strong bullish move expected if this level holds.Great gold running is well market reached 3350
Disclaimer
Any content and materials included in Sahmeto's website and official communication channels are a compilation of personal opinions and analyses and are not binding. They do not constitute any recommendation for buying, selling, entering or exiting the stock market and cryptocurrency market. Also, all news and analyses included in the website and channels are merely republished information from official and unofficial domestic and foreign sources, and it is obvious that users of the said content are responsible for following up and ensuring the authenticity and accuracy of the materials. Therefore, while disclaiming responsibility, it is declared that the responsibility for any decision-making, action, and potential profit and loss in the capital market and cryptocurrency market lies with the trader.