Technical analysis by TRADE_CENTER_1 about Symbol ETH: Buy recommendation (7/4/2025)

TRADE_CENTER_1
ETH/USD Inverse Head and Shoulders Breakout Targeting \$2,883
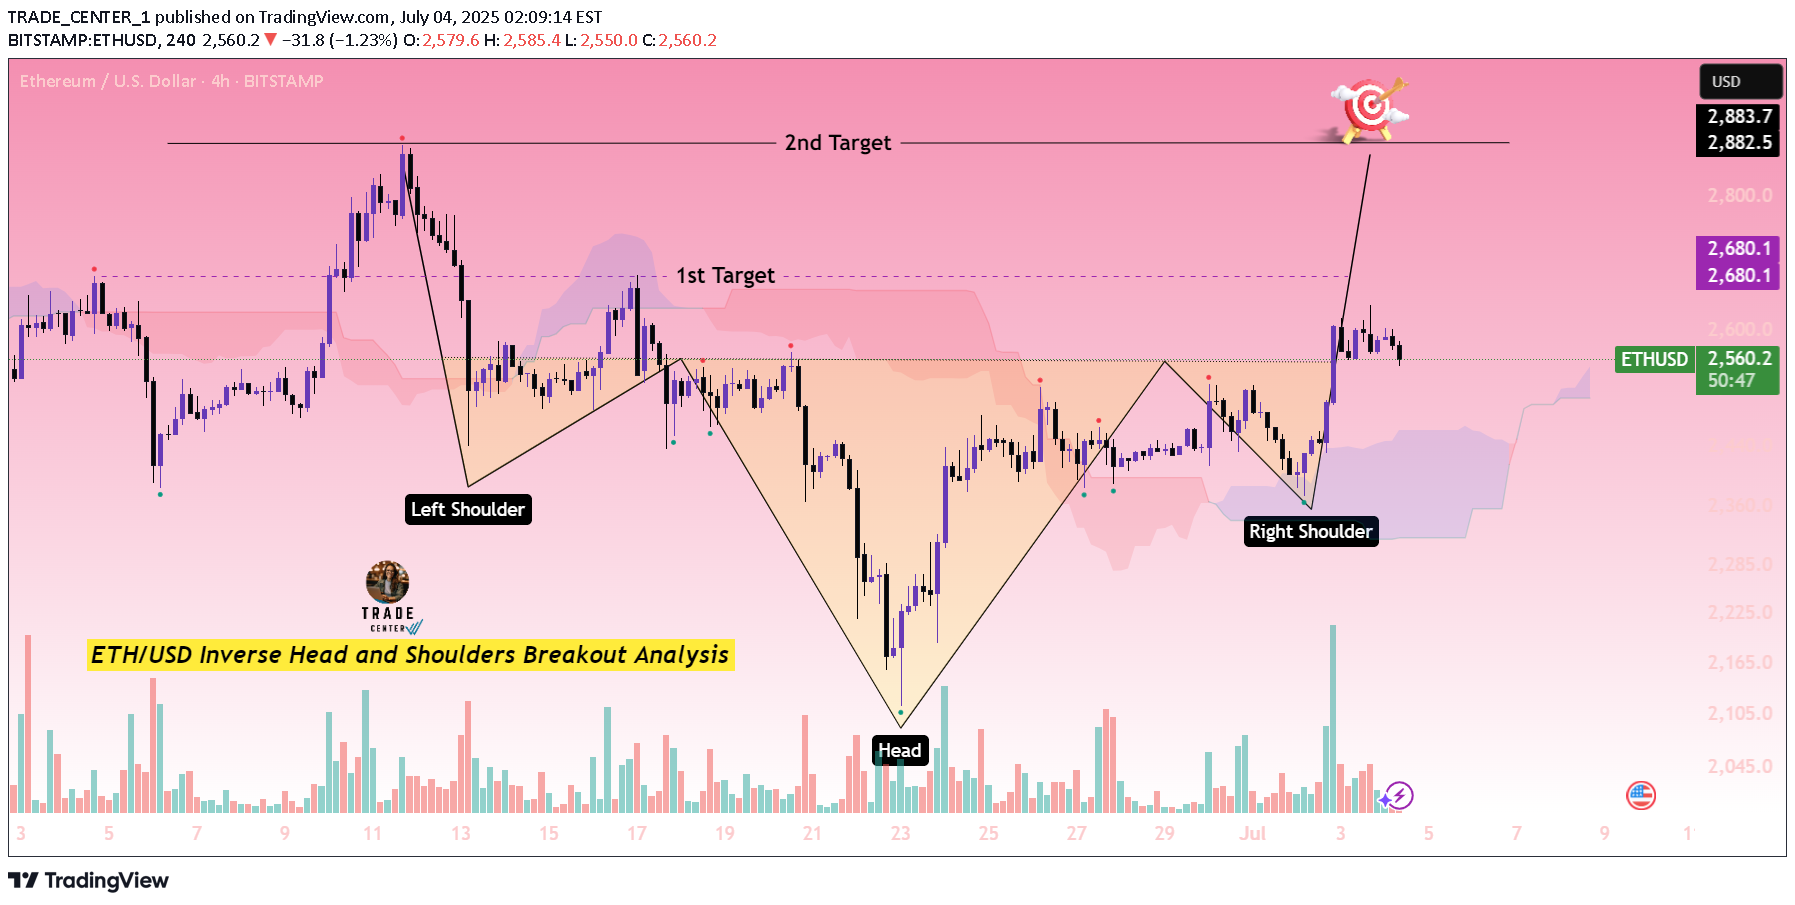
ETH/USD Inverse Head and Shoulders Breakout AnalysisThe 4-hour ETH/USD chart shows a clear inverse head and shoulders pattern, which is a classic bullish reversal setup. The left shoulder, head, and right shoulder are well-formed, and the neckline has been broken with strong bullish momentum, supported by a spike in volume—confirming the breakout.After the breakout above the neckline, Ethereum surged past the 2,559 level and is currently consolidating above that zone, indicating a possible retest of the neckline as new support.Key Levels:1st Target: 2,680 – This level is aligned with a previous resistance zone and the measured move from the neckline to the head.2nd Target: 2,883 – This is the full projection from the neckline breakout and represents a significant resistance area from past price action.As long as ETH holds above the neckline support around 2,500–2,540, the bullish structure remains valid. A break back below that zone with high volume could invalidate the pattern and open the door for downside risk.Conclusion:This well-formed inverse head and shoulders, followed by a strong breakout with volume, suggests a bullish trend reversal is underway. The pattern targets are:1st Target: $2,680 – Close to the previous peak before the right shoulder.2nd Target: $2,883 – Measured move target from head to neckline projected upward.As long as ETH stays above the neckline, bullish momentum is expected to continue.