Technical analysis by TRADE_CENTER_1 about Symbol PAXG: Sell recommendation (6/26/2025)

TRADE_CENTER_1
Gold Forms Symmetrical Triangle — Bearish Breakdown Toward 3,123
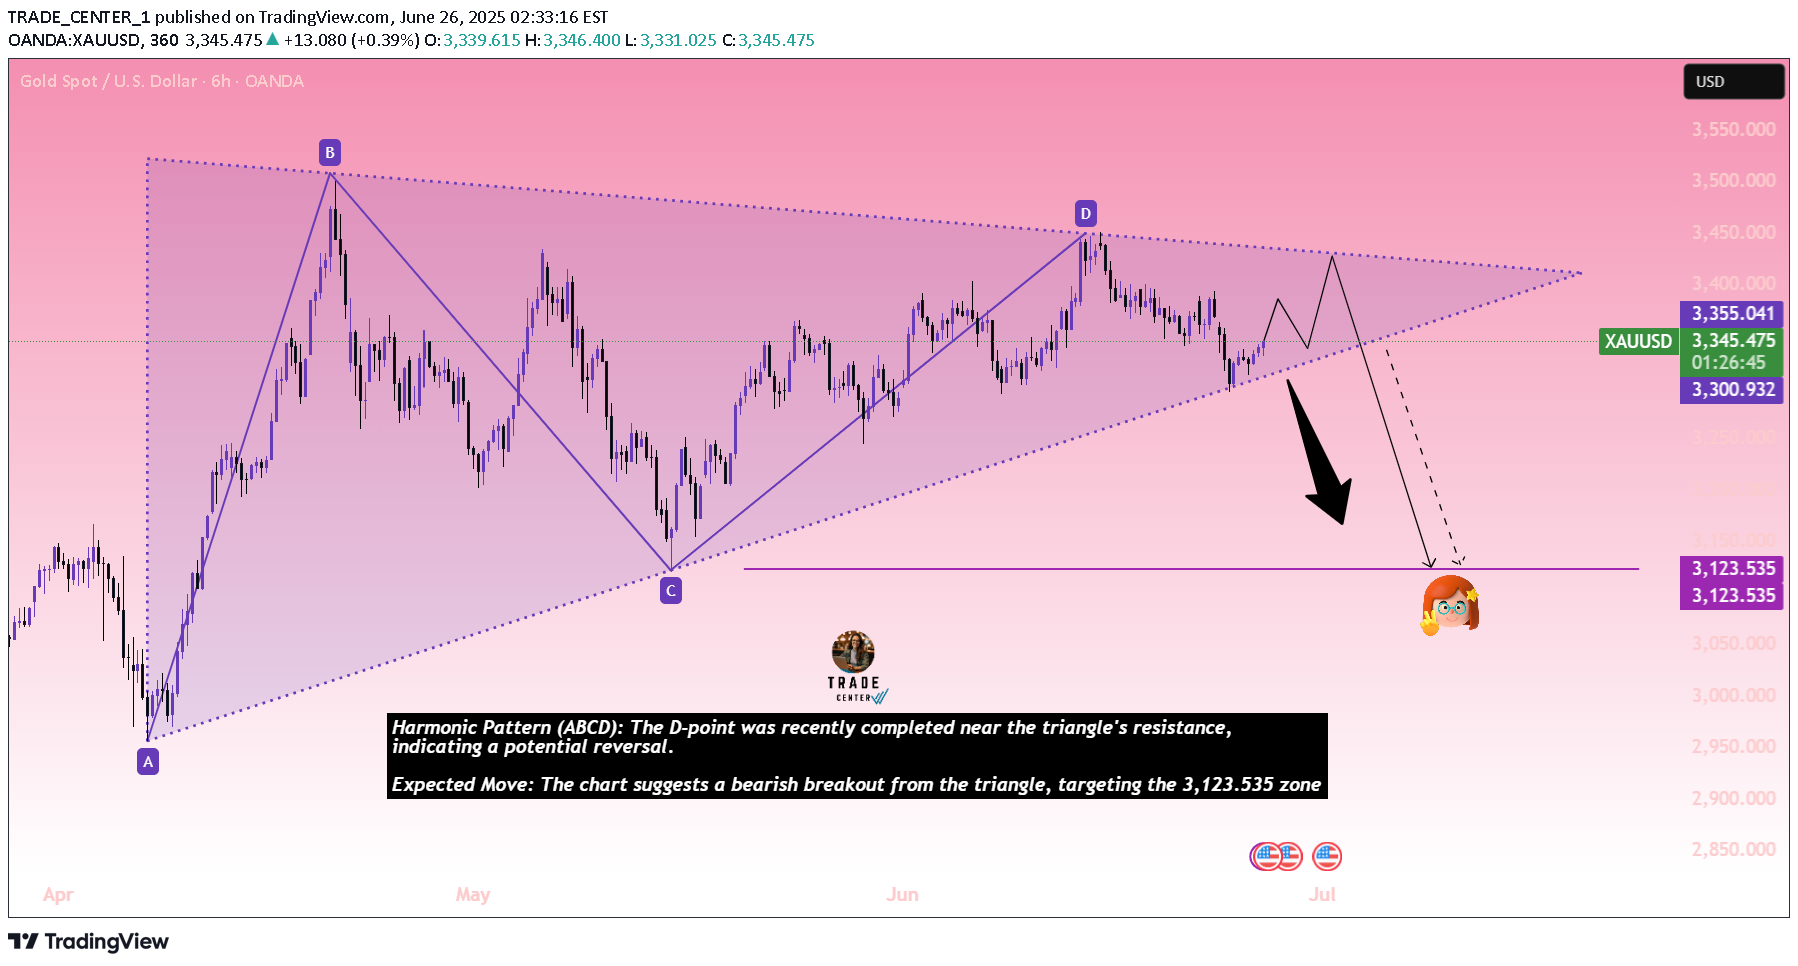
XAU/USD Technical Analysis (6H Chart)The chart shows a symmetrical triangle formation with labeled harmonic structure (ABCD pattern), currently near the upper boundary of the triangle. Key Observations:Symmetrical Triangle: Price is moving within converging trendlines, suggesting consolidation Harmonic Pattern (ABCD): The D-point was recently completed near the triangle's resistance, indicating a potential reversal.Expected Move: The chart suggests a bearish breakout from the triangle, targeting the 3,123.535 zone, as indicated by the arrow and emoji.Current Price: Trading around 3,342.930, showing early signs of downward pressure.Resistance: \~3,355.041 — key level where price might reject.Support & Target Zone:3,123.535 — horizontal support zone marked for potential bearish move.Trade Setup: Bearish Breakdown from TriangleEntry (Sell): Around 3,350 – 3,355 (near upper trendline/resistance)Stop Loss (SL): Above 3,375 (above triangle resistance to allow some buffer)Take Profit (TP):TP1: 3,300 (minor support area / midpoint)TP2: 3,200 (breakdown continuation zone)TP Final: 3,123 (major target zone shown on chart)Conclusion:If price fails to break above the upper trendline near 3,355, we can expect a bearish continuation toward 3,123. A break and close below the triangle support would confirm the sell setup.This setup expects price rejection at the upper trendline and a confirmed breakdown from the triangle. Make sure to watch for strong bearish candles or a retest confirmation before entering.