Technical analysis by TRADE_CENTER_1 about Symbol PAXG: Buy recommendation (7/1/2025)

Gold Bounces Back After Fake Breakout – Eyes on Key Resistance
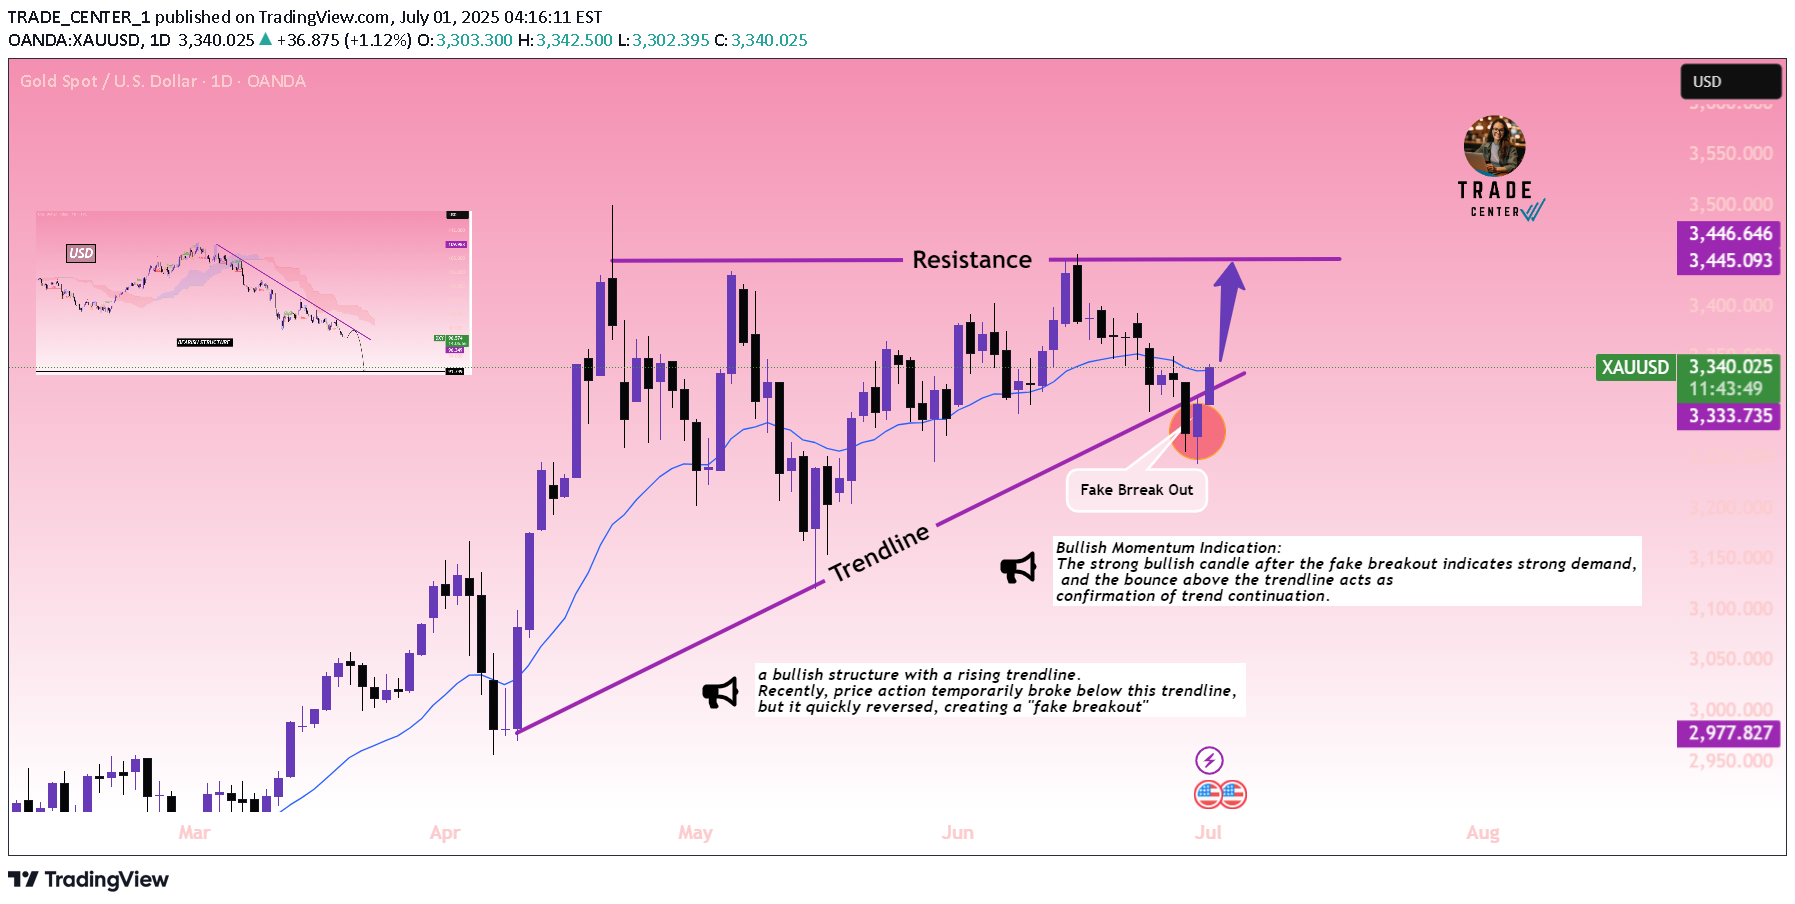
XAU/USD Daily Chart Analysis:Trendline Rejection & Fake Breakout: The chart shows a bullish structure with a rising trendline. Recently, price action temporarily broke below this trendline, but it quickly reversed, creating a **"fake breakout"** (highlighted in red). This trap likely shook out weak hands and signaled renewed buying pressure. Current Price Action: Price has reclaimed the trendline and is now trading back above it, also above the moving average, suggesting strength and a potential continuation to the upside. Resistance Zone: The major resistance level is clearly marked around 3445–3446, which previously capped price rallies. The chart suggests a bullish continuation move toward this level.Bullish Momentum Indication: The strong bullish candle after the fake breakout indicates strong demand, and the bounce above the trendline acts as confirmation of trend continuation.---Summary:Gold (XAU/USD) is showing a strong bullish recovery after a fake breakout below the trendline. If the price sustains above the trendline and moving average, there is a high probability it will target the resistance zone around 3445–3446 in the coming sessions.