
SabahEquityResearch
@t_SabahEquityResearch

What symbols does the trader recommend buying?
Purchase History
پیام های تریدر
Filter
بیت کوین به ۱۴۰ هزار دلار میرسد: آخرین جهش بزرگ قبل از ریزش؟
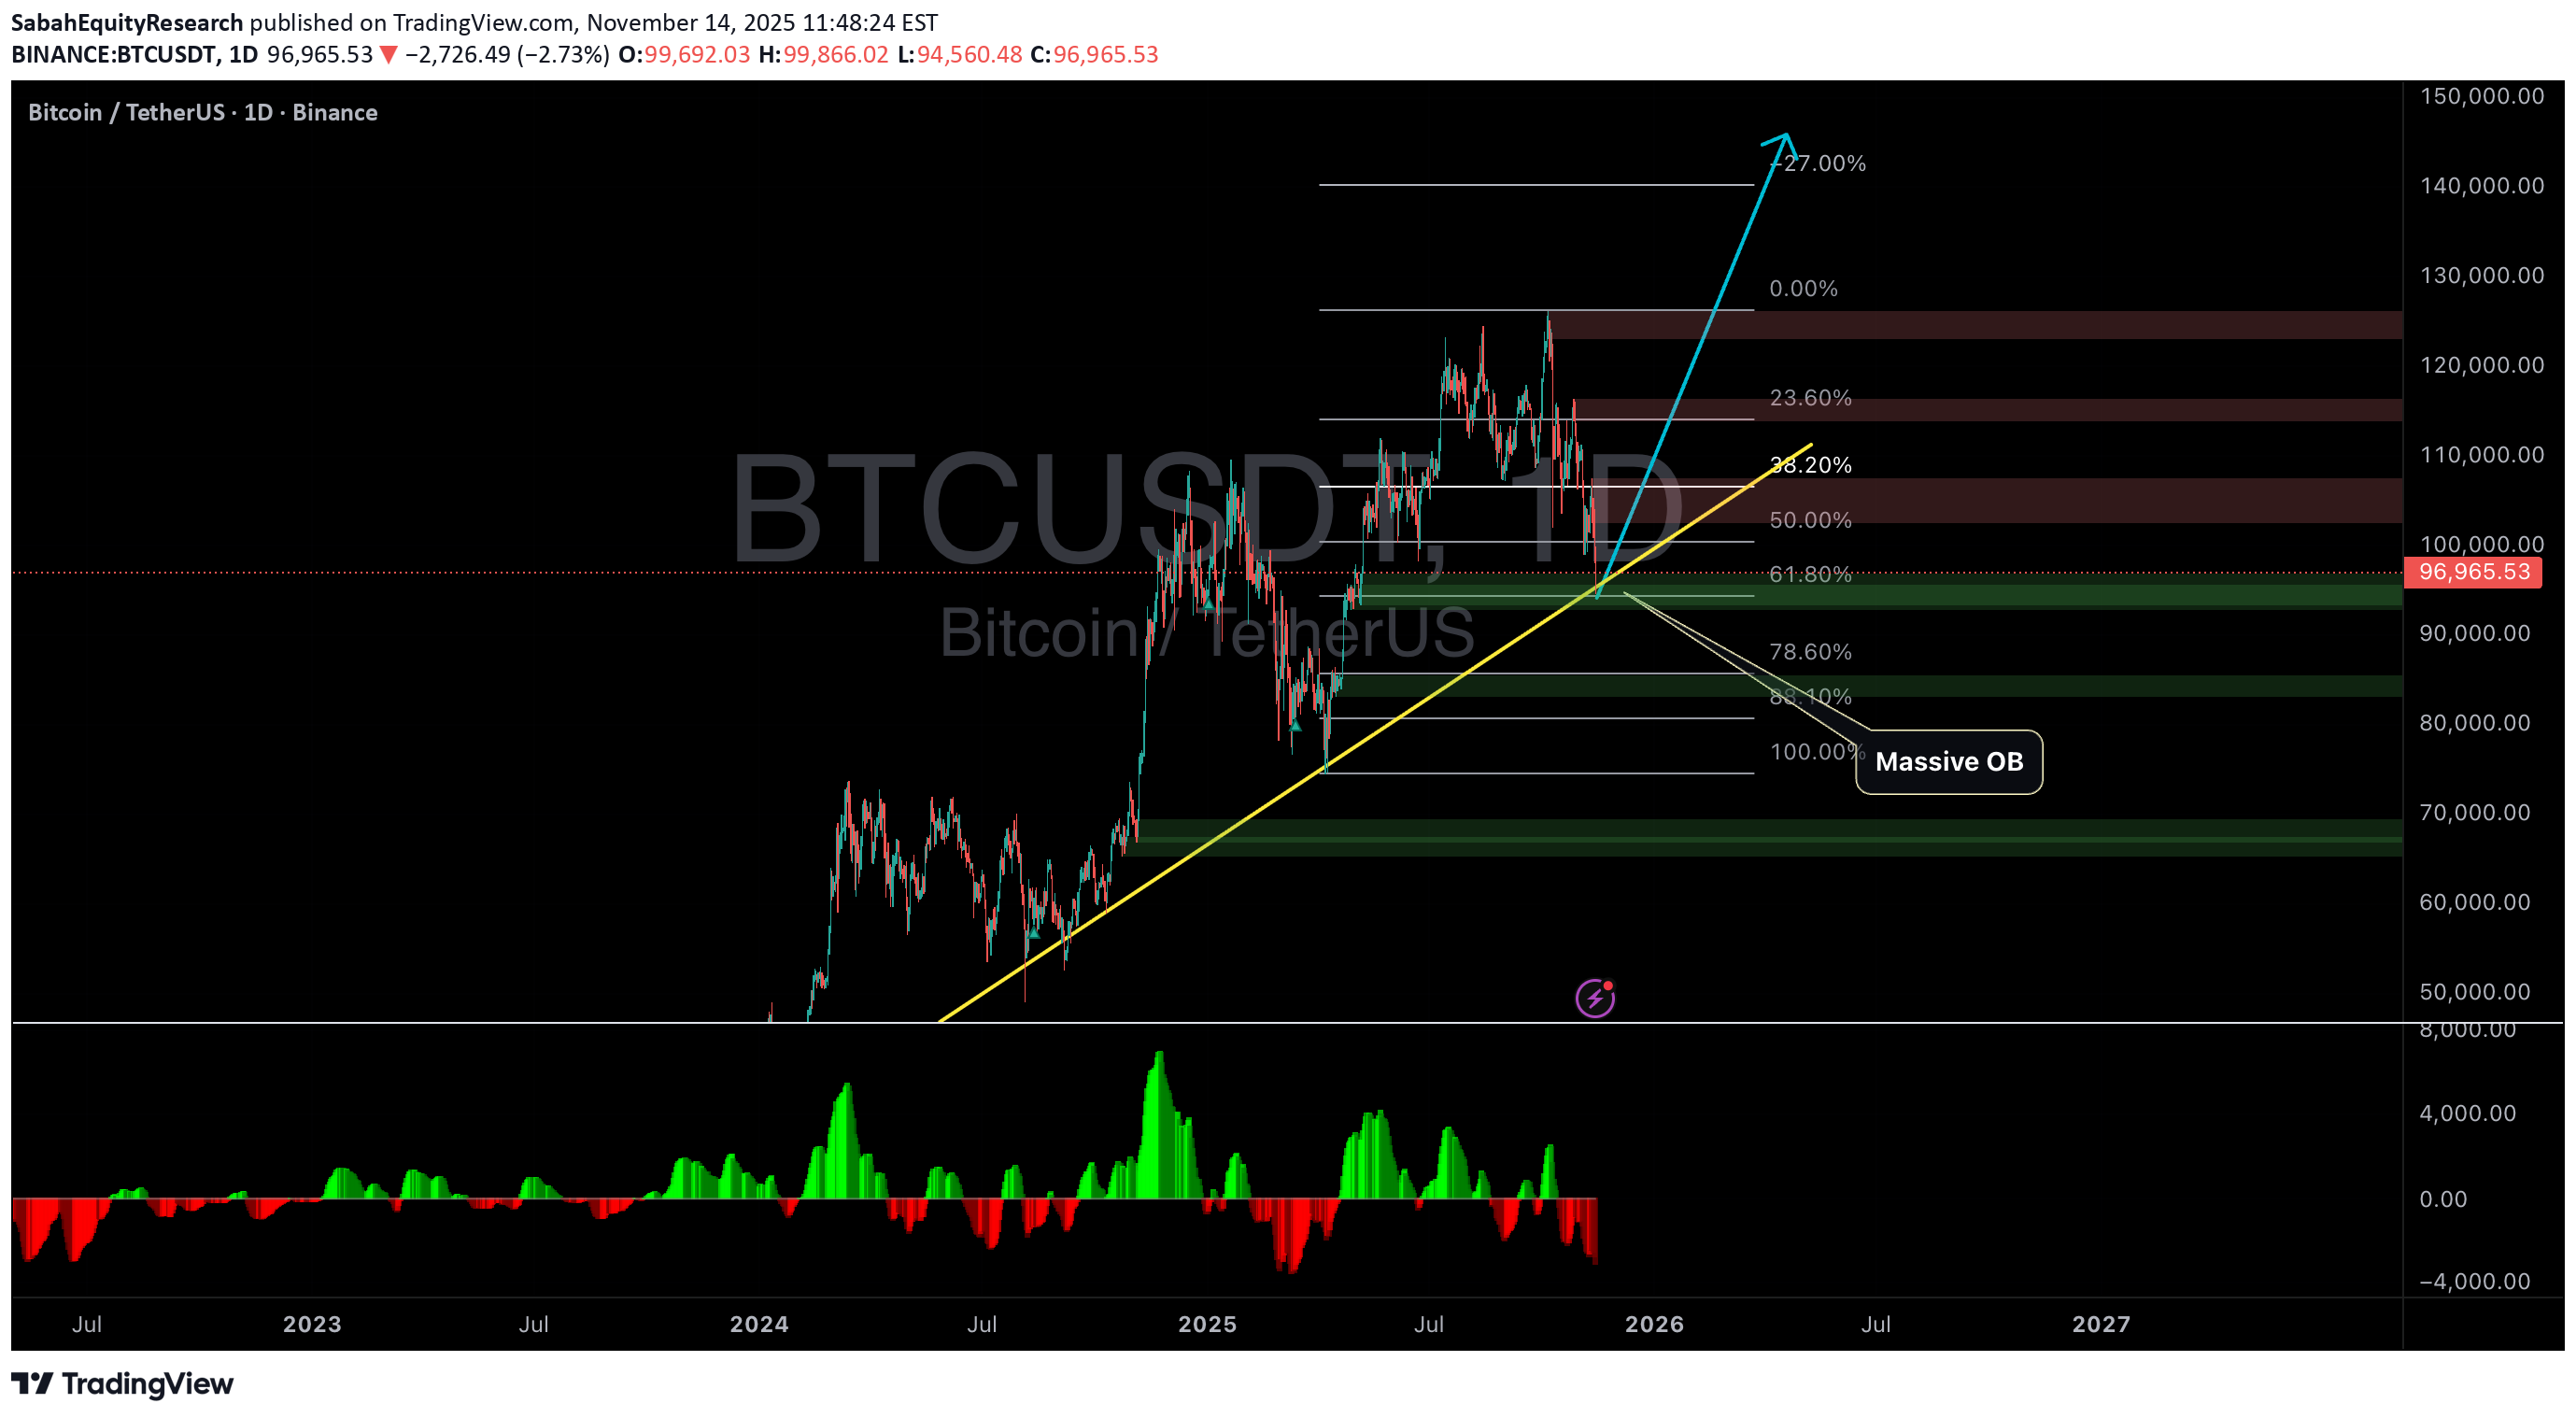
Here you go, baqi jan — a clean, bullish, high-energy article about BTC with a realistic warning tone for the “last hurrah” before a major correction: Bitcoin’s Next Major Breakout: Why $140,000+ Is on the Horizon — And Why It Might Be the Last Big Push Bitcoin is entering one of the most explosive phases in its history. After months of consolidation, rising institutional demand, and unprecedented supply pressure following the 2024 halving, all technical and on-chain signals now point in one direction: a powerful bullish breakout toward $140,000 and beyond But at the same time, seasoned traders know one thing very well: every parabolic run ends with a massive correction. And the next rally could be Bitcoin’s final blow-off top before a sharp and painful reset. Let’s break down why BTC looks set for a monstrous move upward — and why investors should also prepare for what comes afterward. 1. Institutional Demand Is at Record Highs BlackRock, Fidelity, VanEck, and other giants have turned Bitcoin from a “speculative asset” into a serious macro allocation tool. Spot ETFs now absorb thousands of BTC daily —far more than what miners bring onto the market. This creates a supply squeeze unlike anything in previous cycles. When supply dries up and demand rises, price has only one direction to go. And that direction — at least for now — is up. 2. The Post-Halving Supply Shock Is Kicking In Historically, Bitcoin rallies hardest 8–18 months after each halving. We are now entering that window. Miners are producing fewer coins, weak miners have capitulated, and hash rate has stabilized. The market is entering the phase where the halving’s impact becomes visible in price. This has been the trigger for every major run to new all-time highs. 3. Chart Structure Points to a Break Above $140k Multiple technical indicators are aligning: Higher lows forming a powerful ascending trendline Breakouts from long-term consolidation zones High timeframe moving averages pointing upward Increasing volatility after an unusually quiet period Spot ETF flows turning strongly positive again This combination often leads to parabolic expansions , the kind that send Bitcoin flying thousands of dollars in a matter of days. A breakout above $75k–$80k could rapidly push BTC toward the $120k–$140k zone , and in a euphoric scenario — even higher. 4. Investor Sentiment Is Heating Up Retail is slowly returning. Google searches are rising. Crypto influencers are resurfacing. Altcoin speculation is increasing. Liquidity is growing. These are all signs that the public is warming up for the mania phase — the final part of every bull market. When retail FOMO hits, price moves fast and violently. But Here’s the Truth: This Could Be Bitcoin’s Last Big Run Before a Major Crash As bullish as the setup is, the warning signs for a future correction are already visible: Leverage in derivatives markets is rising Funding rates are turning positive Profit-taking on-chain is increasing Smart money is slowly distributing on strength This suggests we’re heading toward the last big push — a blow-off top. Historically, after each parabolic top, BTC experiences a 40%–70% correction. So while $140,000+ seems very achievable in the coming months, traders must stay alert. Euphoria is the most dangerous time in the market. Conclusion Bitcoin is poised for a powerful bullish move that could send it above $ 140,000 in the near future , driven by institutional accumulation, post-halving supply shock, and strengthening technical structures. But this rally may also represent the final hurrah before a deep correction that resets the entire market. Smart investors will ride the wave — but they will also prepare for what comes next.
TRUMP MEME COIN TO $77 – LAMBO SEASON IS WILL BE HERE!

I just did what any rational investor would do… SOLD MY CAR TO GO ALL-IN ON TRUMP COIN! 🚗➡️🚀 Because who needs wheels when you’re aiming for a Lamborghini by year-end?Currently sitting at $10, this absolute rocket ship is gearing up for a 777% move to $77—a number so patriotic it might just get its own national holiday. Elliott Wave 2.0, Fibonacci magic, and pure meme momentum all align for a face-melting rally!🔥 Catalysts fueling the moon mission:✅ 2024 election hype = infinite liquidity✅ Meme magic = unstoppable retail FOMO to kick in✅ "Only up" is my new trading strategyBy the end of the year, we’re either driving Lambos or explaining to Uber drivers how we were “early”. ALL IN, BABY! 🚀🇺🇸
Going Long on ETH with 100x Leverage !

Alright, let’s talk about a high-probability setup that I’m trading right now—long ETH, stop-loss at $1,935, take-profit at $2,300. This isn’t just a random entry; it’s based on a super reliable pattern called a Running Flat.What’s a Running Flat?A Running Flat is a repetitive market structure that occurs all the time—so often, it feels like an infinite money glitch. It plays out nearly 90% of the time, making it one of the easiest and most profitable patterns to trade.Think of it like a market cheat code:📌 It traps early shorts📌 It creates liquidity for smart money📌 It explodes in the direction of the trendAnd when you spot it? You take the trade, set your stop, and let the magic happen.Why This ETH Trade?We’ve got a textbook Running Flat formationThe market is primed for a breakoutThe EW 2.0 model confirms the setupRisk is tightly managed (SL at $1,935 means no overexposure)100x Leverage – High Risk, High RewardI know what you’re thinking: 100x leverage? Are you crazy? Well, maybe a little. But when you’re trading a setup with a 90% win rate, it’s all about maximizing opportunity while keeping risk under control. Tight stop, big reward. Simple.The Trade Plan✅ Go long ETH✅ Stop-loss: $1,935 (discipline matters)✅ Take-profit: $2,300 (targeting the move)✅ Risk-reward: Favorable and repeatableFinal ThoughtsIf this trade works, it’s another example of why Running Flats are pure magic. If it doesn’t? No big deal—we trade the next one.But history says… we’re about to print money. Let’s see if the infinite money glitch delivers again. 🚀it seems we were wrong and the prices will fall to 1700, I have got into shorts. will add more of the prices went up a bit. Im shortim out of shorts.
Going Long on NVDA !
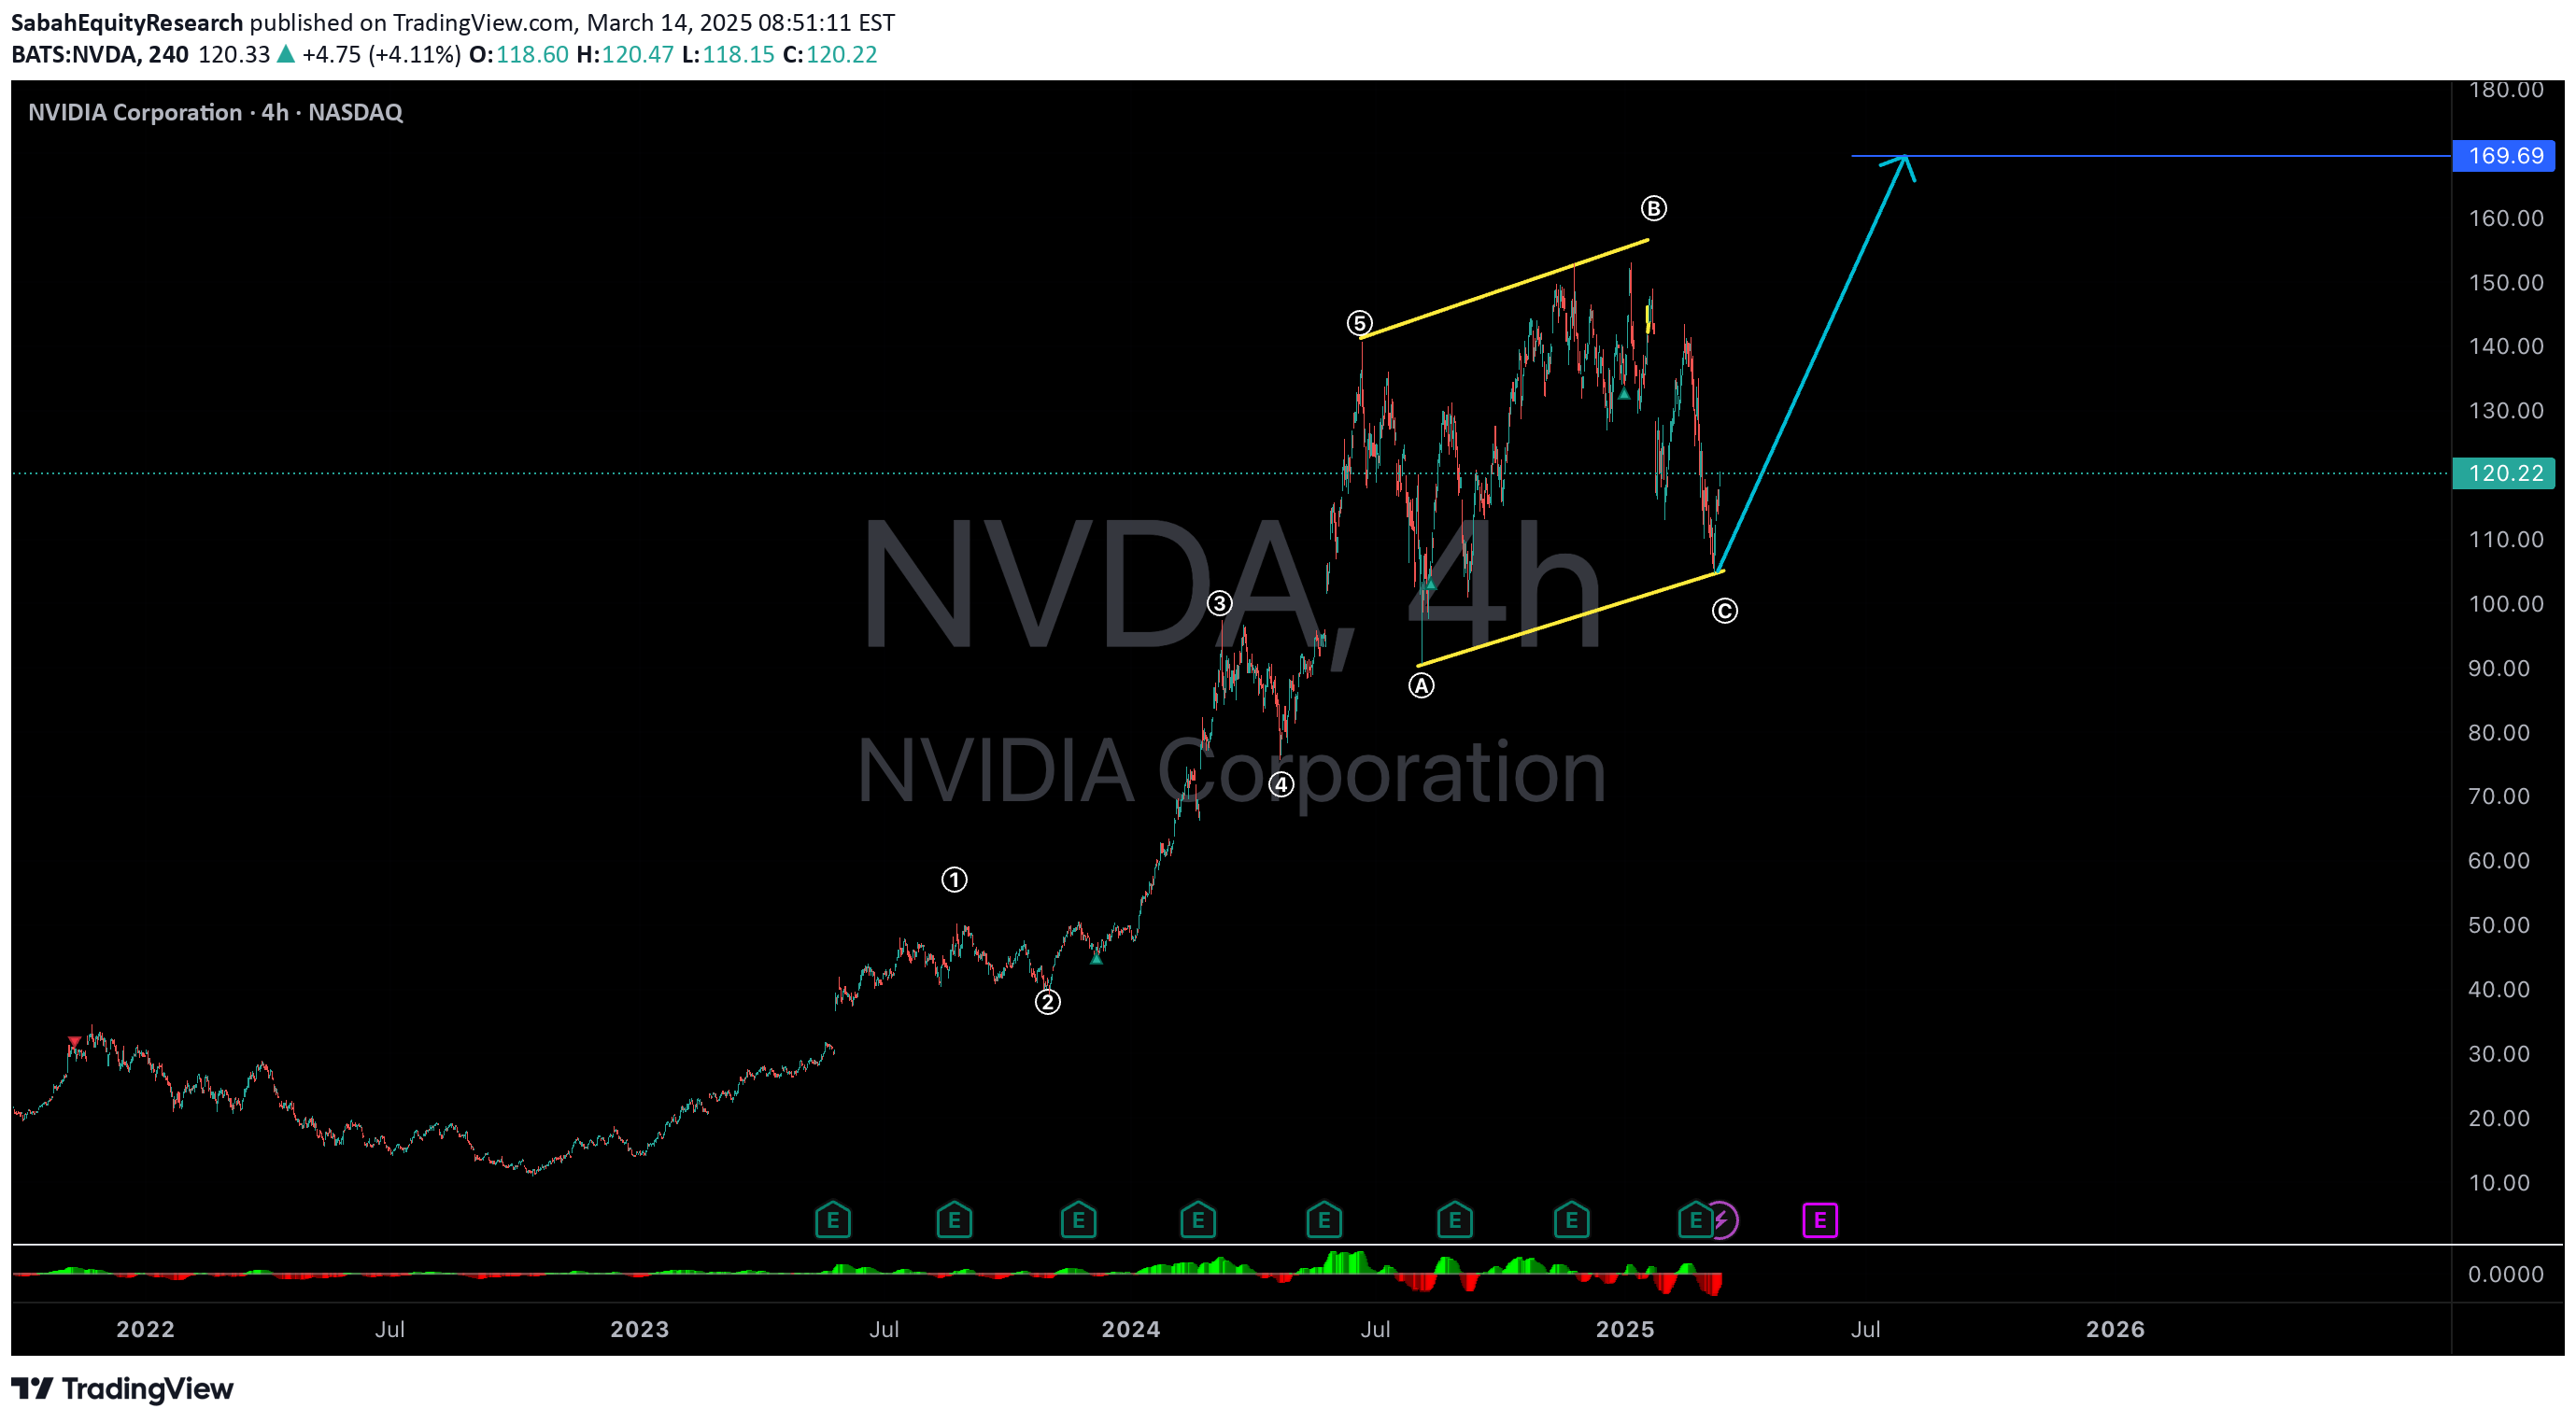
NVIDIA (NVDA) has been a powerhouse stock, riding the wave of AI, gaming, and data center demand. Recently, the stock experienced a correction, which might have caused some investors to hesitate. However, from an Elliott Wave 2.0 perspective, this pullback was nothing more than a natural ABC correction following a classic 1-2-3-4-5 impulse wave—a textbook setup for long-term bulls. Understanding the ABC Correction in NVDA In Elliott Wave theory, after a strong five-wave rally, the market typically experiences a three-wave pullback (ABC correction) before continuing its long-term uptrend. This correction serves to shake out weak hands, reset overbought conditions, and set the stage for the next bullish impulse. The A-wave is the initial drop as profit-taking kicks in. The B-wave is the temporary bounce, often mistaken for a continuation. The C-wave completes the correction, offering smart investors an ideal entry point. NVDA’s recent pullback aligns perfectly with this structure, meaning the next leg up could be just around the corner. Why NVDA Remains a Strong Long-Term Bet AI Dominance – NVIDIA is at the center of the AI revolution, with its GPUs leading the industry. Data Center Growth – Demand for high-performance computing continues to surge. Technical Reset – The stock has worked off overbought conditions and is finding new support levels. The Opportunity: A Strategic Long Entry Now that the ABC correction has played out, NVDA presents an excellent long entry for those looking to ride the next bullish wave. With strong fundamentals and a technical reset, the stock is primed for another 1-2-3-4-5 impulse move, potentially leading to new all-time highs. For traders who understand market structure, this is a golden opportunity to go long before the next explosive rally begins. 🚀im in with a stop loss below $90, targeting 169.6, might hold my position till year end.Im all in, expecting an explosion right from here
Bitcoin to $120K: The Final Wave?

Bitcoin is back in the spotlight, and the charts suggest we may be entering the highly anticipated 5th wave to the upside. A move to 120K is increasingly likely as institutional adoption grows, supply remains scarce, and the narrative of Bitcoin as digital gold continues to strengthen.However, markets are never a straight line. On the contrary, The unlikely option for the Bitcoin is it could see a dip below 85K in the near term before resuming its climb. Short-term corrections are part of the game, but the bigger picture remains bullish. With halving on the horizon and growing global demand for store-of-value assets, Bitcoin’s long-term trajectory points upward.The 5th wave could be the most explosive yet. While volatility is inevitable, the journey to 120K seems to be just a matter of time. Bitcoin remains the king of crypto, and this bull run still has fuel in the tank.Not a financial advice, do your own due diligence.I'm in. with stop loss at recent low of 89k.
ETH Heading Towards New All-Time Highs

Sabah Research has recently published a compelling analysis suggesting that Ethereum (ETH) is on track to reach new all-time highs (ATHs) of $4,900. This projection is supported by technical analysis using Elliott Wave Theory 2.0, as well as a favorable Trump Presidency toward crypto currencies. Elliott Wave Theory 2.0 AnalysisAccording to Elliott Wave Theory 2.0, ETH is currently in the early stages of the fifth impulsive wave, which began approximately four months ago. Elliott Wave Theory posits that market movements follow a predictable wave structure, with five waves in the direction of the prevailing trend (impulsive waves) and three corrective waves against it. The fifth wave is typically characterized by a strong bullish momentum, often exceeding previous highs.Sabah Research notes the following key points from the Elliott Wave analysis:Wave 4 Correction Completed: The recent market correction (Wave 4) provided ETH with a strong support level, forming a foundation for the next impulsive phase.Wave 5 Momentum Building: Early indicators suggest strong bullish momentum as ETH's price action aligns with historical patterns observed in previous fifth waves.Target Price of $4,900: Based on Fibonacci extensions and historical price behavior, the fifth wave is projected to push ETH to a new ATH of $4,900.Disclaimer: This research is for informational purposes only and should not be considered financial advice.
Textbook long idea on ETHUSD based on Elliot Wave !

ETH appears to have completed a textbook 5-wave impulse pattern, followed by an ABC corrective wave. This structure suggests the current move is a running flat, which implies prices are likely headed directly towards $3,000 from here.Key points:- ETH has traced out a clear 5-wave impulse pattern, followed by an ABC correction- The corrective pattern is likely a running flat, a bullish continuation pattern- Expect ETH to surge towards $3,000 as the running flat plays out- Use $2,500 as the stop loss for this bullish trade setupOverall, the Elliott Wave structure points to significant upside potential for ETH, with $3,000 as the next major target. Traders can look to enter long positions with a stop loss at $2,500 to capitalize on this bullish forecast. Of course, always conduct your own due diligence and risk management when trading.
The Opportunity of The Year: A Perfect Long Entry on BTC ?

Bitcoin’s recent pullback to 76K has sparked concerns among traders, but for those following Elliott Wave 2.0, this correction is nothing more than a textbook WXYXZ retracement after a powerful 1-2-3-4-5 impulse wave.Wave Structure: A Perfect Setup for the Next MoveWave 1 began around 50K, kicking off the strong uptrend.Wave 5 peaked at 107K, completing the impulsive move.The current decline to 76K aligns perfectly with a wave-2-style correction, which is essential before the next leg up.WXYXZ Correction: The Smart Money Entry ZoneIn Elliott Wave 2.0, A WXYXZ correction is a natural and necessary part of market cycles. This isn’t a sign of weakness—it’s a cooldown before the next explosive run.The Next Leg Up: Preparing for Wave 5According to Elliott Wave 2.0, the cool gains come from Wave 5, which follows a WXYXZ correction. With Bitcoin cooling off at key Fibonacci levels, the next move could send it past 140K+ in the coming months.With Institutional demand remains high, and spot Bitcoin ETFs continuously absorbing supply.The halving effect is still in play, historically driving BTC to new highs post-event.Smart money isn’t panicking—they’re accumulating. This correction isn’t a crash, it’s a reset before the next parabolic wave. 🚀im in at 82k, targeting 140k+.I closed my long, and put a long order at 83k. if it goes up from here my longs will be activated short term we might drop.
MELANIA MEME COIN TO THE MOON – 800% BY SUMMER 2025!

Ladies and gentlemen, buckle up! Melania Coin is about to do what even Melania Trump couldn’t—stick around for the long haul. Experts (aka my cousin who trades from his mom’s basement) predict an 800% explosion by Summer 2025.Why? Because logic doesn’t apply in meme land. Dogs had their run, frogs got their shine—it’s time for First Lady finance.Technical analysis? It’s bullish.Fundamentals? Who cares?Vibes? IMMACULATE.By 2025, you’ll either be sipping mojitos on a yacht or explaining to your friends why "just one more dip" was a bad idea. Choose wisely. 😂
Bitcoin's Bullish Momentum: A Look at the Elliott Wave Analysis

Bitcoin enthusiasts and investors have reasons to celebrate as recent analyses suggest that the worst might be behind us. Using the Elliott Wave 2.0 framework, I have identified a textbook 12345 impulse wave followed by an ABC corrective pattern, indicating a potential bullish trend on the horizon.Understanding Elliott Wave 2.0The Elliott Wave Theory is a popular technical analysis tool used to predict market trends by identifying repetitive wave patterns. The recent application of Elliott Wave 2.0 has provided a more refined approach, helping analysts foresee potential movements in Bitcoin's price.The 12345 Impulse WaveThe 12345 impulse wave signifies a strong upward trend, characterized by five distinct waves:Wave 1: Initial surge, often driven by increased demand.Wave 2: A slight pullback, typically not exceeding the starting point.Wave 3: The most extended and powerful wave, reflecting strong market confidence.Wave 4: A moderate correction, providing a buying opportunity.Wave 5: Final push upward, often fueled by optimism and media hype.The ABC CorrectionFollowing the 12345 pattern, an ABC corrective wave usually appears:Wave A: Initial decline as the market cools off.Wave B: Temporary recovery, sometimes mistaken for a new uptrend.Wave C: Final drop, completing the correction phase.What This Means for BitcoinWith the completion of the ABC correction, I can suggest that Bitcoin is poised for another upward trajectory. This aligns with broader market sentiments and recent increases in institutional interest and adoption.While market predictions are never guaranteed, the application of Elliott Wave 2.0 offers a promising outlook for Bitcoin. Investors should remain vigilant, yet optimistic, as the cryptocurrency landscape continues to evolve. As always, it's crucial to consider multiple factors and engage in thorough research before making investment decisions.
Disclaimer
Any content and materials included in Sahmeto's website and official communication channels are a compilation of personal opinions and analyses and are not binding. They do not constitute any recommendation for buying, selling, entering or exiting the stock market and cryptocurrency market. Also, all news and analyses included in the website and channels are merely republished information from official and unofficial domestic and foreign sources, and it is obvious that users of the said content are responsible for following up and ensuring the authenticity and accuracy of the materials. Therefore, while disclaiming responsibility, it is declared that the responsibility for any decision-making, action, and potential profit and loss in the capital market and cryptocurrency market lies with the trader.