
Raphael_TraderGOLD
@t_Raphael_TraderGOLD

What symbols does the trader recommend buying?
Purchase History
پیام های تریدر
Filter
طلا در دوراهی حساس: برگشت به عقب یا سقوط به منطقه تقاضا؟
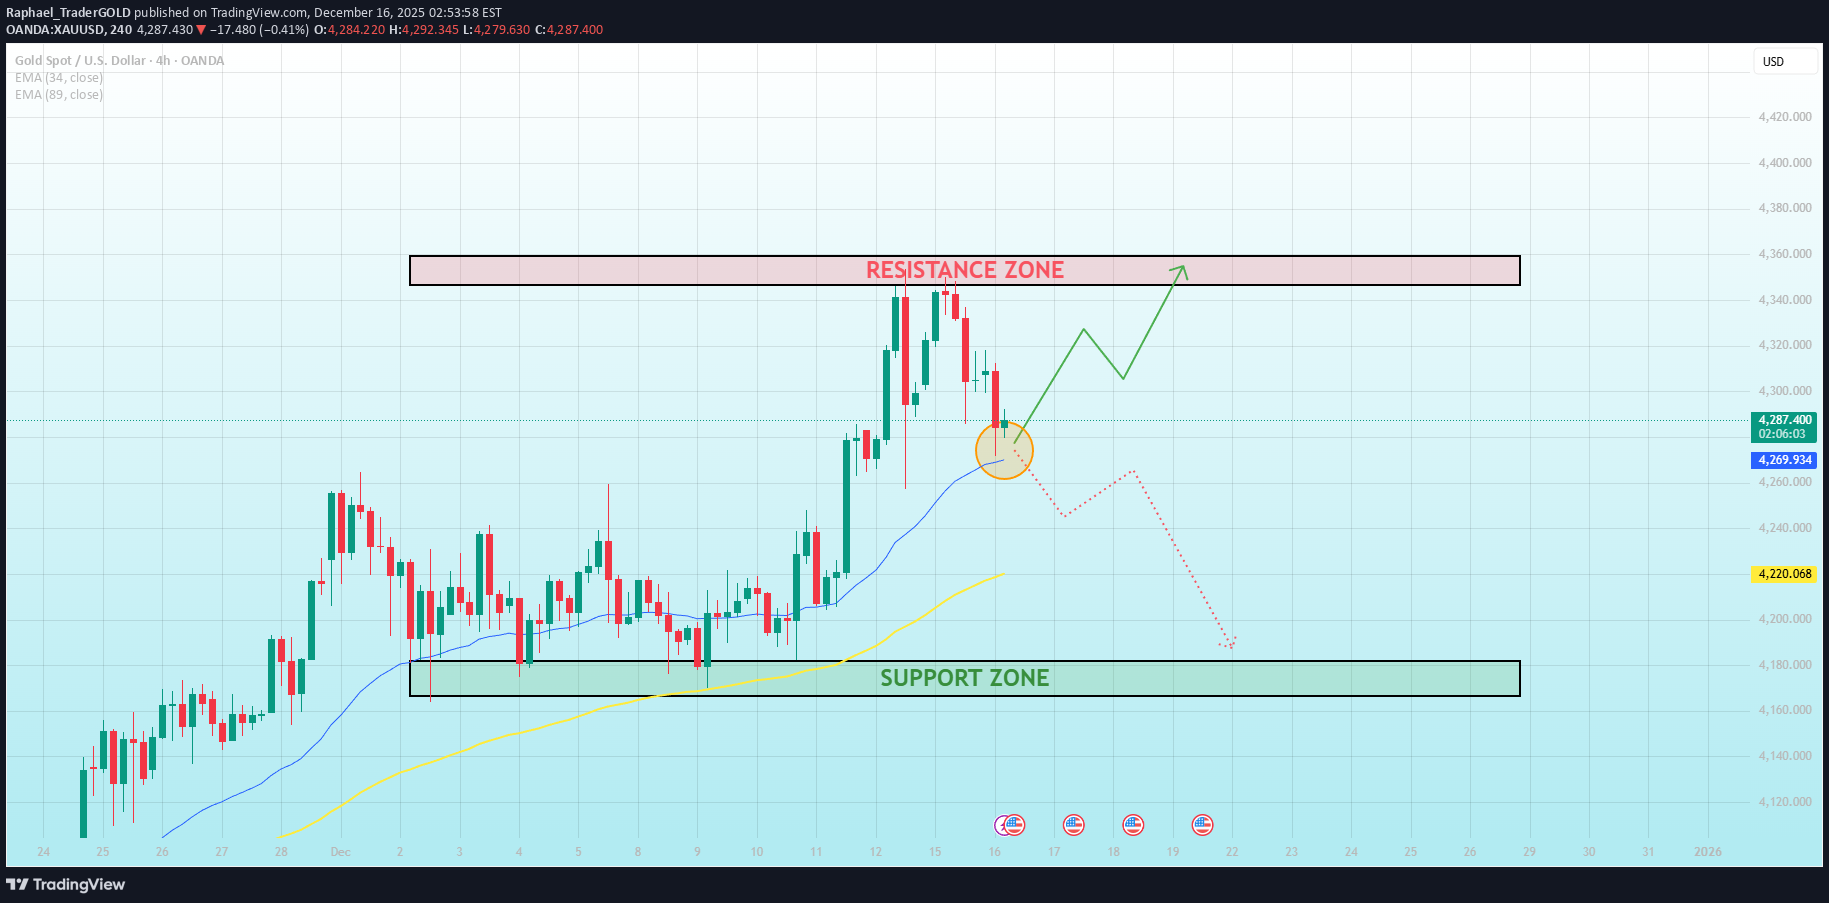
MARKET BRIEFING – XAU/USD (4H) Market State: Gold remains in a broader bullish structure, but short-term momentum has cooled after repeated rejection from the major resistance zone. Price is currently reacting around the EMA cluster, a critical decision area. Key Levels: – Resistance Zone: 4,330 – 4,360 – Dynamic Support (EMA area): ~4,260 – 4,270 – Major Demand Zone: 4,170 – 4,190 Price Action: – The impulsive rally stalled under resistance, followed by a controlled pullback no panic selling, suggesting profit-taking rather than trend failure. – Current candles show hesitation near the fast EMA, indicating buyers are testing commitment. – As long as price holds above the EMA structure, the trend remains constructively bullish. Scenario Outlook Primary Scenario – Bullish Continuation: – Price holds above 4,260 – 4,270 – Higher low forms – Rotation back toward 4,330 – 4,360 resistance – A clean acceptance above this zone opens the path toward new ATH Alternative Scenario – Deeper Reset: – Failure to hold EMA support – Pullback extends into 4,170 – 4,190 demand – This would be a structural retest, not a trend reversal Macro Alignment (Why This Setup Makes Sense) – Fed still restrictive, but rate-cut expectations remain alive, keeping Gold structurally supported – US yields capped, limiting downside pressure – Ongoing geopolitical uncertainty continues to provide underlying bid Gold is not breaking down — it’s deciding. This pullback is either the last reload before expansion, or a healthy reset into demand. What do you think about GOLD at this level?
طلا از نفس افتاد! پایان پولبک و شروع فاز "توزیع" ترسناک
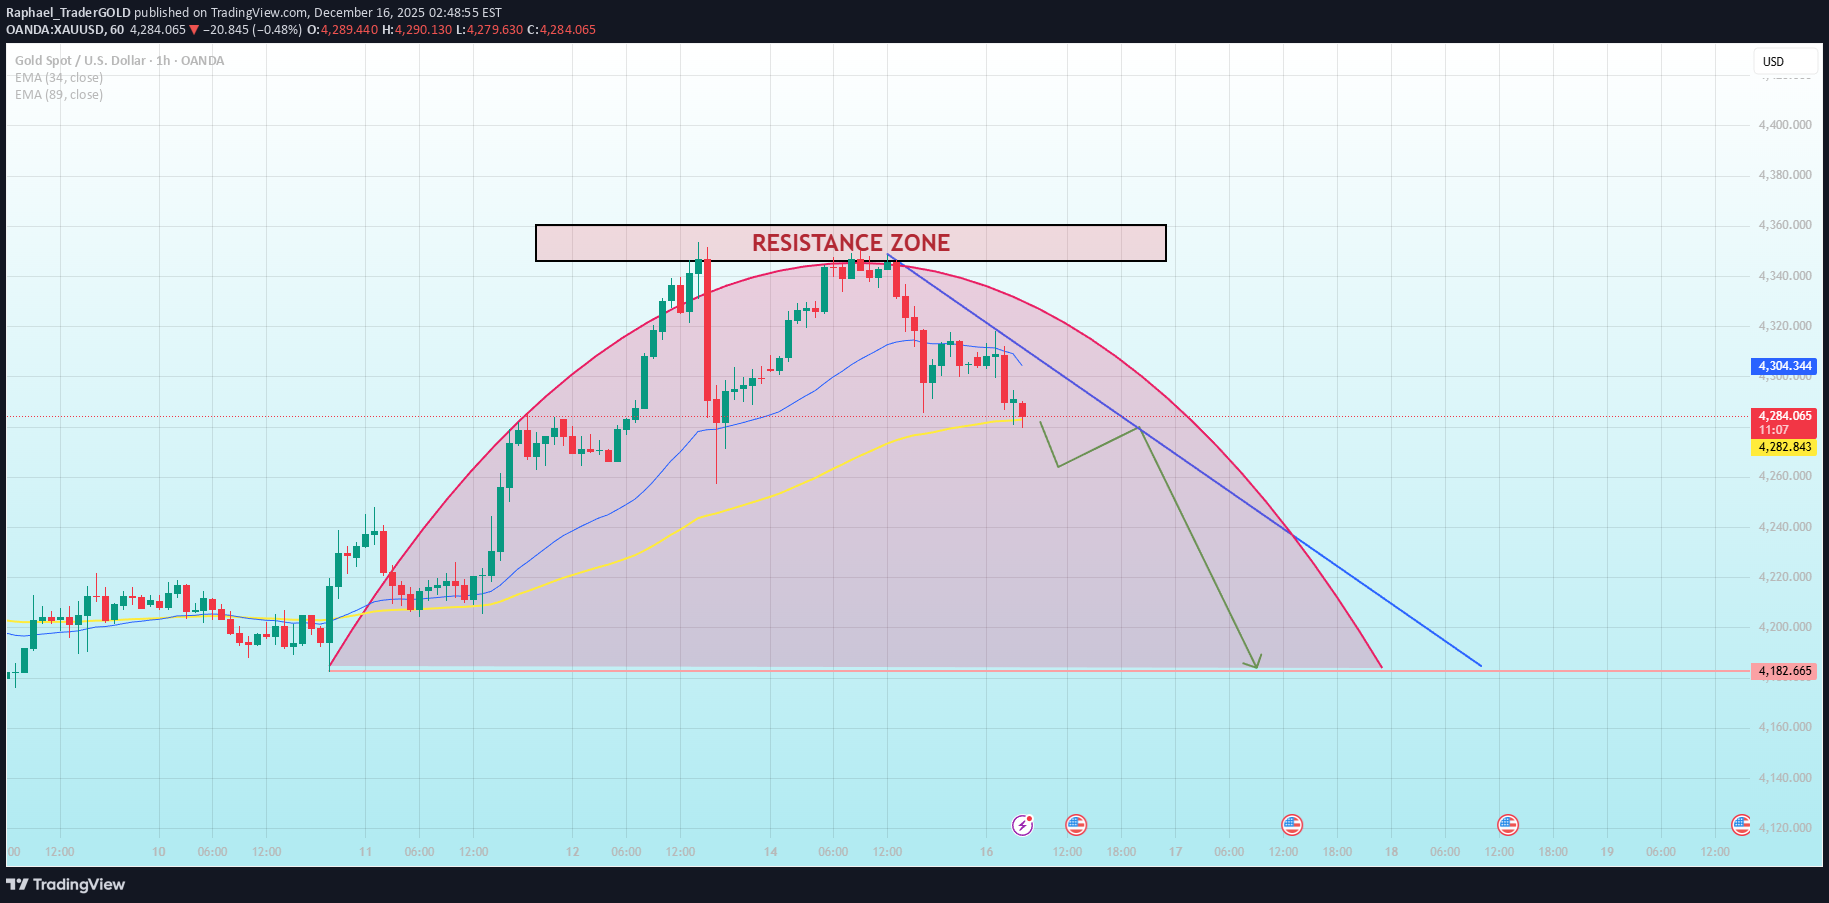
MARKET BRIEFING – XAU/USD (1H) Market State: Gold has failed to break and hold above the major resistance zone, triggering a clear momentum rollover. The recent structure is no longer a healthy pullback it is distribution after exhaustion. Technical: – Price formed a rounded top under resistance, signaling buyer fatigue. – Breakdown below the fast EMA, followed by rejection at the mid EMA, confirms trend deceleration. – Structure shifted from higher highs to lower highs, validating short-term bearish control. Key Levels: – Resistance Zone: 4,330 – 4,360 – Immediate Supply / Rejection: ~4,300 – Downside Target / Demand: 4,180 – 4,200 Macro Context (Why This Matters) – USD stabilizing after recent pullback → reduces upside pressure for Gold. – US yields holding firm, limiting non-yielding asset demand. – No fresh geopolitical escalation → safe-haven premium fading. – Market is shifting from “fear bid” to risk rebalancing mode. This macro backdrop aligns perfectly with the technical distribution pattern on Gold. Scenario Outlook Primary Scenario – Controlled Pullback: – Price continues to respect EMA resistance – Gradual bleed lower toward 4,180 – 4,200 demand – Any bounce into 4,300 remains a sell-the-rally zone Invalidation: – Only a strong reclaim and acceptance above 4,360 cancels the bearish thesis Gold is not consolidating for continuation. It is unwinding excess long positioning under a macro-neutral backdrop. Momentum favors patience on the downside, not chasing strength. What do you think about GOLD at this level?
BTC Is Quietly Accumulating Below 86K
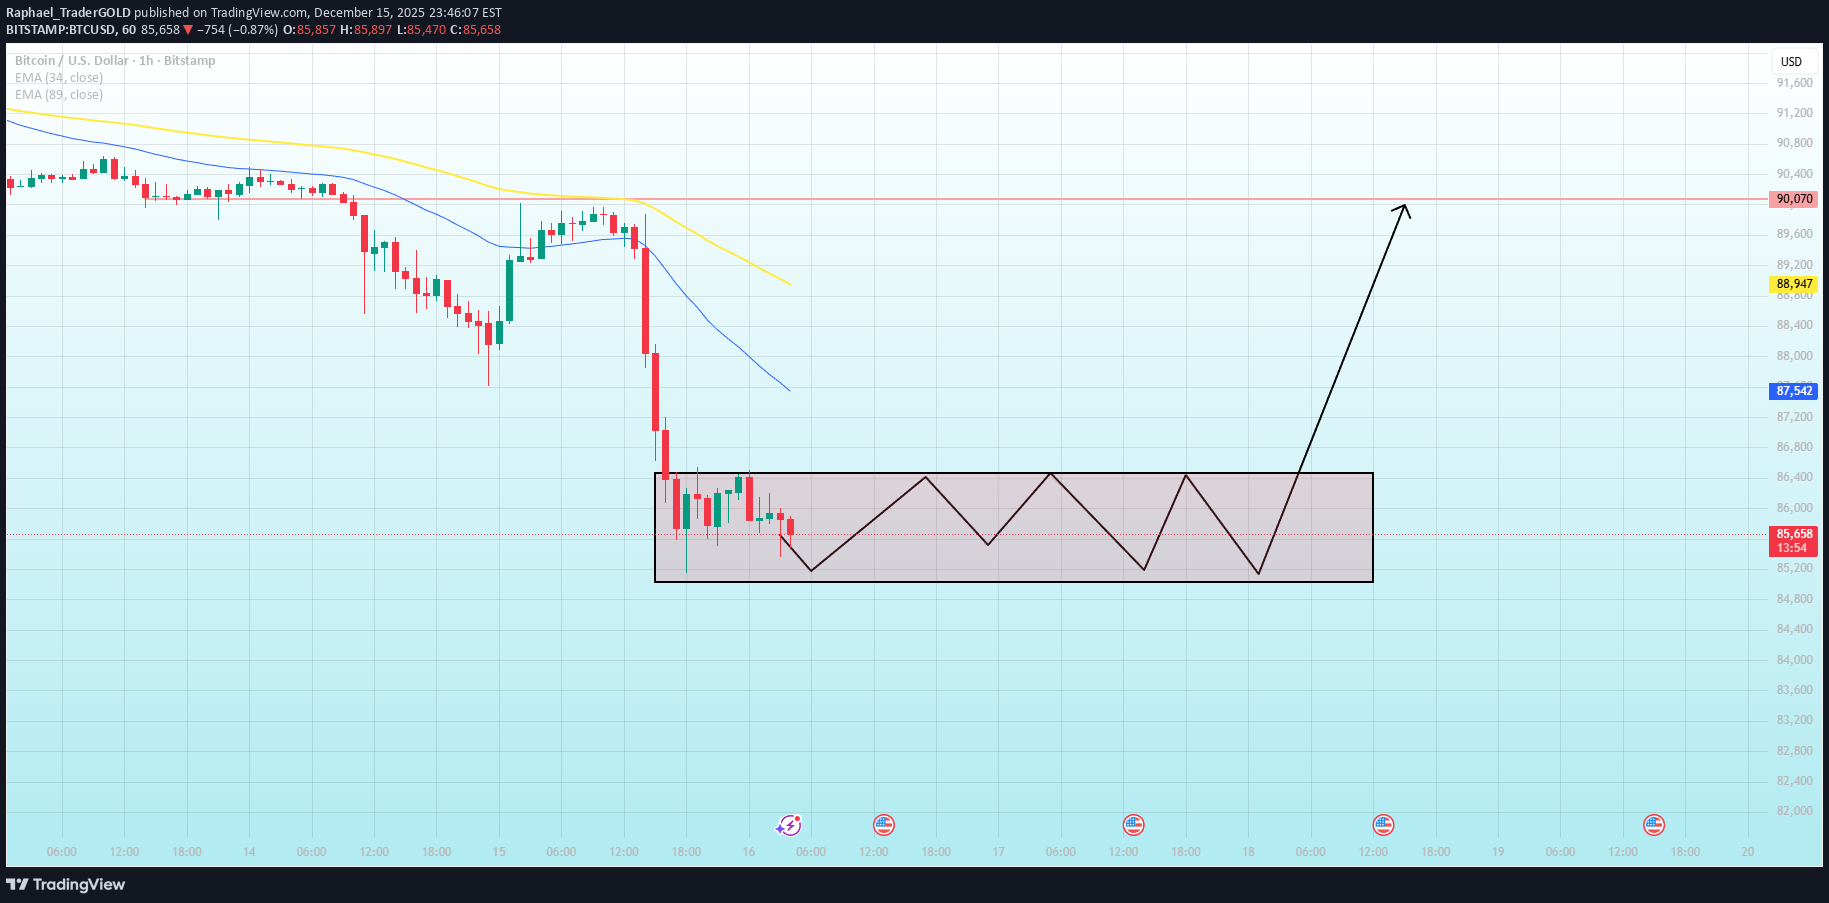
BTC/USD H1 — Market Update Bitcoin is currently trading around 85,600, consolidating after a sharp impulsive sell-off from the 90,070 high. The aggressive drop flushed short-term liquidity and forced price into a range-bound re-accumulation phase, which is clearly visible inside the highlighted box. Key Levels From the Chart Major Resistance: 90,070 → Previous supply zone and key breakout level. A reclaim above this level would confirm trend continuation. EMA 34 (H1): 87,541 EMA 89 (H1): 88,947 → Both EMAs are acting as strong dynamic resistance, explaining why upside is capped for now. Accumulation Range: 85,200 – 86,400 → Price is oscillating inside this box, showing balance between buyers and sellers. Current Price: ~85,639 Market Structure & Expectation BTC is not breaking down further despite heavy selling a sign of absorption. The zigzag price action inside the box suggests liquidity building, not weakness. As long as 85,200 holds, downside risk remains limited. Once liquidity is fully built, a range expansion is likely. Scenarios Base case: Continued sideways movement between 85,200 – 86,400 Bullish scenario: Break above range → reclaim 87,500, then acceleration toward 90,070 Invalidation: Clean break below 85,200 would open deeper downside
ETH Is Compressing Between 2,860 and 3,020
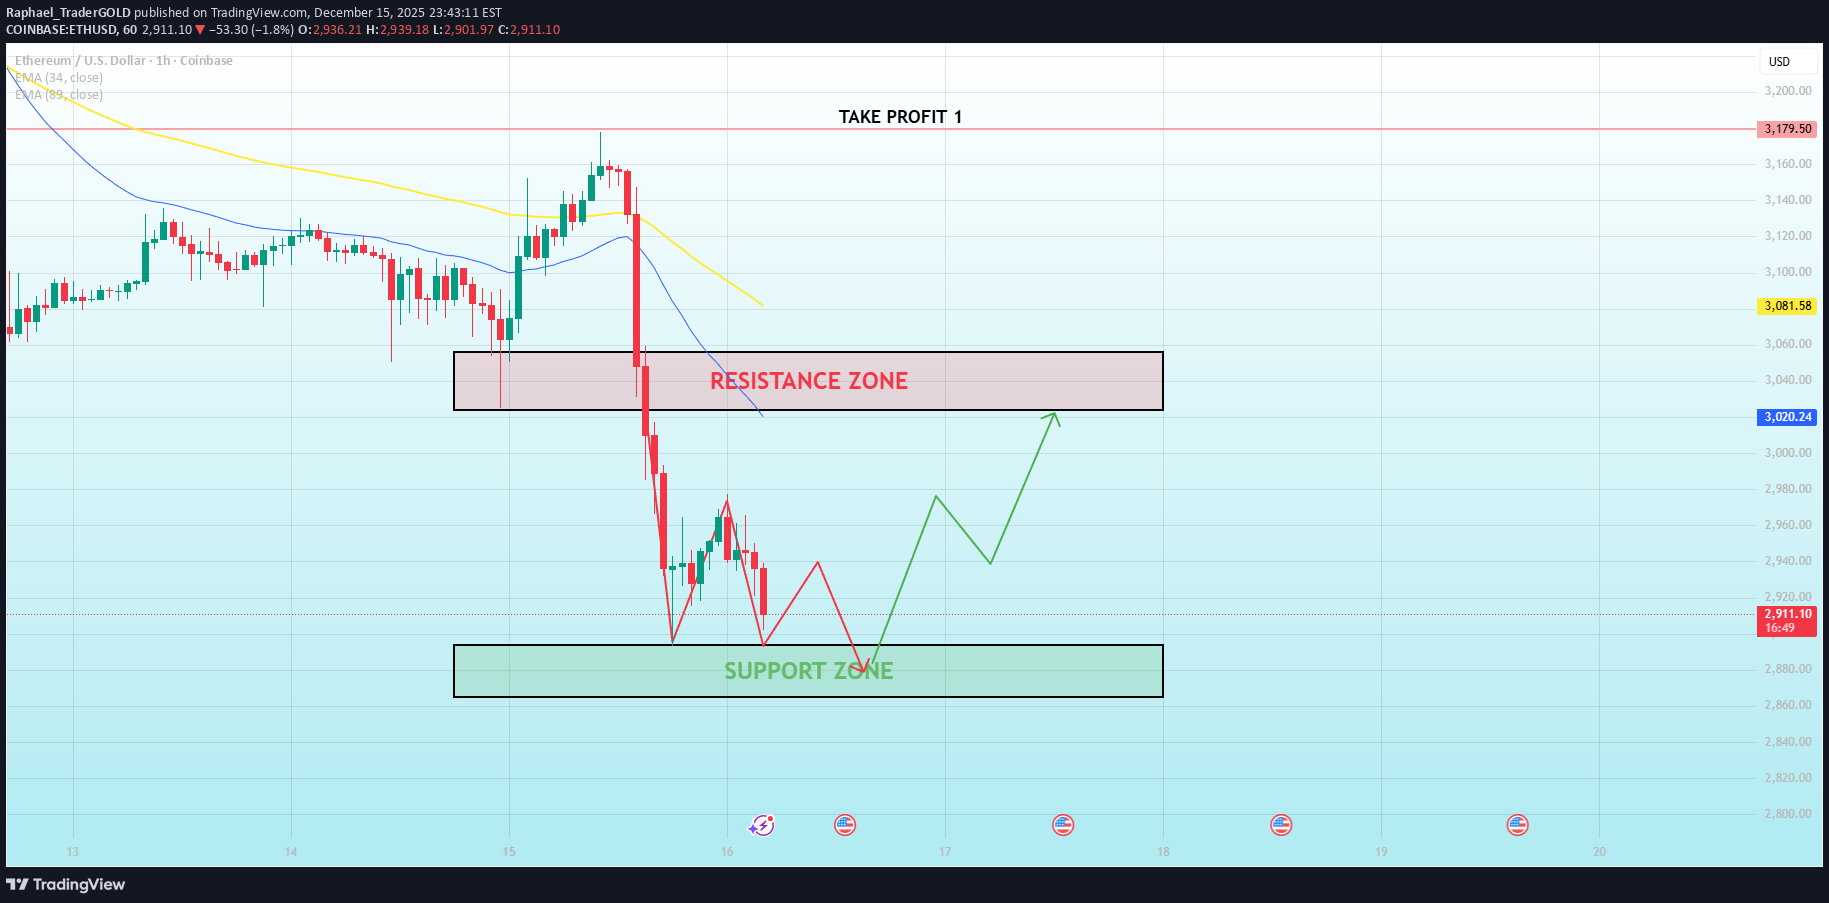
ETH/USD H1 — Market Update ETH is currently trading around 2,908, consolidating after a sharp sell-off from the recent high near 3,179.50. This impulsive drop cleared short-term liquidity and forced the market into a reset phase. Key Levels From the Chart Major Resistance Zone: 3,020 – 3,050 → This is the supply zone where price was aggressively rejected. A reclaim above this area would signal a bullish shift. EMA 34 (H1): ~3,020.10 EMA 89 (H1): ~3,081.53 → Both EMAs are currently acting as dynamic resistance, explaining why price needs consolidation before any upside continuation. Major Support Zone: 2,860 – 2,900 → Strong demand zone where buyers are expected to defend aggressively. Current Structure Price is holding above the support zone, showing stabilization rather than continuation lower. The projected price path suggests: - Short-term sideways accumulation between 2,900 – 2,960 - Followed by a recovery push toward 3,000 → 3,020 - A successful break and hold above 3,020 opens the door for a move back into the resistance zone. Outlook Short term: Range-bound / accumulation phase. Mid term: Bullish recovery favored as long as ETH holds above 2,860. Invalidation: A clean break below 2,860 would negate the bullish recovery scenario.
طلا در آستانه جهش تاریخی: هدف بعدی ۴۵۰۰ دلار است!
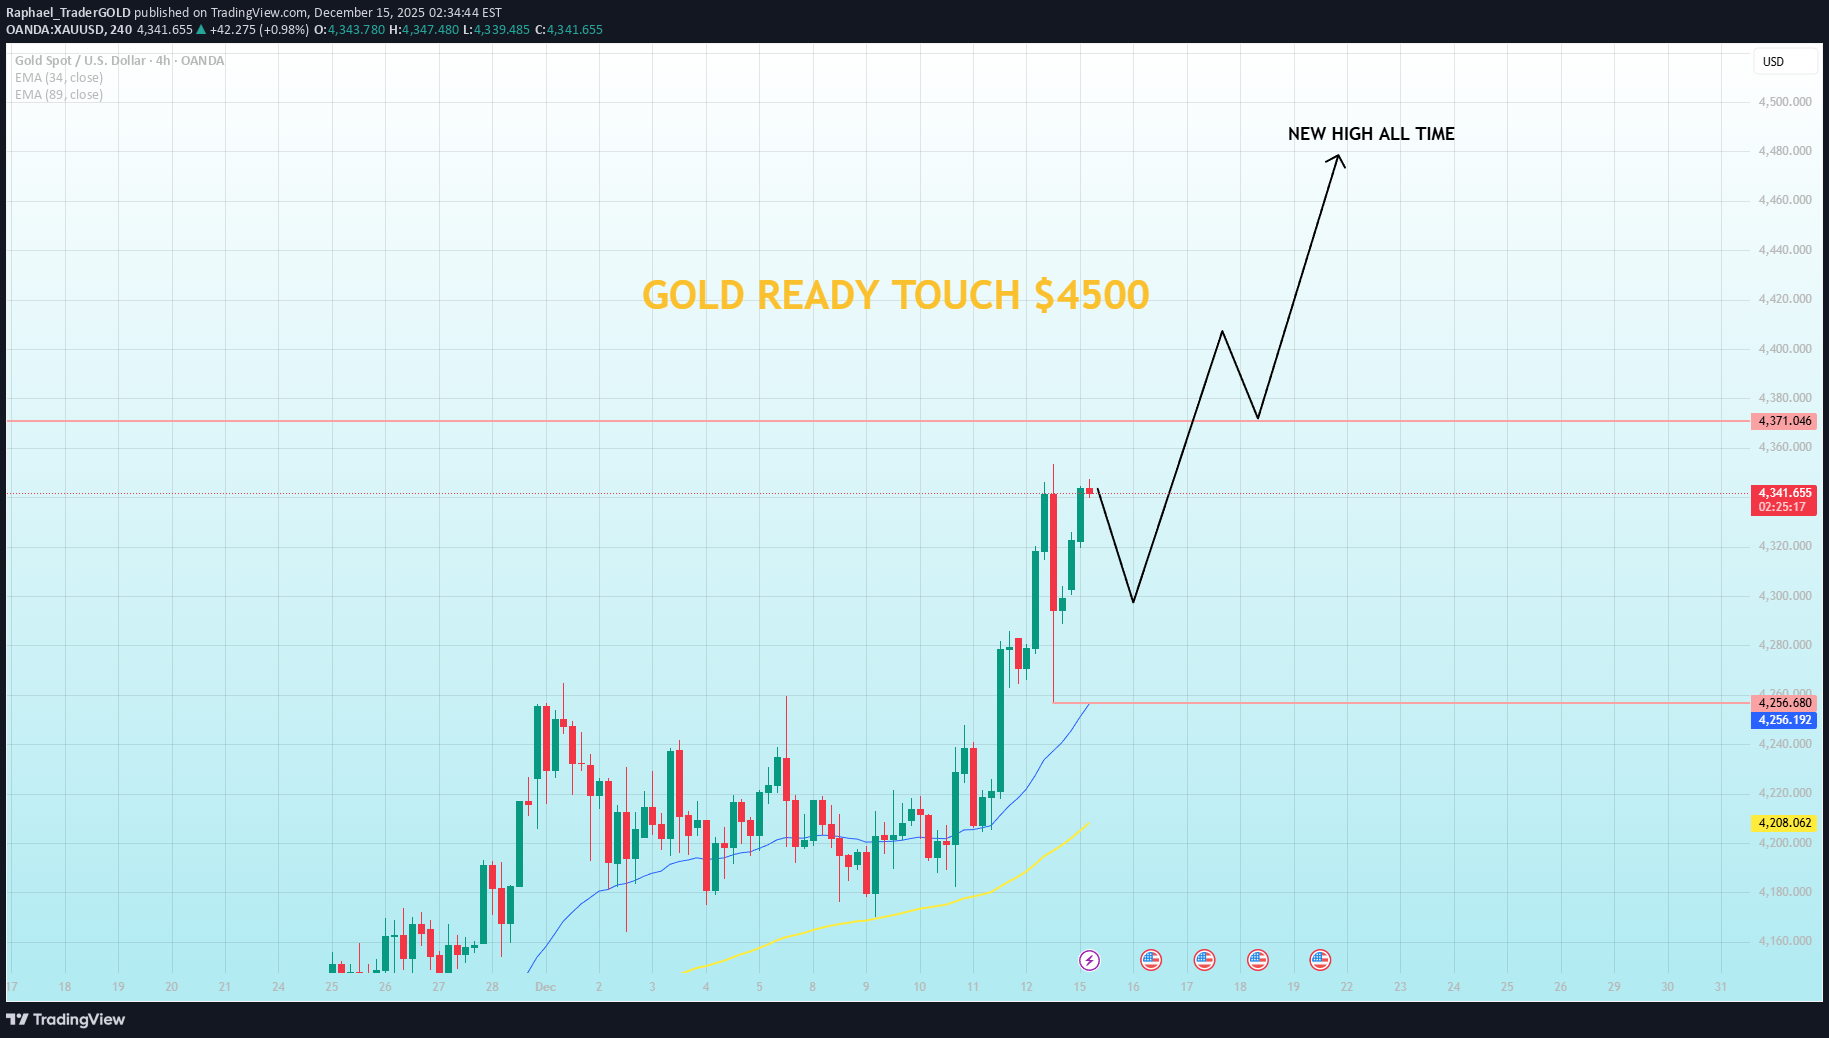
MARKET BRIEFING – XAU/USD (4H) Market State: – Gold remains in a strong bullish structure on H4, trading well above key EMAs and holding higher highs. Momentum is intact; the recent pause is consolidation, not distribution. Key Levels: – Primary Support: 4,250 – 4,260 (EMA cluster / structure base) – Immediate Resistance: 4,370 – 4,380 – Expansion Zone: 4,420 – 4,450 – Upside Objective: 4,500 (New ATH zone) Price Action Read: – Pullbacks are shallow and quickly absorbed, indicating active dip buying. – Structure shows a stair-step advance with brief pauses before continuation — typical of a trend-strength phase. Next Move: – Holding above 4,260 keeps the bullish roadmap intact. Acceptance above 4,380 opens room for range expansion toward 4,450–4,500. Any dip into support is a continuation opportunity, not a reversal signal.Gold Update — Patience Before the Break Gold is consolidating after a strong impulse, not reversing. Macro conditions remain supportive—softening yields, easing expectations from the Fed, central bank buying, and geopolitical risk all favor continued upside. This is a classic accumulation phase below ATH. As long as support holds, the bias stays bullish toward $4,500+. Traders should stay patient and let the breakout come.
Ethereum Tests a Key Flip Zone....
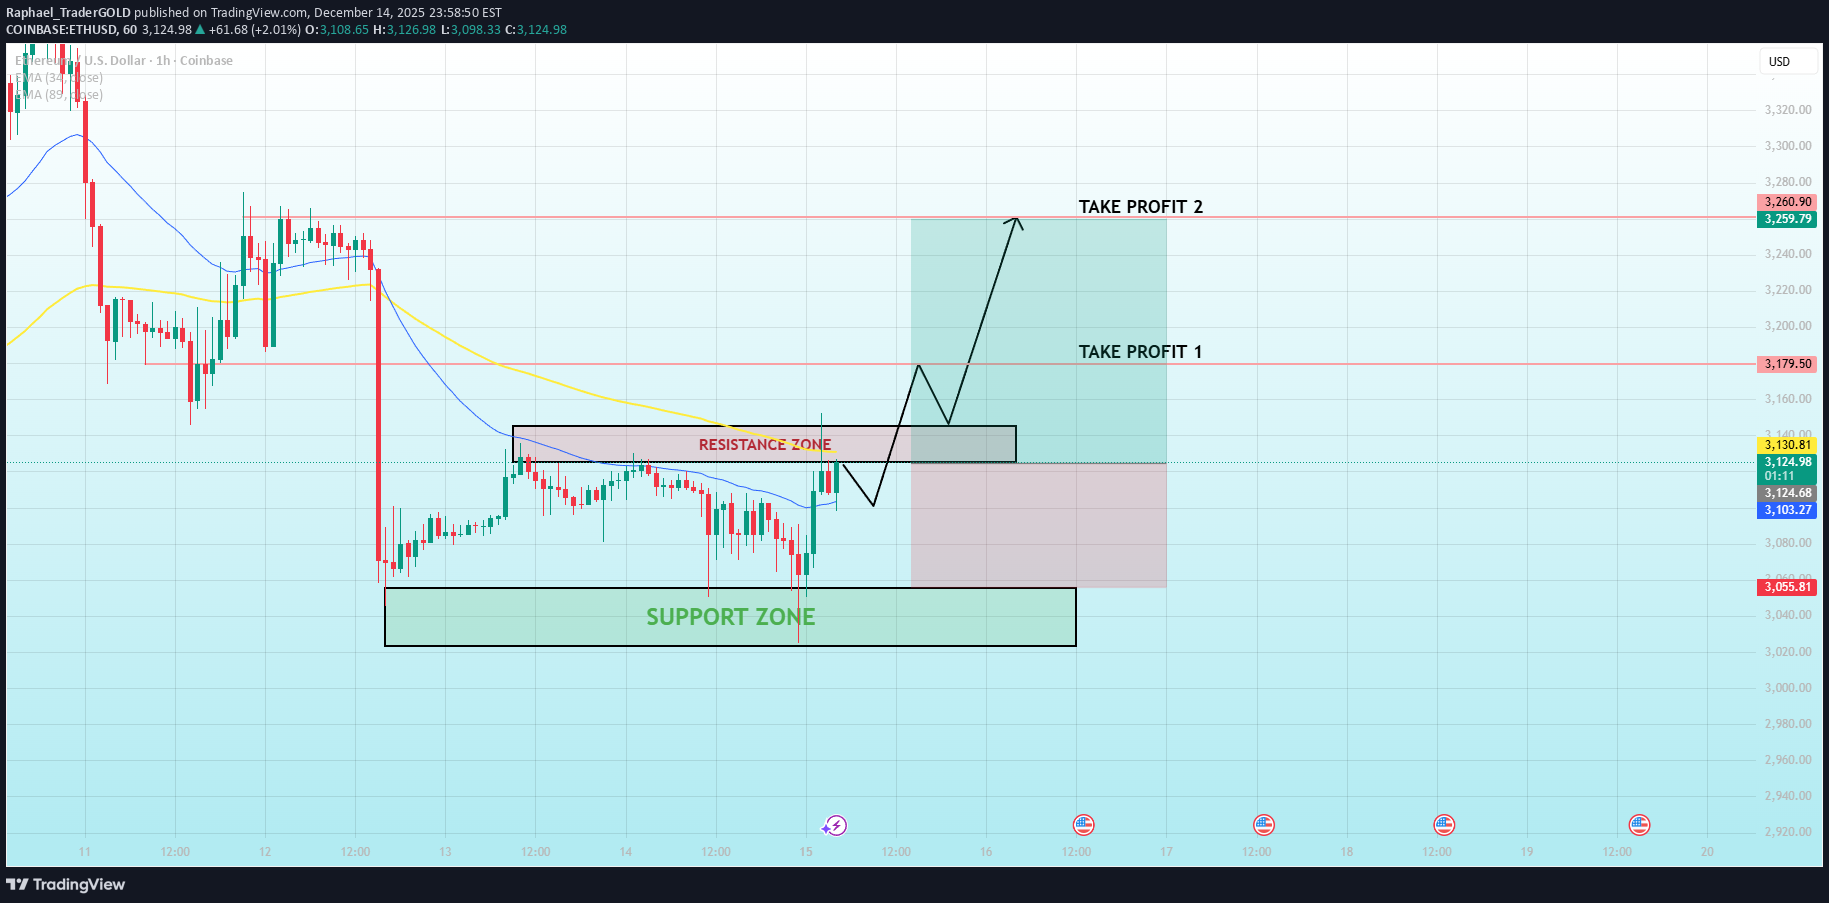
🔹 MARKET BRIEFING – ETH/USD (1H) Market State: – Ethereum has reacted strongly from the lower support zone and is now pressing into a well-defined resistance area. – The impulsive bounce suggests short-term momentum recovery, but price is still interacting with prior supply, making this a decision point rather than a confirmed continuation. Key Technical Levels: – Support Zone: 3,030 – 3,060 – Resistance / Flip Zone: 3,120 – 3,145 – Take Profit 1: 3,175 – 3,185 – Take Profit 2: 3,250 – 3,265 – EMAs are flattening, reinforcing a transition from corrective to neutral structure. 🌍 Macro Context – What Supports the Upside Attempt – Bitcoin Stability: BTC holding above recent lows reduces systemic downside pressure on ETH. – Fed Expectations: With rates priced to remain steady, risk assets are allowed to recover technically, though without aggressive expansion. – Liquidity Rotation: Post-selloff conditions favor mean-reversion rallies, especially from clean support zones. Next Move: – Acceptance above the 3,145 resistance zone would confirm a bullish flip and open the path toward 3,175 → 3,265. – Failure to hold above resistance would likely result in a pullback toward the 3,060 support, keeping ETH range-bound. Bottom Line: – Ethereum is at a make-or-break level. – Strength above resistance confirms continuation rejection reinforces a broader consolidation phase until a clearer macro catalyst emerges.ETH Update ETH is holding above the key support zone, with price compressing after the sharp sell-off. This behavior points to accumulation, not continuation lower. As long as support holds, expect range-building first, then a reclaim of the resistance zone to trigger the next upside leg toward 3,100–3,180. Patience here pays let structure confirm before the move.
Bitcoin Repeats a Familiar Pattern - NEXTZone Is Already Defined
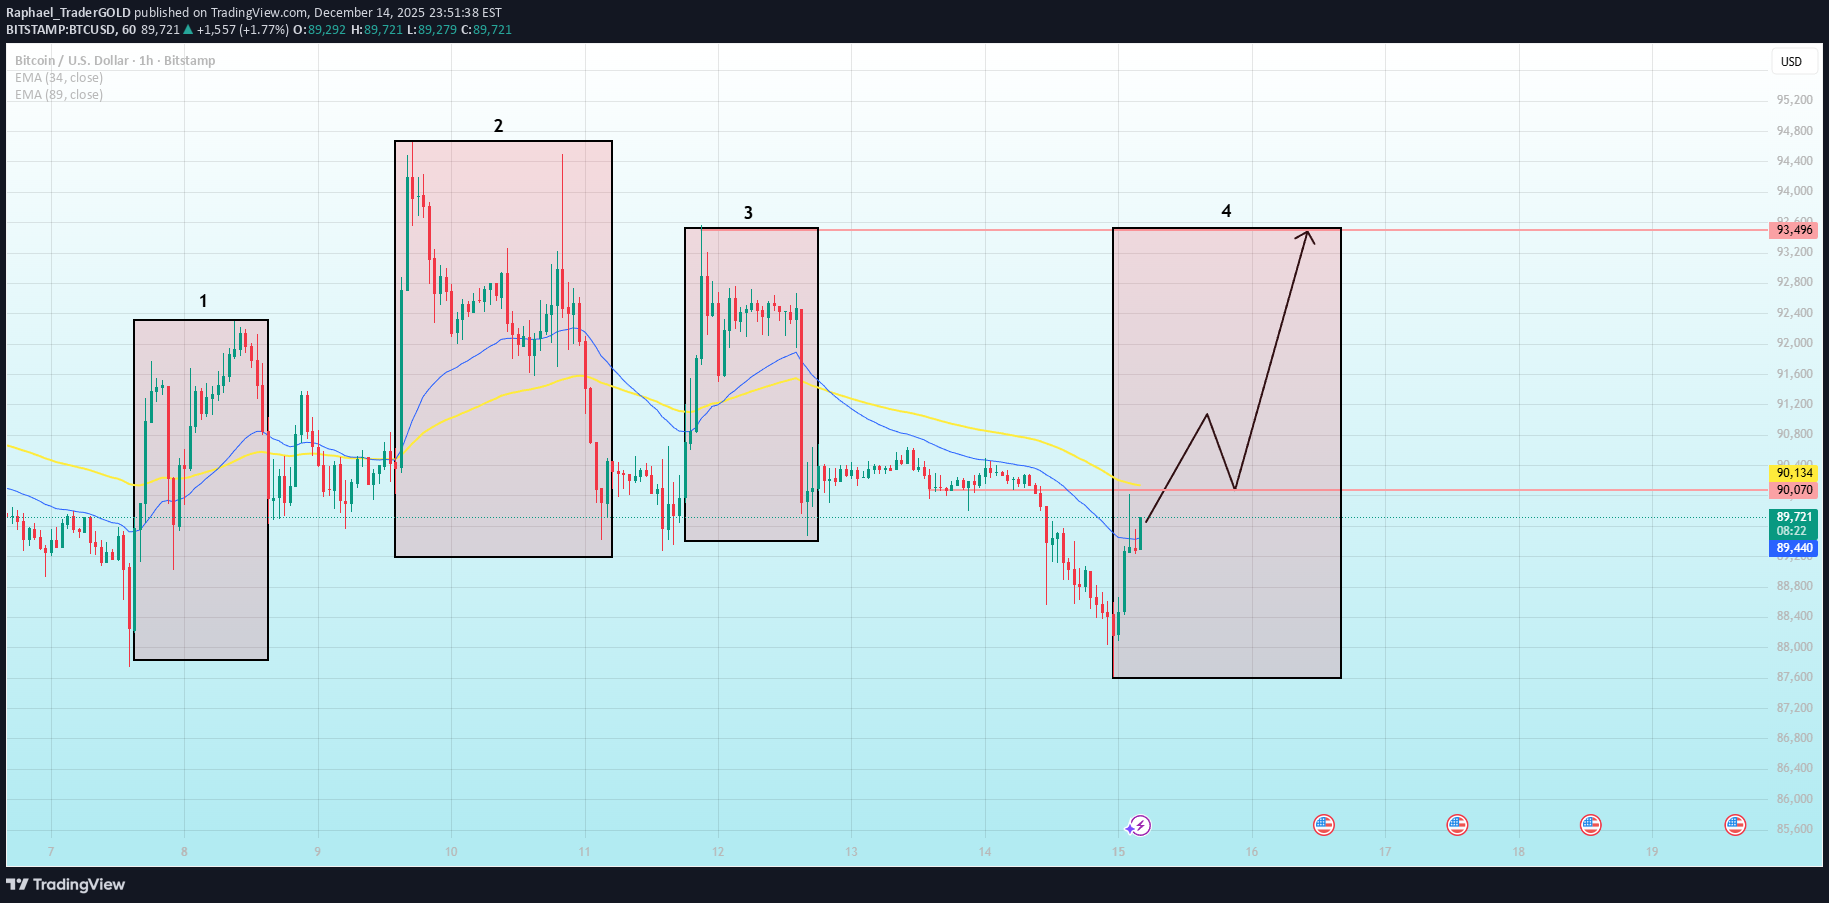
🔹 MARKET BRIEFING – BTC/USD (1H) Market State: – Bitcoin is once again trading inside a repeating range structure, similar to the previous consolidation phases marked (1 → 3). – Price has just rebounded from the lower demand area and is now holding above short-term support, while still trading below the key moving averages, keeping the broader structure neutral-to-corrective. Key Technical Levels: – Demand / Base Zone: 87,800 – 88,600 – Mid-Range Reaction Level: 90,000 – 90,300 – Major Resistance / Supply Zone: 93,000 – 93,500 – The projected move toward zone (4) aligns with prior range highs and unfilled liquidity. 🌍 Macro Context – Why This Remains a Range, Not a Breakout – Federal Reserve: Policy expectations remain stable with no immediate liquidity expansion signal. This limits impulsive upside in risk assets. – Liquidity Conditions: The recent downside move cleared leveraged longs, enabling a technical rebound, but macro liquidity is not supportive of trend continuation yet. – Risk Sentiment: Broader markets continue to show consolidation behavior, reinforcing mean-reversion rather than directional conviction. Next Move: – A controlled push toward 90,000–90,300 is likely as part of a corrective recovery. – Extension toward the 93,000–93,500 resistance zone is possible, but this area is expected to act as a decision point, not an automatic breakout. – Only acceptance above 93,500 would invalidate the range-based thesis and shift the bias toward trend continuation. Bottom Line: – Bitcoin is following a structured, repeating range pattern, not randomness. – Until macro conditions shift, rallies should be viewed as range extensions into resistance, not confirmed trend reversals.Bitcoin Market Update Bitcoin did not follow yesterday’s projected path, and that deviation is important to understand rather than ignore. The sharp sell-off we saw was not random price action, but a liquidity-driven event amplified by macro conditions and market positioning. Why BTC dropped so aggressively The sell-off was triggered by a combination of factors: - Macro pressure: Renewed uncertainty around the timing of Fed rate cuts pushed U.S. yields and the dollar higher intraday, temporarily weighing on all risk assets, including crypto. - Positioning imbalance: After several failed upside attempts, BTC was heavily long-biased on lower timeframes. This made the market vulnerable to a liquidation cascade once key supports broke. - ETF-related flows: While spot BTC ETFs continue to absorb supply over time, short-term flows do not prevent intraday liquidations. Weak hands were flushed before stronger buyers stepped in. This type of move is typical in crypto a sharp downside expansion to reset leverage, not the start of a sustained bearish trend. Current structure: Reset → Accumulation After the sell-off, price is now stabilizing and compressing near a well-defined support area. Volatility has expanded and is now starting to contract, which usually signals transition from distribution into accumulation. Instead of immediate continuation lower, BTC is showing overlapping candles and reduced momentum — classic signs of range-building. Updated outlook The highest-probability scenario from here is sideways consolidation, not impulsive continuation in either direction. The market needs time to rebuild liquidity and wait for the next macro catalyst. A clean break will require: Either renewed risk-on sentiment driven by softer macro data or easing financial conditions Or clear confirmation that buyers are reclaiming key levels with acceptance, not just wicks Until then, expect choppy price action inside a defined range. Trader guidance This is not an environment for prediction or emotional trading. Overtrading during accumulation phases is how most traders give profits back. Patience is the edge here let the range define itself, wait for confirmation, and allow the market to reveal its next direction. Bitcoin hasn’t broken structurally it has reset. Consolidation comes first. Expansion comes later.
Strong impulse, now hesitation - is gold pausing....
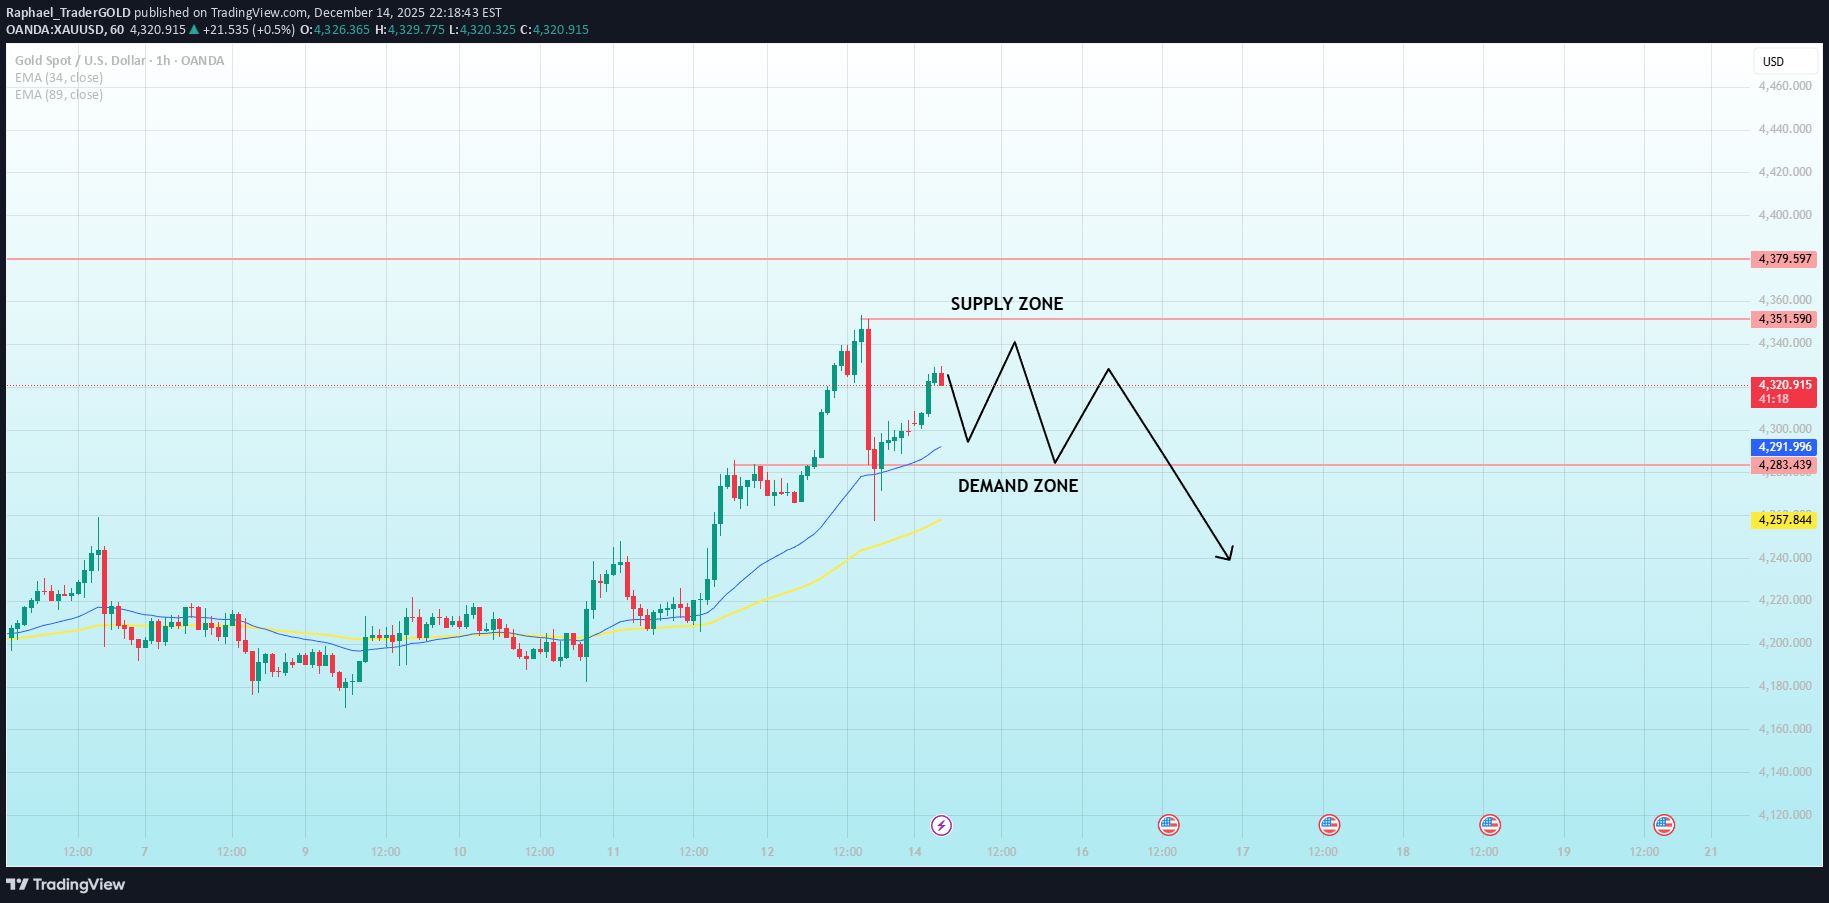
Market context Gold printed a strong impulsive leg from the 4,240–4,260 base, accelerating into the 4,350–4,360 supply area before facing a sharp rejection. Since then, price has transitioned into consolidation, holding above the prior breakout region rather than unwinding the entire move. This behavior suggests short-term balance after expansion, not immediate trend failure. Current structure - Supply zone: ~4,350–4,360, where the impulsive leg was capped - Range mid / current price: ~4,320–4,330 - Demand zone: ~4,280–4,290, aligned with the last breakout and rising EMA support Price remains above the rising EMA 34 (~4,292) and EMA 89 (~4,258), keeping the intraday structure constructive despite the loss of momentum. Candles are overlapping, reflecting indecision and rotational flow rather than directional commitment. Scenarios ➡️ Primary scenario: If buyers continue to defend the 4,280–4,290 demand area, price may remain rotational before attempting another push toward the 4,350–4,360 supply zone. ⚠️ Risk scenario: A sustained break below 4,280, followed by acceptance under the EMA structure, would weaken the bullish bias and expose a deeper pullback toward the 4,240–4,250 liquidity area.The price is still moving according to the predicted scenario - it will move sideways before reaching a new all-time high in the near future. Gold will definitely reach a new all-time high; it's just a matter of time, and the combination of macroeconomic news will accelerate this process.
اتریوم در آستانه پرش یا سقوط؟ سطوح کلیدی حمایت و مقاومت
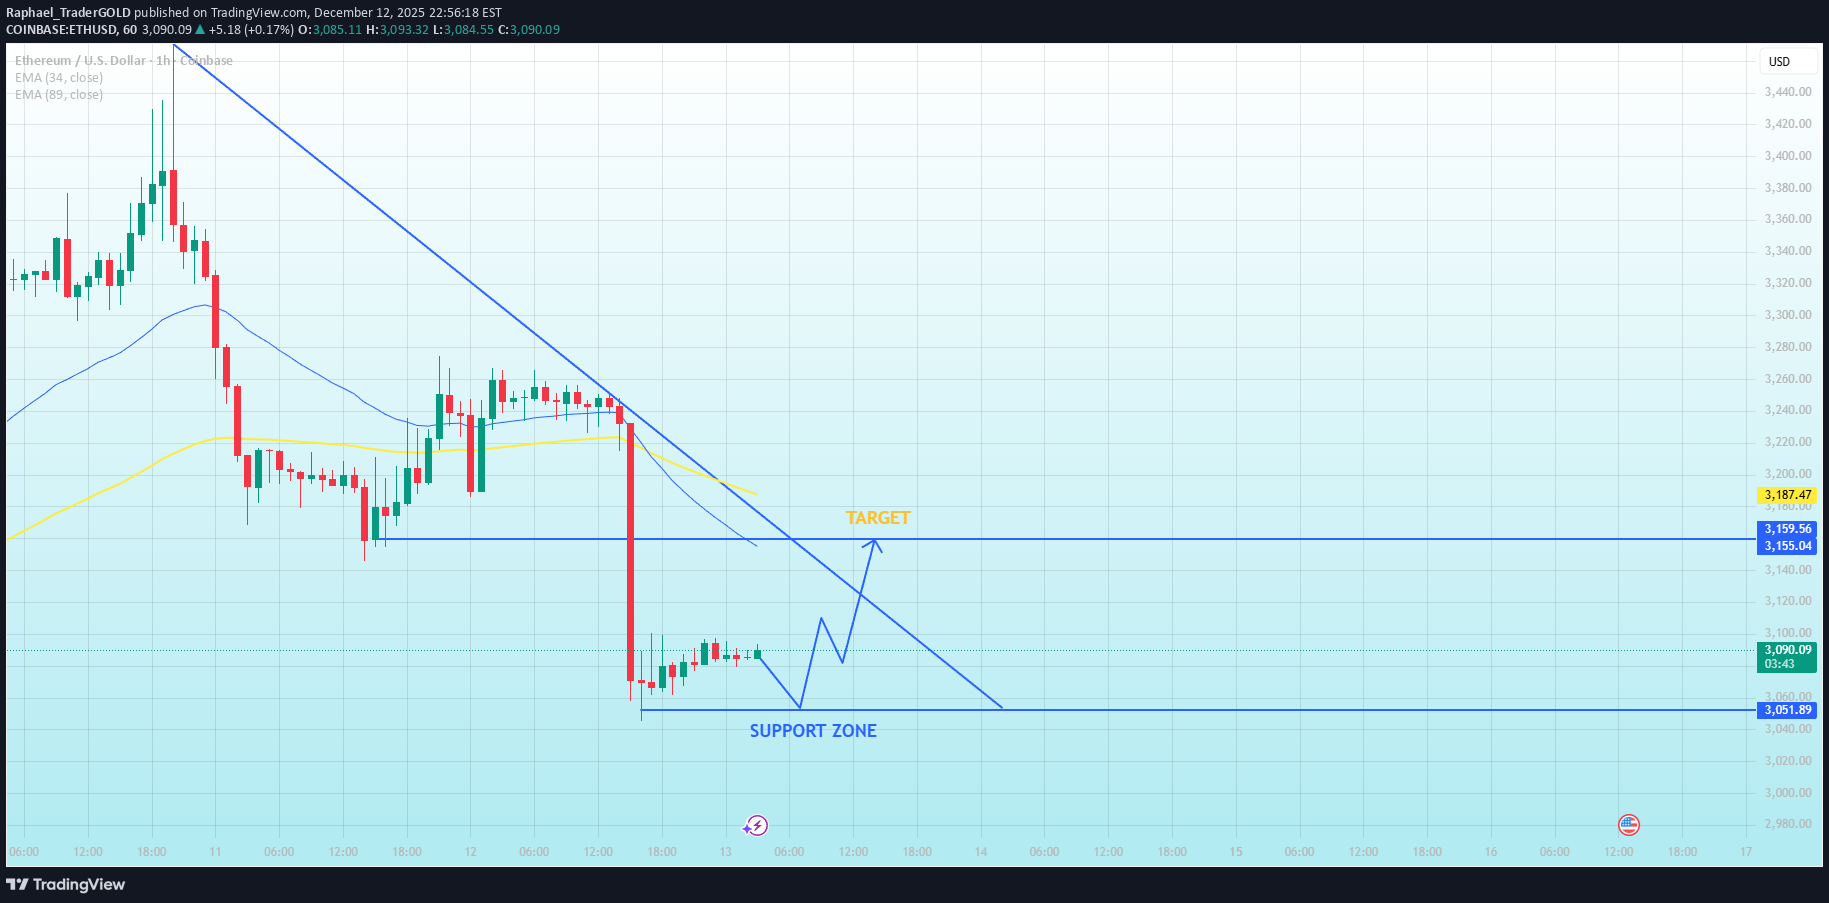
Ethereum (ETH/USD) – 1-Hour Chart Current Market Structure: - Ethereum has recently seen a sharp drop, followed by a consolidation phase. - Price is now positioned near a key support zone, as indicated by the horizontal blue line. - The trendline above suggests a descending resistance that could play a significant role in price action going forward. Key Levels: - Support Zone: $3,051.89 - The price is currently near this level, and it will be critical in determining whether Ethereum will reverse or continue lower. - Target Zone: $3,159.56 - If Ethereum successfully bounces from the support zone, the next target is near this level, marked by the blue arrow. - Resistance Trendline: The price is approaching a downward sloping resistance. A break above this trendline would signify a potential bullish breakout. Probable Scenarios: - Bounce from Support Zone: The current level looks like a potential buy zone, with a bounce toward $3,159.56 as the first target. - Continued Rejection at Resistance: If price fails to break the resistance trendline, expect further downside action toward lower support zones. - Breakdown of Support: If price breaks below the support zone, a move lower toward the next support level is likely, potentially extending the decline. Market Impact: - Short-Term Volatility: There is likely to be volatility due to the support and resistance interaction, so keeping an eye on price action near these levels is crucial. - Upcoming Events: Be aware of external factors like economic announcements that could disrupt price movement. Trading Strategy: Buy at Support: Look for a confirmation of the bounce from the support zone, aiming for the target near $3,159.56. Sell at Resistance: If price fails to break above the resistance trendline, consider shorting with a target near the next support zone. For now, patience is recommended until the price shows clear behavior near these key levels.ETH is holding above the key support zone, confirming buyers are still defending the structure. Price is consolidating after the recent pullback, forming higher lows inside the range a healthy accumulation phase, not weakness. As long as support holds, the bias remains bullish. Expect continued range build → break above 3,159 → expansion toward the 3,260 target.
بیت کوین در مرز ۹۴ هزار دلار: صعود یا سقوط؟ تحلیل لحظهای و سطوح کلیدی خرید و فروش
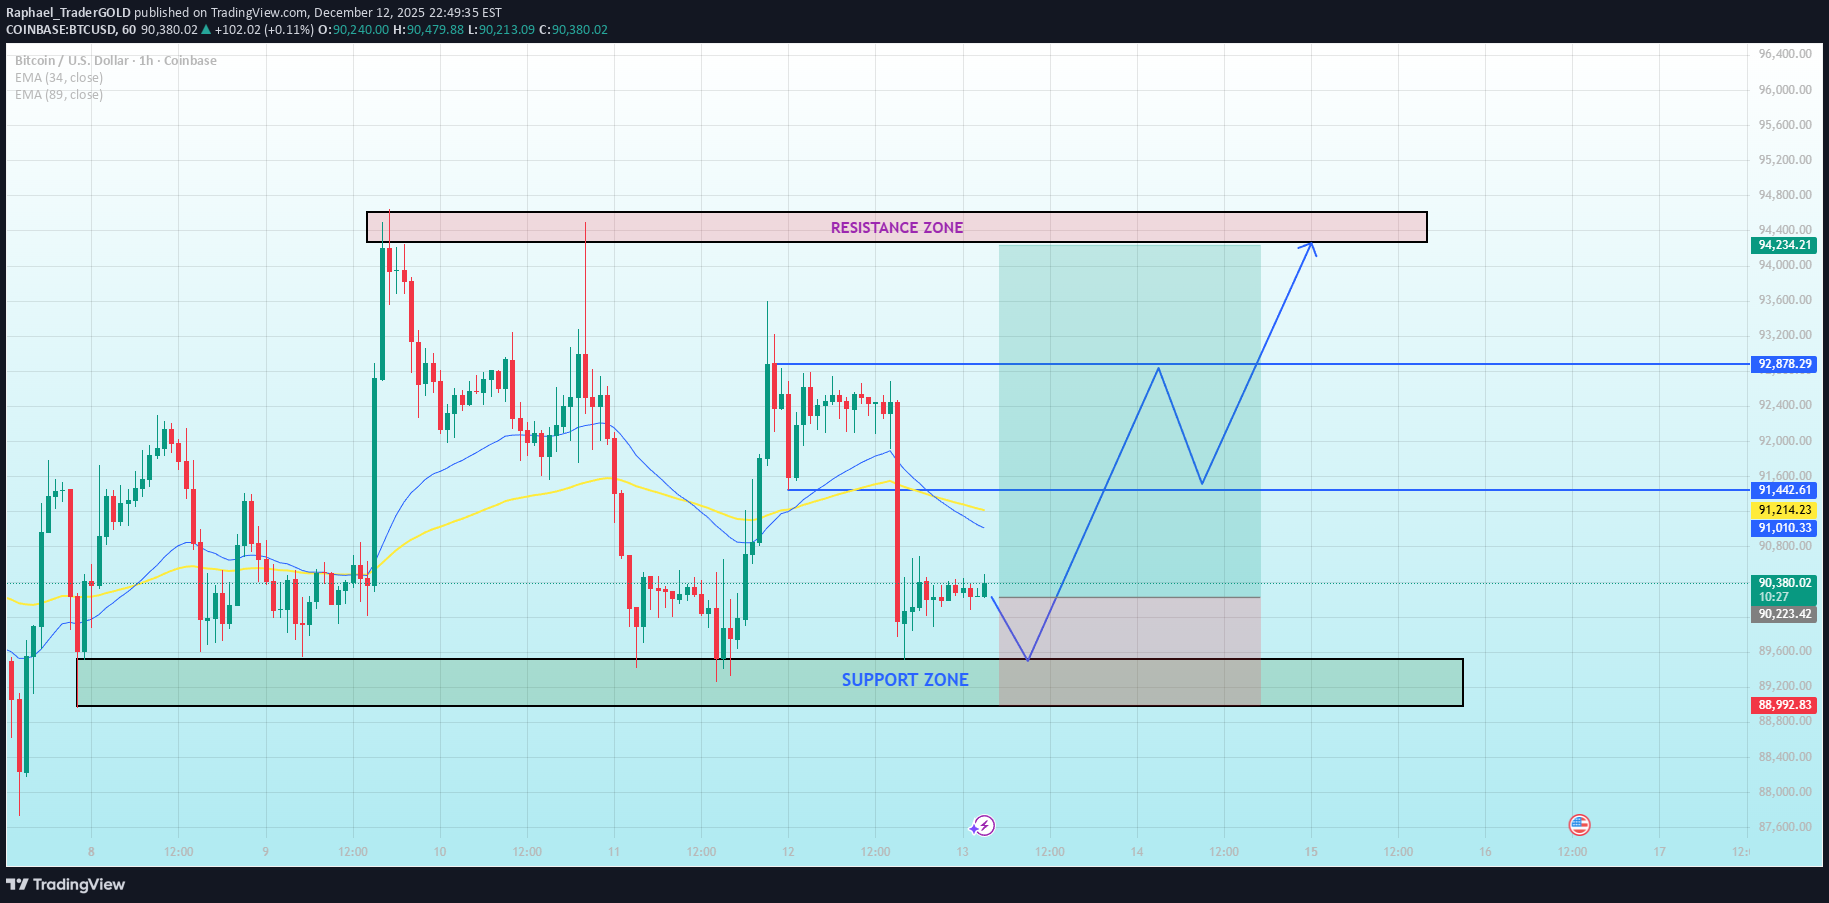
Bitcoin (BTC/USD) Market Analysis – 1H Chart 1. Current Price Structure Bitcoin has been fluctuating within a range, respecting the support zone around $88,992 and the resistance zone around $94,234. Price action shows a period of consolidation after hitting the resistance zone, signaling indecision in the market. The price remains above both the EMA 34 and EMA 89, confirming that the medium-term trend is still bullish, as the moving averages are providing upward support. 2. Liquidity Zones Resistance Zone: $94,234 - $94,800. This region is a critical resistance, and price tends to struggle when it reaches this area, with rejections observed in recent price movements. Support Zone: $88,992 - $89,200. The price is currently respecting this support, with buyers stepping in to push the price upward. A break below this zone may signal a deeper correction. 3. Today’s Market Scenario Main Scenario – Bullish Continuation (60% Probability): If price holds above the support zone ($88,992) and breaks through the resistance zone, Bitcoin is likely to continue its uptrend toward the next targets: Target 1: $92,878 Target 2: $94,800 (near the resistance zone) Extended Target: $96,000 Bearish Scenario – Lower Probability (40%): If the price fails to break the resistance zone, we may see a retest of the support zone at $88,992. A break below $88,992 would open the way for further downside towards $87,600. 4. Market Psychology Bullish Sentiment: The general trend remains optimistic, with institutional investors likely accumulating positions at the support zone. Bearish Pressure: Retail traders may be getting caught in the volatility near the resistance zone, which often leads to false breakouts and liquidity grabs. 5. Intraday Strategy Guidance Buy Opportunity: Look for price rejections near the support zone ($88,992 - $89,200). A clean bounce off this level would be a great entry for a continuation of the uptrend. Sell Opportunity: Consider shorting if Bitcoin fails to break the resistance zone ($94,234) and begins to reverse from this level, especially if there is a strong bearish candle or rejection. Upcoming Key Factors Macroeconomic Factors (Fed Announcements): Any macroeconomic news, particularly announcements from the Federal Reserve regarding interest rates or economic policies, could impact the volatility of Bitcoin. A dovish Fed stance could provide further bullish momentum, while hawkish signals may trigger a correction. Global Events: Be aware of global economic events (e.g., geopolitical tensions, economic reports) that might influence risk sentiment in the market. Conclusion: The market is currently in a consolidation phase, with a strong bullish bias above the support zone. A clear breakout above the resistance zone could open up more upside potential. However, any rejection at the resistance may lead to a retracement. Keep an eye on macroeconomic news, particularly related to the Fed, as it could be a catalyst for either a breakout or breakdown.BTC has swept liquidity and reacted strongly from the support zone, confirming buyers are active. Price is now consolidating above support, building a base after the bounce a re-accumulation phase, not a breakdown. As long as BTC holds this support, the bias remains bullish. Expect range → higher low → expansion toward the 93,600 target.Bitcoin Market Update Bitcoin did not follow yesterday’s projected path, and that deviation is important to understand rather than ignore. The sharp sell-off we saw was not random price action, but a liquidity-driven event amplified by macro conditions and market positioning. Why BTC dropped so aggressively The sell-off was triggered by a combination of factors: - Macro pressure: Renewed uncertainty around the timing of Fed rate cuts pushed U.S. yields and the dollar higher intraday, temporarily weighing on all risk assets, including crypto. - Positioning imbalance: After several failed upside attempts, BTC was heavily long-biased on lower timeframes. This made the market vulnerable to a liquidation cascade once key supports broke. - ETF-related flows: While spot BTC ETFs continue to absorb supply over time, short-term flows do not prevent intraday liquidations. Weak hands were flushed before stronger buyers stepped in. This type of move is typical in crypto a sharp downside expansion to reset leverage, not the start of a sustained bearish trend. Current structure: Reset → Accumulation After the sell-off, price is now stabilizing and compressing near a well-defined support area. Volatility has expanded and is now starting to contract, which usually signals transition from distribution into accumulation. Instead of immediate continuation lower, BTC is showing overlapping candles and reduced momentum — classic signs of range-building. Updated outlook The highest-probability scenario from here is sideways consolidation, not impulsive continuation in either direction. The market needs time to rebuild liquidity and wait for the next macro catalyst. A clean break will require: Either renewed risk-on sentiment driven by softer macro data or easing financial conditions Or clear confirmation that buyers are reclaiming key levels with acceptance, not just wicks Until then, expect choppy price action inside a defined range. Trader guidance This is not an environment for prediction or emotional trading. Overtrading during accumulation phases is how most traders give profits back. Patience is the edge here let the range define itself, wait for confirmation, and allow the market to reveal its next direction. Bitcoin hasn’t broken structurally — it has reset. Consolidation comes first. Expansion comes later.
Disclaimer
Any content and materials included in Sahmeto's website and official communication channels are a compilation of personal opinions and analyses and are not binding. They do not constitute any recommendation for buying, selling, entering or exiting the stock market and cryptocurrency market. Also, all news and analyses included in the website and channels are merely republished information from official and unofficial domestic and foreign sources, and it is obvious that users of the said content are responsible for following up and ensuring the authenticity and accuracy of the materials. Therefore, while disclaiming responsibility, it is declared that the responsibility for any decision-making, action, and potential profit and loss in the capital market and cryptocurrency market lies with the trader.