Technical analysis by Raphael_TraderGOLD about Symbol BTC: Buy recommendation (12/13/2025)

بیت کوین در مرز ۹۴ هزار دلار: صعود یا سقوط؟ تحلیل لحظهای و سطوح کلیدی خرید و فروش
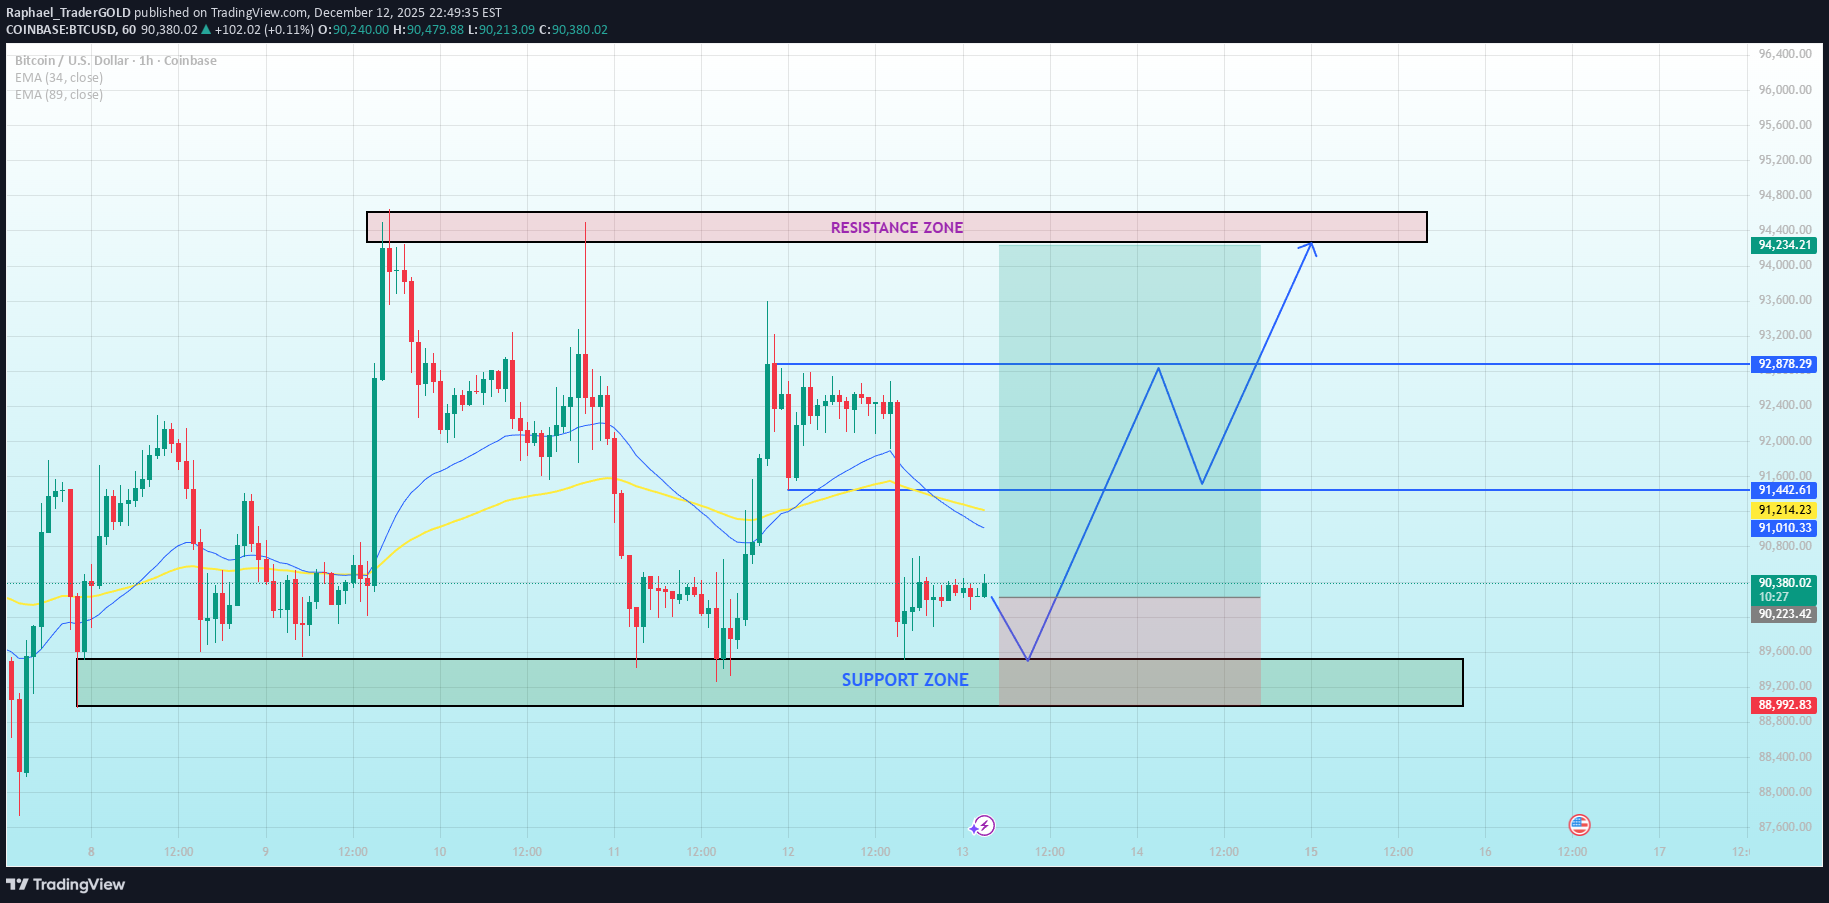
Bitcoin (BTC/USD) Market Analysis – 1H Chart 1. Current Price Structure Bitcoin has been fluctuating within a range, respecting the support zone around $88,992 and the resistance zone around $94,234. Price action shows a period of consolidation after hitting the resistance zone, signaling indecision in the market. The price remains above both the EMA 34 and EMA 89, confirming that the medium-term trend is still bullish, as the moving averages are providing upward support. 2. Liquidity Zones Resistance Zone: $94,234 - $94,800. This region is a critical resistance, and price tends to struggle when it reaches this area, with rejections observed in recent price movements. Support Zone: $88,992 - $89,200. The price is currently respecting this support, with buyers stepping in to push the price upward. A break below this zone may signal a deeper correction. 3. Today’s Market Scenario Main Scenario – Bullish Continuation (60% Probability): If price holds above the support zone ($88,992) and breaks through the resistance zone, Bitcoin is likely to continue its uptrend toward the next targets: Target 1: $92,878 Target 2: $94,800 (near the resistance zone) Extended Target: $96,000 Bearish Scenario – Lower Probability (40%): If the price fails to break the resistance zone, we may see a retest of the support zone at $88,992. A break below $88,992 would open the way for further downside towards $87,600. 4. Market Psychology Bullish Sentiment: The general trend remains optimistic, with institutional investors likely accumulating positions at the support zone. Bearish Pressure: Retail traders may be getting caught in the volatility near the resistance zone, which often leads to false breakouts and liquidity grabs. 5. Intraday Strategy Guidance Buy Opportunity: Look for price rejections near the support zone ($88,992 - $89,200). A clean bounce off this level would be a great entry for a continuation of the uptrend. Sell Opportunity: Consider shorting if Bitcoin fails to break the resistance zone ($94,234) and begins to reverse from this level, especially if there is a strong bearish candle or rejection. Upcoming Key Factors Macroeconomic Factors (Fed Announcements): Any macroeconomic news, particularly announcements from the Federal Reserve regarding interest rates or economic policies, could impact the volatility of Bitcoin. A dovish Fed stance could provide further bullish momentum, while hawkish signals may trigger a correction. Global Events: Be aware of global economic events (e.g., geopolitical tensions, economic reports) that might influence risk sentiment in the market. Conclusion: The market is currently in a consolidation phase, with a strong bullish bias above the support zone. A clear breakout above the resistance zone could open up more upside potential. However, any rejection at the resistance may lead to a retracement. Keep an eye on macroeconomic news, particularly related to the Fed, as it could be a catalyst for either a breakout or breakdown.BTC has swept liquidity and reacted strongly from the support zone, confirming buyers are active. Price is now consolidating above support, building a base after the bounce a re-accumulation phase, not a breakdown. As long as BTC holds this support, the bias remains bullish. Expect range → higher low → expansion toward the 93,600 target.Bitcoin Market Update Bitcoin did not follow yesterday’s projected path, and that deviation is important to understand rather than ignore. The sharp sell-off we saw was not random price action, but a liquidity-driven event amplified by macro conditions and market positioning. Why BTC dropped so aggressively The sell-off was triggered by a combination of factors: - Macro pressure: Renewed uncertainty around the timing of Fed rate cuts pushed U.S. yields and the dollar higher intraday, temporarily weighing on all risk assets, including crypto. - Positioning imbalance: After several failed upside attempts, BTC was heavily long-biased on lower timeframes. This made the market vulnerable to a liquidation cascade once key supports broke. - ETF-related flows: While spot BTC ETFs continue to absorb supply over time, short-term flows do not prevent intraday liquidations. Weak hands were flushed before stronger buyers stepped in. This type of move is typical in crypto a sharp downside expansion to reset leverage, not the start of a sustained bearish trend. Current structure: Reset → Accumulation After the sell-off, price is now stabilizing and compressing near a well-defined support area. Volatility has expanded and is now starting to contract, which usually signals transition from distribution into accumulation. Instead of immediate continuation lower, BTC is showing overlapping candles and reduced momentum — classic signs of range-building. Updated outlook The highest-probability scenario from here is sideways consolidation, not impulsive continuation in either direction. The market needs time to rebuild liquidity and wait for the next macro catalyst. A clean break will require: Either renewed risk-on sentiment driven by softer macro data or easing financial conditions Or clear confirmation that buyers are reclaiming key levels with acceptance, not just wicks Until then, expect choppy price action inside a defined range. Trader guidance This is not an environment for prediction or emotional trading. Overtrading during accumulation phases is how most traders give profits back. Patience is the edge here let the range define itself, wait for confirmation, and allow the market to reveal its next direction. Bitcoin hasn’t broken structurally — it has reset. Consolidation comes first. Expansion comes later.