
QJEEE
@t_QJEEE

What symbols does the trader recommend buying?
Purchase History
پیام های تریدر
Filter
Signal Type
QJEEE
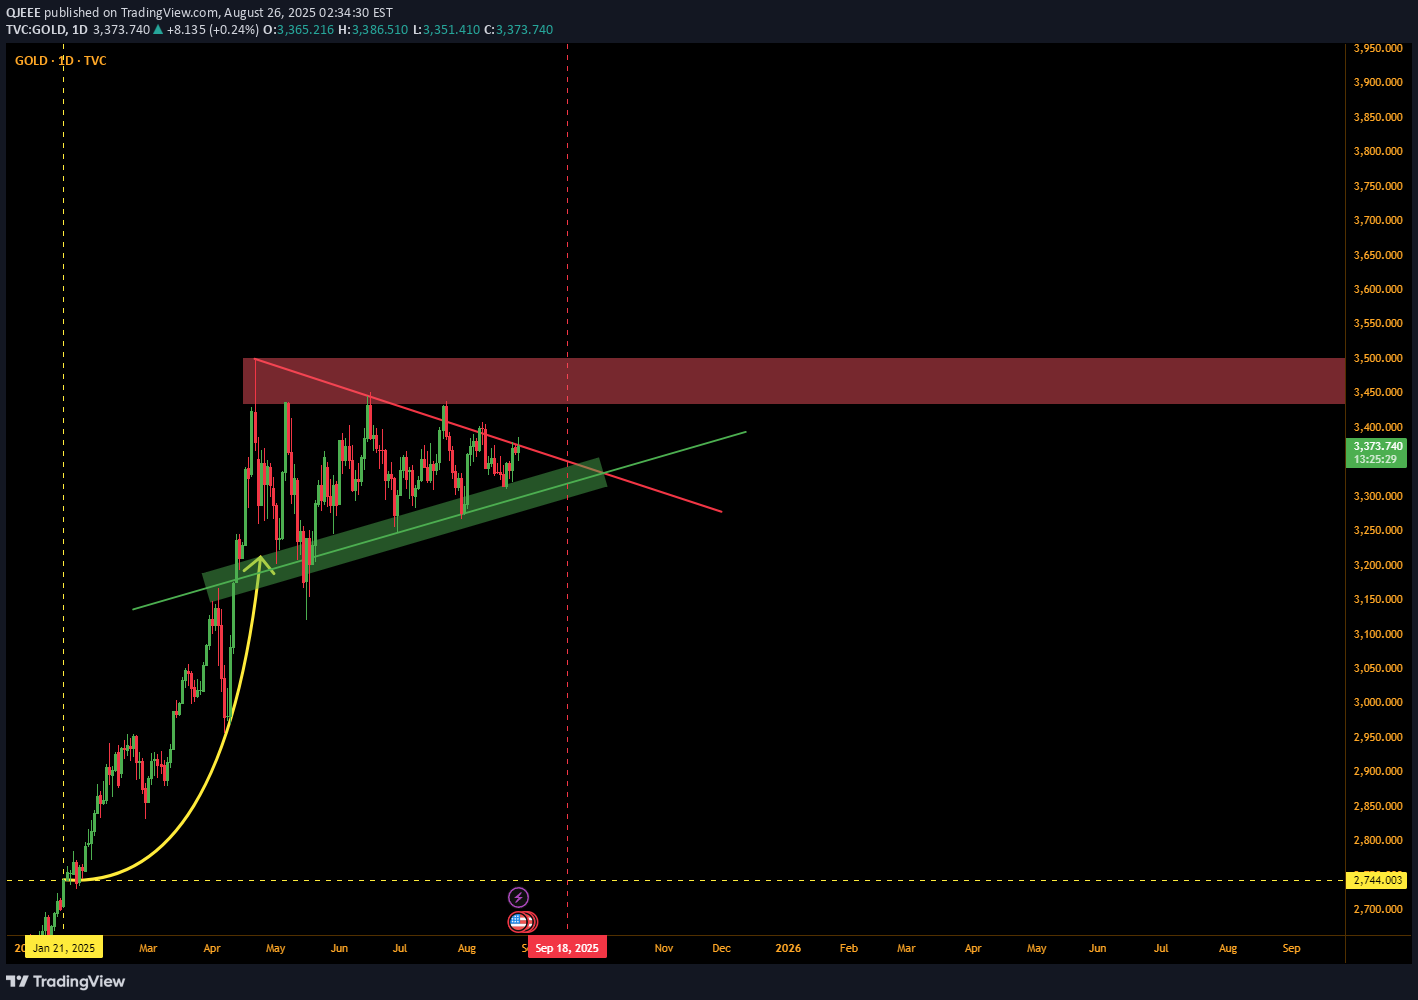
There is a complicated relationship between GOLD and the US government (and especially the Federal Reserve). The history goes back to 2010, right after Great Recession. After experiencing a severe financial crisis with very low inflation rate and high unemployment, the Fed significantly increased the dollar supply after 2010. Central banks, who were initially the major net sellers of GOLD , then became the major net buyer. Why? Because they were concerned of major inflation due to the Fed's aggressive printing. They began to diversify their reserves away from US dollar, which we call 'De-dollarization". Growing world tensions since late 2010s further convinced the central banks to lower their reliance on US dollar. So here we are, watching GOLD price skyrocketing since 2010. When would be a good time to buy, then? Frankly anytime (in long term), but if you are looking for a short term opportunity, now might be the time. GOLD price has been rising rapidly since Trump's inauguration mostly due to the uncertainties caused by the trade war and tariffs. GOLD is often a 'safe haven' in these turbulent times. But it has calmed down a bit after April, possibly due to the trade negotiations. Technical analysis-wise, the price is staying within the wedge. And it is likely to break out in either direction before October. The upcoming Interest rate decision is September 18th. And it is very likely that the Fed will cut rates. Trump administration has been pressuring the Fed to cut rates. The administration's stance is that the Fed has been too restrictive about rates, hindering economical growth. But the Fed has stayed understandably reluctant due to inflationary concerns and uncertainties from new tariffs. But recent economical data, continuous political pressure and comments from Powell himself suggest that the central bank is now more open to cutting rates. This chart shows how the interest rate plays a role in GOLD price. We see an aggressive rate hikes from February to November, 2022 in order to slow down the inflation during COVID pandemic. Despite the Russian invasion of Ukraine on February 28th, the price has been pressured down from the rate hikes. It was only when the inflation rate signaled downtrend, the Fed slowed down the hike, allowing GOLD price to recover. The interest rate has been on hold since last December, but we might see a cut this September. Rate cut would weaken US dollar, pushing GOLD up again. So if you are thinking to buy GOLD , make it before September 18th, and buy it within the wedge - below the resistance line.We already see GOLD breaking through the wedge, let's watch if the price falls back into the wedge, or continue its trend.
QJEEE

Hello, fellow traders!This is my analysis on the crypto market. I will mostly be using the Bitcoin chart on the analysis as Bitcoin’s movements pretty much represents the whole market.This is the daily chart of Bitcoin. There are three distinctive trend channels – green, orange, and white. Green trend channel was the older uptrend channel that persisted from last August to November when Trump was elected as a next POTUS, causing the price to break through the channel. We then see a newer uptrend channel, orange, that rallied Bitcoin above the 100k. This channel, however, has been broken below on Dec 22nd. A lot has happened in December. The Fed has officially said, “Fewer rate cuts in 2025.” – causing negative sentiments throughout the markets. It is also common for people to globally withdraw their assets to spend money during late December and early January for Christmas and New Year spendings. However, from a technical analysis perspective, it is true that Bitcoin has lost its initial momentum since then. We see two attempts to reenter the channel, only to be pushed back the next day. This shows that the support line of the channel has now become the strong resistance line, with the selling pressure outweighing the bullish momentum. This is where the third trend channel, white, takes place. The resistance of this channel is drawn by two peaks, on Dec 17th and Jan 7th, while the support line is drawn from yesterday’s low. Looking at the hourly chart, we see that this trend channel is very accurate as price consistently reacts to its medial line (white dotted line) dating back to Dec 18th. This channel is the most recent one and given that it is being respected by the price movements, we can confidentally use it for future analysis. But this is only the technical part of the analysis. There are a lot more to consider when we analyze the price movements.As I have marked on the chart above, the US Bureau of Labor Statistics is releasing the CPI data for December – more specifically, Core Inflation Rate YoY and Inflation Rate YoY. This data is very important as the alignment between the actual report and the forecast significantly impacts market movement. The current forecast for Core Inflation Rate YoY is 3.3% - unchanged from the prior. Forecast for Inflation Rate YoY is 2.8% - 0.1% above the prior. If the forecast proves to be accurate, as it usually does, this will remove uncertainty – which would encourage the markets to move upwards. The markes thrive on stability and are heavily influnced by psychology – for instance, the markets suffered from steep decline last month when Fed Chair Powell said that the Fed sees fewer cuts this year. Psychology is a big aspect of the market movements – and with the actual report aligning with the forecast, the market reaffirms that there’s nothing new, encouraging postive sentiment. Donald Trump is also entering his office this 20th – a man who has made pro-crypto claims during his election campaign. He has also said that he will set act on crypto on his first day at the office. The positive sentiment is most likely to be continued to the 20th.This isn’t the whole story, though. The Core Inflation rate is still above the Fed’s 2% target despite the high interest rate policy being effective enough to discourage inflation for last few months – this could mean that the Fed may decide to hold the rate cut this month which aligns with their statement last month. The next Interest rate decision will be made on 29th, end of the month. If the rate is maintained, this could then negatively impact the market. Also, the Chinese New Year is from Jan 29th to Feb 12th and people tend to withdraw their assets and spend their time with their families and friends during the holidays which could temporarily discourage the market – but the effect is most likely to be minimal since the Chinese government prohibits the crypto activities (which makes Chinese participants to use p2p rather than withdrawal) and such holidays are only valid in the portion of the global world (East Asia). The yellow support line has been proven to be effective as we see in the hourly chart, and we can expect some bullish sentiment for now. (For context, the red trendline you see in my charts is a major resistance line drawn by two high points in 2021. The line has been acting as a support line ever since it has been broken through after the recent election. Check below.)Lastly, looking at the Bitcoin Dominace chart, we see that the Dominance has now touched the resistance line – if the line is to be respected like the last two times, we will see Dominance decreasing once again, with altcoins being the options for many investors. This combined information suggests that now might be a good opportunity for long positions, but only in the short term. As I mentioned, the market could face a downtrend in the end of the month. What you choose to do with this information is totally up to you – but personally, I’m considering investing in altcoins I’ve recently observed that are close to their heavy support zone – short term. I hope this analysis helps you understand the current market. Thank you!React, don't predict! Stay disciplined and patient. Don't get greedy and be thankful.God bless :)2 Chronicles 7-12(Solomon admits that God has made him the king of Israel and asks for His wisdom instead of anything else and God was deeply pleased by his humble attitude and request, granting him everything else as well. Same can apply in our life of investing.)Bitcoin is currently facing pressure as the price touches the demand zone.Inflation Rate YoY Forecast has gone up from 2.8% to 2.9%. I will update on how this might affect the analysis.(Late) update: I was watching the market as the Bureau of Labor Statistics released the CPI data on 15th, the outcome was favorable towards the market. Core Inflation Rate YoY came out marginally lower than the forecast and the Inflation Rate YoY, inline. This was a good news for the market because it showed that the Inflation is under control - no shock. The candle was already moving pretty volatilely before the actual release as if it already half-knew the answer. Watching it gave me an impression of a hunting dog waiting for its owner to say, 'Go'. For the few hours before the release, the hourly candles have been testing the Demand Zone (as you see the chart above) - this reflects the market psychology that majority of the people were expecting the CPI report to be favorable. And with it, the crypto broke through the resistance line and entered the demand zone. The price then continued the climb and touched the resistance line of the downtrend channel (white line) but started consolidating instead of retreating back instantly - very similar to the previous occasion under the demand zone. No immediate retreat upon touching the resistance line/zone shows that the bullish momentum is persistent. However, unlike the last time, we yet lack the proper cause or justification to break through it. I've drew a major line of 98550 and 97688 based on the previous candles and also a Fair Value Gap (FVG) where the price might fall back to retest. And this is what the current chart loos like: the price did indeed fall back to the FVG but managed to pull back up. The price then touched the white resistance line for the second time. Looking at the daily chart, we spot the difference between the current peak and last two peaks. Last two touches resulted in the immediate pullback the next day whereas the third one is showing us the red hammer. Red hammer in an uptrend typically signals the reversal but in this case, it's a little different. If the price continues its consolidation ( = refusal to decline) near the resistance line as well as the major demand level of 100k, it could wait for Trump's inauguration next Monday and seek for another justification. The articles are also very positive on Bitcoin: many institutes have been known to accumulate Bitcoin over the weeks, and even now we hear about the news of how the Swiss bank is considering Ethereum staking for passive income and Coinbase launching loan services based on Bitcoin. All of these, even if not accurate, are enough to tell us that the hype around 'cryptocurrencies (especially Bitcoin) being proposed as a new card central banks and governments can pull' still continues. Bitcoin successfully passing the FVG test and retouching the resistance line is a big signal. I'll keep the post updated! God bless! 2 Chronicles 9:8 (Queen of Sheba praising God's name for Solomon's throne, wisdom and wealth - I also praise and thank God for giving me His wisdom in my daily trading life, allowing me new opportunities everyday, keeping me safe in this volatile market.)Live update: Bitcoin and the crypto market showing strong momentum as the President-elect Trump is expected to sign an order of setting crypto 'national priority'. The order could be signed as soon as the 20th - but if not, the market may suffer from minor setback.There's a very heavy resistance between 102,000 to 102,700.New (cyan) uptrend channel has been added.The current hourly candle is just above the median line.
QJEEE

Hello, fellow traders!This is my analysis on Zcash (ZECUSDT). 1️⃣ AnalysisBefore diving into Zcash’s chart, I first want to address the current market sentiment. Bitcoin’s price remains within the demand zone of 97k – 100k, currently testing the support line of the uptrend channel (yellow channel). Bitcoin’s movements in the next few days will be critical as Bitcoin breaking below this channel could trigger fear throughout the market. If it manages to stay within the channel, however, bull rally may continue. The candle is currently bullish, which is ideal, but with 15 hours remaining until the close, things can always change. (I am using UTC-5 as my chart timezone.)Ethereum’s candle is also bullish, and the price remains within the uptrend channel, which is ideal.Dogecoin’s movements are also crucial, as it is leading the rally. However, it’s not looking too good for Dogecoin right now as its price broke below the channel yesterday. It would have been much more ideal if the price stayed within the channel like Bitcoin or Etherum but unfortunately that didn’t happen. That said, there’s still a chance for improvements. The price is still within the Price Action Zone (PAZ) and despite the current candle being bearish, the long lower wick suggests that most of today’s decline has been recovered. As I write, the candle is forming a semi-doji star, with the price only just few ticks below the open price. If the price manages to reenter the uptrend channel, it could signal a strong possibility of the rally continuing. Lastly, here’s a BTC Dominance chart. We’ve seen a lot of volatile movements for yesterday, but the candle eventually closed as a perfect doji star. (Open and close were same at 56.94%) While seeing a perfect doji star is notable, Dominance has only been increasing today (Open and low are same at 56.93%). This reflects the psychology behind the curret market of people preferring Bitcoin over altcoins as the market faces growing uncertainties, which could also explain Bitcoin’s performance today. But we still have around 15 hours left until the candle closes and shift of momentum – similar to yesterday – remains possible. Ideally, we’d like to see the Domiance to drop as we are seeking to invest in altcoins. With this context, let’s now dive into the Zcash’s chart. Zcash has also suffered from the recent correciton, with its price dropping 21%. However, we see a bullish hammer candle for yesterday (or a close doji-star as I want to call it 😅). The long lower wick also suggests that the buyers were able to absorb the selling pressure. Today, the chart is currently showing another green hammer, but the candle has been fluctuating between red and green so we will have to wait and see how it closes. The candle from the day before yesterday touched the 49.44 level (which was previously a major resistance level) before retracting. Additionally, yesterday’s candle’s low also came close to the resistance line of the uptrend channel. Both are positive signs suggesting a potential rebound. 2️⃣ ExpectationsWith 15 hours remaining until the candle closes, a bullish close could present a possible entry for long. (As I write, Dogecoin’s candle has just turned to green. However, this could be temporary, and we cannot be sure until the candle closes.)3️⃣ Key approachOur first strategy is to enter long after 3 consecutive bullish candles. With yesterday’s candle already bullish, we now aim for the current candle and tomorrow’s candle to close as bullish as well. If the circumstances are promising, we may consider entering before tomorrow’s candle closes.We also must be mindful of the Price Action Zone as turbulence might occur – and in the worst cases, even a bearish rebound. It is always best to respect such zones, but the current market sentiments also tend to bypass major demand levels & zones. 4️⃣ Other approachNo other strategy for this one :)5️⃣ ConsiderationsZcash has a market cap of 956 million USD, which is very close to 1 billion. This crypto is definitely much safer than some of the other cryptos I’ve posted about which is positive. I emphasize this in every post, but I can’t emphasize it enough – Zcash as well as any other cryptos will be heavily influenced by the movements of the giants. Keep watching these giants’ movements as well as the BTC Dominance chart to confirm market sentiment and stay cautious. Thanks!React, don't predict! Stay disciplined and patient. Don't get greedy and be thankful.God bless :)James 1:5-8Hello, traders! Unfortunately, we did not see that 3 consecutive bullish candles. I will be back with new opportunities! :)
QJEEE

Hello, fellow traders!This is my analysis on Ark (ARKUSD). 1️⃣ AnalysisBefore looking into Ark’s chart, I want to address the current market sentiment first. Bitcoin, Ethereum, Dogecoin and many other cryptocurrencies hav experienced significant pullbacks, with BTC Dominance rising from 55% to nearly 57% yesterday – reflecting fear throughout the market. (My chart timezone is UTC-5.) Whether this is temporary remains uncertain. With that context, let’s now look at the Ark’s chart. This is a daily chart for Ark. Ark’s price remains inside the channel, which is a positive sign since trading within a trend is safer than trading outside of it.The current price is slightly below the Price Action Zone (PAZ). Yesterday’s candle closed inside the zone, and this is important as it suggests a possible rebound. If the candle has broken though the zone entirely (as it did on June 18th), the likelihood of a rebound would be lower. The current candle still has the potential to turn green (indicating a bullish reversal), as Bitcoin has also turned green, forming a doji star as I write. Additionally, BTC Dominance has turned red after forming a long upper wick, hinting at the possibility of a continued rally. Check the charts below. 2️⃣ ExpectationsArk, like any other altcoin, will be heavily impacted by the overall market sentiment. With 15 hours remaining until the current daily candle closes (as of now), there is still a chance that the current downtrend could halt or even reverse. If the current candle closes within the PAZ or better yet, turns green like Bitcoin has, it could signal the potential for further recovery after the correction. But even then, we want to keep our eyes on BTC Dominance to keep track of market sentiment. We always want to respect and trade along with the overall trend.Dogecoin is also worth watching since it’s leading the current altcoin rally. Earlier today, its price dipped below the uptrend channel but has since rebounded back within it. If it remains so until the candle closes, this could indicate that the rally will continue longer. (Or at least it’s refusing to stop now.)Now, the best scenario would be price rebounding at the Area of Confluence (red box in the chart above, AoC in short) where the uptrend channel’s support line meets the 0.53963 level. However, the current market sentiment might not allow this to happen. 3️⃣ Key approachOur first strategy is to enter long after confirming a rebound within the PAZ. This is highly plausible since many symptoms indicate that the rally could regain momentum after the correction. As mentioned earlier, Bitcoin’s candle has turned green, reentering the major demand zone. Dogecoin is currently forming a doji star and BTC Dominance candle has also turned red with significant volume – signaling a potential market recovery. If the market overcomes this correction, it is very likely that Ark will also follow the market sentiment and resume its uptrend. That said, the safest entry would be to wait for a confirmed rebound at the AoC, but the current symptoms suggest that the market might not wait for Ark to reach the AoC before reversing its trend – making a more proactive approach worth considering. 4️⃣ Other approachNow of course, because we still have a long time until the candle closes, the opposite scenario is entirely possible. BTC Dominance might turn green again - the correction might continue even with bigger momentum. In this case, Ark could close below the PAZ and potentially face further declines. If this happens, I will post a separate idea regarding a new approach. 5️⃣ ConsiderationsArk, as I mentioned in the previous post on it, has faced allegations of being subject to pump-and-dump schemes. Additionally, with a market cap of only 111 million USD and a ranking of 410, Ark is highly volatile - given these factors, investing in Ark for the long term could carry some risks. React, don't predict! Stay disciplined and patient. Don't get greedy and be thankful.God bless :)Hebrews 11:6
QJEEE

Hello, fellow traders!This is my analysis on Artificial Superintelligence Alliance, formerly known as Fetch.ai (FETUSDT). I will call FET in short.In my previous post on FET, I’ve marked that price breaking through the resistance line could signal a possible uptrend in future. 1️⃣ AnalysisIn the daily chart, we see FET in a continuous downtrend after peaking on March 28th.The red resistance line is drawn based on September 24th’s high and October 15th’s high. However, when extended to the left, we see the line very close to ATH, increasing its relevance. For the last 8 months, the price didn’t even come near the resistance line but has been constantly touching it for last 2 months. And on November 5th (election day), we see the breakout. So this is where we enter long, right? Not quite. When we draw another (purple) resistance line based on ATH and May 22th’s high, we see price reacting to the line as it approaches it on August 25th. It eventually broke through the line on September 10th (which was a day for a debate between Trump and Harris, though I find little to no connection between those two. BTC and many other cryptos did not have notable reaction.) The breakout led to some uptrend until the end of September, when the price started to decline again. It was only after the election when the price rebounded. 2️⃣ ExpectationsI feel positive about FET’s future but we might see a pullback before the uptrend. Looking at the daily chart of Tron, we see price breaking through the resistance line on July 27th, but the uptrend begins only after the price (almost) retests the former resistance line, which has turned into support following the breakout. While Tron may not represent FET’s exact future, it gives us an idea of how the price might move in near future. Tron is one of the biggest cryptos in the market with market cap of 14 billion dollars. FET being smaller with 3.9 billion, it’s still one of the leading cryptos. Its current rank is 28th, category being layer 1 and AI. Difference between Tron and FET is that while Tron’s breakout showed a lot of hesitation, FET’s breakout was more decisive and was fueled by the election results. And with the current bull rally of the market, odds of FET reaching its ATH look positive. The price may continue to move upwards, or it may reach AoC (Area of Confluence) marked as a red box first before continuing the uptrend. AoC is where the price action zone and the support line (formerly a resistance) meet.If we confirm a reversal at the AoC, we may enter long.3️⃣ Key approachOur first strategy is to enter long after confirming reversal at the AoC. The price, however, may not reach the AoC at all and continue to rise. This is possible due to the current market sentiments. We currently see price being retested as it touches the white trendline. If we see the price successfully passing the yellow AoC box, we may be more confident in an uptrend.4️⃣ Other approachI don’t have different approach for this analysis.5️⃣ ConsiderationsWhile future of FET looking promising (for now), it is wiser to stay cautious. The breakout on November 5th and the current market sentiments both suggest promising future for this crypto. However, we always want to enter AFTER the confirmation. Best scenario would be price being retested at the red AoC box before continuing the uptrend. I also want to note that while Tron’s chart may help us in analyzing FET, we cannot assume FET will exactly follow Tron’s movements. React, don't predict! Stay disciplined and patient. Don't get greedy and be thankful.God bless :)Matthew 6 33-34
QJEEE

Hello, traders!This is my analysis on Monero (XMRUSDT).Monero is a crypto that was first lunched in 2014 with the price of 163 and market cap of over 3B US dollars, I think it is a reliable crypto to trade on. Also the community is very active.1️⃣ AnalysisThe price has shown steady wing movements for last 5 months. Of course, this does not mean the swing would continue forever. However, with the right strategy and proper acknowledgement of the risks, I think we have some opportunities here. The price is currently inside the trend moving upwards toward the resistance line. 2️⃣ ExpectationsIf the price is to keep its momentum and reach the resistance line (green line), we might see a reversal and starting downtrend. HOWEVER, we always want to enter after the confirmation. The resistance line will not hold forever. If we see any kind of sings of breakout near the line such as consolidation and volume spike, we will have to be careful. 3️⃣ Key approachOur first strategy is to enter short if we see the price touching the line and show reversal. However, we want to make sure the reversal happens even if that means lower profit. If we confirm the reversal, we may enter with final target price being 135.27.4️⃣ Other approachThere's no other approach for this analysis. Some might think we could enter long now and take profit at the resistance line, but I disagree. Granted, the current movements look promising but we never know what happen. Trading on assumptions is very dangerous. 5️⃣ ConsiderationsThere are few things I want to point about. First, swing period for Monero is long. You might have to wait few months for the price to reach the target. Second, there's always a possibility of breakout. We are not to assume that the trend will continue. Look at the orange box in the chart. The price touched the line, dropped, touched again, dropped again, created a doji star, rose, then started a downtrend. This is very confusing pattern. We want to make sure we confirm the reversal! Third, price might decline again before touching the line. This is why we do not want to enter now. 💡 There is one other thing I want to mention in this post. Breakout trading is one of the most profitable strategy there is. It can earn you a lot of money in short period of time if you are right. However, it's very, very stressful and requires strong mentality. Profit is high but so are the risks because there are so many variables to consider. Breakout also requires proper reason: unless there's a totally justifiable reason to change the trend that has been continued for months (like this election for example), I think it's too dangerous to trade on breakouts. So I narrowed down my strategies - I am looking for (relatively) safe and reliable swing trades where price is moving inside the trend. This gives us less opportunities and requires a lot more patience, but is safer and will grant you big profit in long term. Monero is one good example. The crypto itself is trustworthy, the price is within the trend, both the resistance & support line are reliable. And we will only enter after confirming the reversal. I hope this analysis gave you some idea of deciding your own strategy and I hope you make some profit from Monero.React, don't predict! Stay disciplined and patient. Don't get greedy and be thankful.Luke 1:78-79
QJEEE

Hello, fellow traders! This is my analysis on Zcash (ZECUSDT).1️⃣ AnalysisWe see the price slightly above the resistance line of the weekly regression channel. With the strong bullish movements of crypto and stock markets fueled by the outcome of the election, it has shown an aggressive uptrend yesterday. 2️⃣ ExpectationsWe might see a consolidation (orange path) very soon and we can imagine two different scenarios after it - even more aggressive uptrend or downtrend.3️⃣ Key approachOur first strategy would be entering short. If we confirm a lower breakout after the consolidation, we will view that as price respecting the current trend. We will then enter short, 30.84 being our final target. We then might see another consolidation between the regression line (dotted red line) and the support line (green line).4️⃣ Other approachOur second strategy would be entering long. If we confirm a upper breakout instead, we might consider a possibility of stronger, more aggressive uptrend. However, keep in mind there's a major resistance at 49.44, making this approach more unlikely. 5️⃣ ConsiderationsThere are currently no news about Zcash that might affect the price movements. The interest rate announcement this Thursday might affect the crypto market positively. However, with major resistance being right above the resistance line, price is most likely to respect the current trend. If not, I will update the post accordingly. React, don't predict! Stay disciplined and patient. Don't get greedy and be thankful.Ephesians 5:8-10(You might have noticed that I changed my chart settings - am trying to stay organized and consistent with my posts from now haha)Zcash is showing a lot of struggles which is a good sign, but we will have to see where the consolidation is heading eventually.Zcash now entering below the resistance line after struggling for 4 days in a row. This could be a good sign but with crypto market in its bull rally, be extra cautious!I apologize for the delay. We now see a confirmed downtrend, entering at 42 would've been the best.
QJEEE

Hello, fellow traders!I never thought I'd post about BICO again but here it is.For the last 5 days, BICO attempted the breakout three times. Last two times failed, price being unable to sustain above the resistance line. Two consecutive failures mean that the seller pressure is still strong, but I decided to keep watching since the third breakout might happen with the election today. And there you finally have it! BICO on its THIRD attempt. BICO is now above 0.25 and with this exceptional volume spike and the promising outcome of the election, it might start rallying very soon. However, don't get too excited- we still have some steps left to confirm the uptrend. We want one of these two scenarios to happen:1. Rebound near the resistance line (red line)2. Rebound at the demand zone (red box)If we see both, that's even better.Then we will feel confident enough to enter.BICO is looking strong right now.Next possible entryI've adjusted the resistance zone based on the price movements. The price is showing rebounds and the trend is still strong - we might see a strong breakout of 0.2670 in near future with the right cause. However, always keep in mind the opposite. We should remember that BICO has a strong seller pressure. Though the third breakout was enough to withstand the initial pressure, there are still chances that it might be pushed back eventually. If the price is able to breakout at 0.2670 again, then we might expect a strong uptrend. The price is currently consolidating, let us see what happens. NEVER predict. Always enter after confirmation.
QJEEE

Hello, traders!With election leaning heavily towards Trump, BTC on its new ATH, and possible rate cut this Thursday, we see crypto market on a bull run.In FETUSDT chart, we also FET breaking through the resistance line of the 7 months downtrend.FET(Fetch.AI now known as Artificial Superintelligence Alliance) has been in a constant downtrend since March with ATH being 3.4917USDT on 28th. We see the price respecting this months old resistance line except it decided not to today. This is due to a big excitement around the estimated election results. I was waiting for the breakout but it came earlier than I expected. If we confirm the breakout, we might see a new trend for FET, just like DOGE last month:
QJEEE

Hello, fellow traders!KASPA is nearing to its support zone based on its ATL and swing movements.If we can confirm the reversal here with the favorable outcome of the election, we might see a swing opportunity to 0.19 or even beyond.We will also make sure to confirm the reversal first: if the price drops additionally before making its turn, this is not out of ordinary. My approach mostly contains technical analysis, drawing lines and boxes in the chart. However, I also find understanding the background of the crypto (or any market product in this matter) equally important if not more. So I've done some research about Kaspa, and I've noticed a lot of comments in social media regarding its political stance, security budget issue and such. Here are my thoughts: I do not think these concerns should be overlooked, but I also appreciate the active responses and enthusiasm from the developers, and I think catching people's attention is already a positive part about this crypto. Among all the cryptos I've traded (besides BTC, ETH, SOL), I think this crypto has some potential even when looked outside of the chart.Back to the charts, we already see the price has risen by 10% after it touched the zone.I've entered Kaspa. I think KASPA is worth investing even with the fundamental analysis. The current market looks promising with Trump in the lead, I think now might be a good time to enter LONG for Kaspa. I could've waited a little longer to confirm the outcome of the election, that was my bad for not being patient enough but I still feel pretty safe.There's a silly mistake I made for Kaspa. I use Binance as my primary source but as you can see, Binance only shows data from last November. However, Kaspa was first introduced & started trading since 2022. And when we check the other sources, we see more data in the past. This significantly affects our analysis and approach on Kaspa. Despite Kaspa catching a lot of attention from the internet, the price is still struggling to move upwards after rebounding at the support zone. There's a high selling pressure and this could push Kaspa back to the zone and in worst cases, fuel into an aggressive downtrend. However, this doesn't change our strategy just yet and I'm still keeping my position. I just wanted to let you know of the possibility. I will pay more careful attention next time. But I'm glad to experience this because I learned a valuable lesson!Trade closed as price reached the target price of 0.14147.I want to add a final note that Kaspa has a bigger potential. Reason I exited at 0.14147 is because this is the key level price might react to. I have a strict rule of 'always set a TP (Take profit) order' to prevent overnight liquidation - and this was why the trade was closed along with other cryptos. I hope my analysis helped and if you haven't exited already, I hope you make bigger profit. God bless!
Disclaimer
Any content and materials included in Sahmeto's website and official communication channels are a compilation of personal opinions and analyses and are not binding. They do not constitute any recommendation for buying, selling, entering or exiting the stock market and cryptocurrency market. Also, all news and analyses included in the website and channels are merely republished information from official and unofficial domestic and foreign sources, and it is obvious that users of the said content are responsible for following up and ensuring the authenticity and accuracy of the materials. Therefore, while disclaiming responsibility, it is declared that the responsibility for any decision-making, action, and potential profit and loss in the capital market and cryptocurrency market lies with the trader.