
QAZIFXTRADER
@t_QAZIFXTRADER

What symbols does the trader recommend buying?
Purchase History
پیام های تریدر
Filter
QAZIFXTRADER
Bitcoin Breakout Formation Bulls Preparing for Next Leg Up
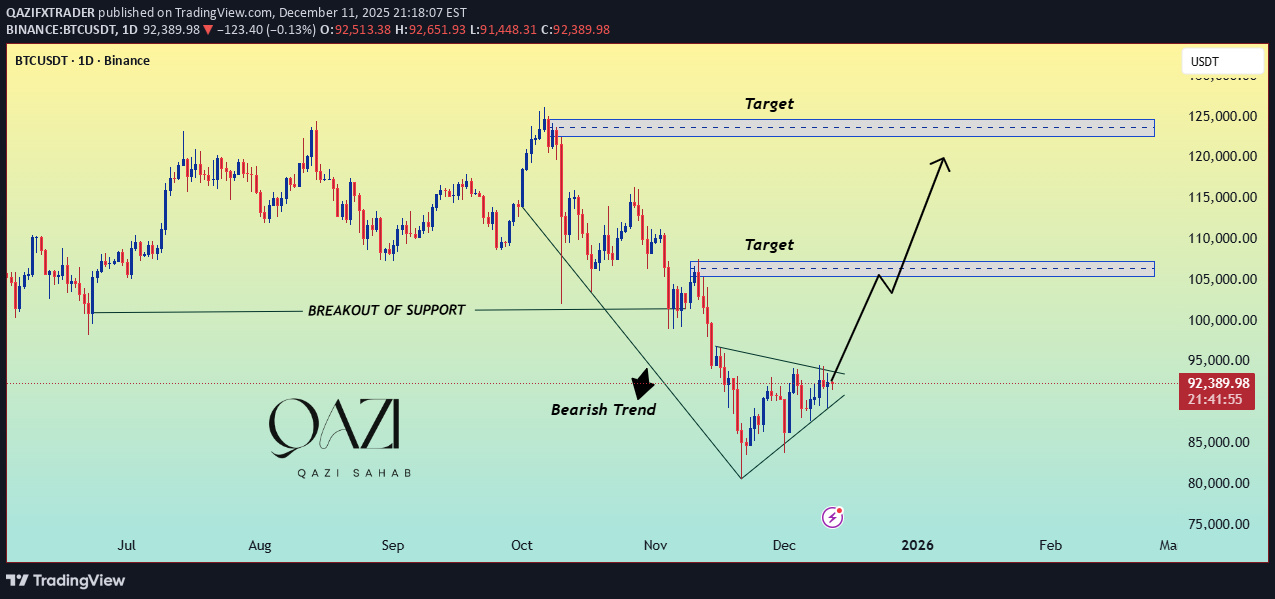
Bitcoin Builds Momentum: Bullish Breakout Targets $105K and Beyond 1. Bearish Trend Completion The chart shows a strong bearish trend that started after price rejected the upper supply zone. This downtrend accelerated when BTC broke below a key horizontal support level, confirming bearish control. 2. Formation of a Reversal Structure After the drop, price has been consolidating inside a wedge pattern. This is an important signal because: Selling momentum is weakening Buyers are slowly stepping in Price is making higher lows A breakout is becoming increasingly likely This wedge typically acts as a bullish reversal pattern when forming after a downtrend. 3. Key Breakout Zone Price is now pressing into the wedge resistance. A clean breakout with retest could trigger a strong bullish wave. This is the confirmation traders will focus on. 4. Upside Targets If the breakout happens: First Target Zone: $104,000 – $106,000 Previous support turned resistance High liquidity zone Likely to see reaction or short-term pullback Second Target Zone: $122,000 – $125,000 Major supply zone Strong seller interest earlier Final target for this potential bullish leg 5. What Confirms the Bullish Move A valid bullish breakout should include: Strong candle close above wedge Retest of the breakout line Increasing buy volume Price holding above $95,000 6. What Invalidation Looks Like If BTC fails to break the wedge and drops below the recent higher low, it may revisit: $88,000 zone This would continue the bearish structure. 📈 Summary BTC is showing early signs of reversal, but needs confirmation. A breakout above the wedge opens the way to $105K and potentially $125K. This is a classic shift from bearish downtrend → consolidation → bullish reversa
QAZIFXTRADER
بیت کوین آماده انفجار؟ منتظر شکست خط 85 هزار دلار باشید!
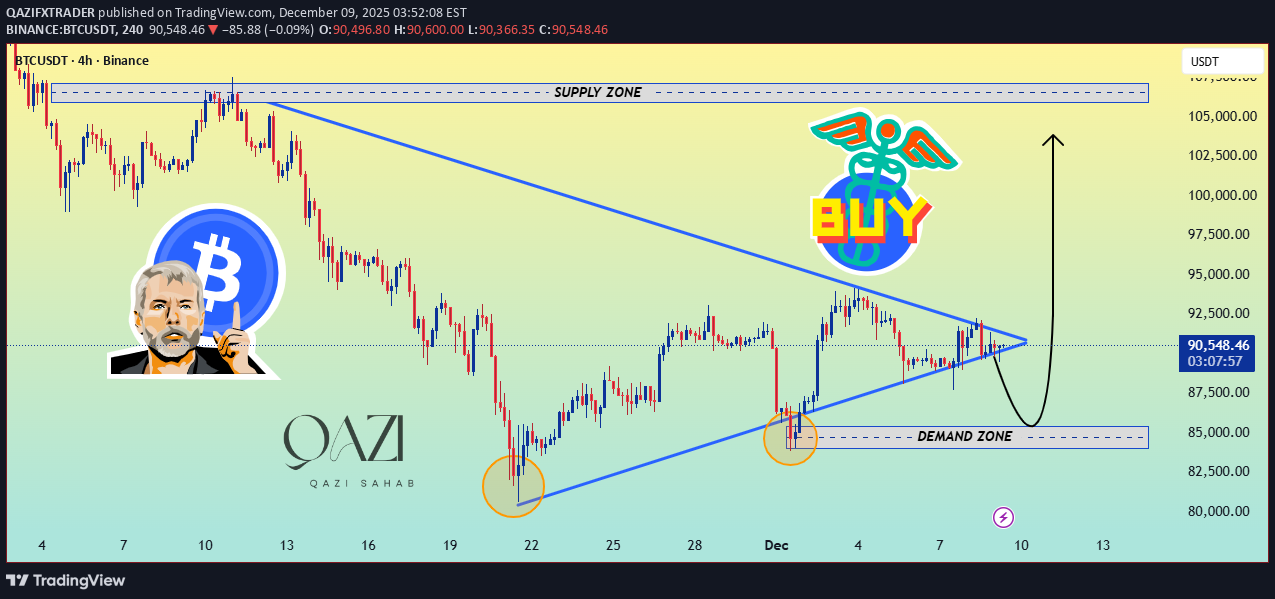
Bitcoin is consolidating inside a tightening symmetrical triangle, sitting right above a strong Demand Zone (≈ 85,000–87,000). Price has formed multiple higher lows, showing that buyers are defending the zone aggressively. A breakout from this structure could send BTC straight toward the major Supply Zone near 105,000+, where previous selling pressure was strong. If price retests the Demand Zone one more time and shows rejection, it may provide a high-probability BUY setup, targeting new highs. Market is coiling → volatility incoming → big move loading. Traders should watch the breakout levels closely. Trend Bias: Bullish ✅ BTCUSDT – Technical Analysis Bitcoin is currently trading inside a symmetrical triangle, indicating a phase of compression and reduced volatility. This pattern usually leads to a strong breakout, either up or down — but the chart shows more signs pointing toward the upside. 🔍 Key Technical Points 1️⃣ Strong Demand Zone (85,000–87,000 USDT) Price has bounced from this zone multiple times (highlighted circles). Each retest shows buyer strength, proving this is a solid support area. As long as BTC stays above this zone, the bullish bias remains strong. 2️⃣ Symmetrical Triangle Squeeze Lower trendline is rising → buyers are stepping up. Upper trendline is descending → compression building. Price is now at the apex → volatility breakout is near. 3️⃣ Breakout Bias: Bullish Your chart emphasizes a BUY scenario, and structurally it makes sense: Trendline supports are intact. Higher lows indicate accumulation. Market typically breaks upward when forming rising compression near strong support. 4️⃣ Targets on Upside If BTC breaks out upward: First target: 95,000 Main target: Supply Zone around 102,000–105,000 This aligns with your big arrow projection. 5️⃣ But… Watch the Retest A potential fakeout dip into the demand zone could appear before the big move. Traders often wait for: ✔ A retest ✔ Bullish candle formation ✔ Volume confirmation
QAZIFXTRADER
مفاهیم پول هوشمند (SMC) چیست؟ آموزش کامل استراتژی ترید نهنگها
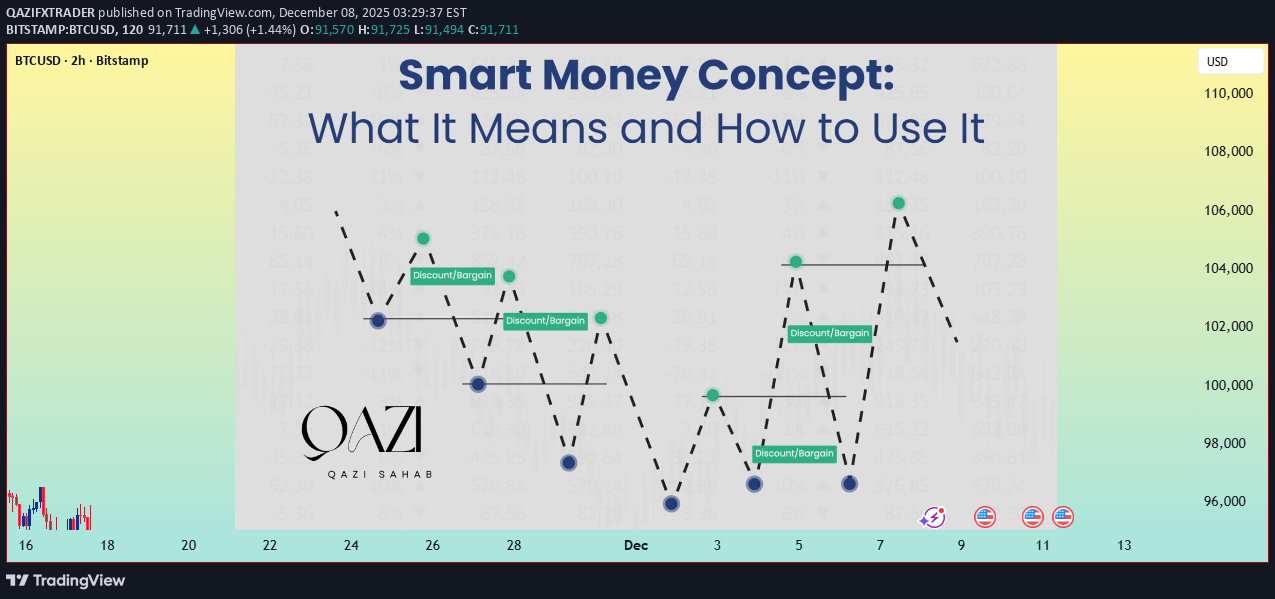
📘 What is SMC (Smart Money Concepts)? SMC — Smart Money Concepts — is a trading methodology that focuses on how institutions, banks, and big players move the market. Instead of chasing indicators, SMC analyzes liquidity, market structure, supply & demand zones, order blocks, and breaker levels to identify where smart money enters and exits the market. Smart Money leaves footprints on the chart — SMC helps you read those footprints. 🧠 How to Use SMC in Trading Here’s the simple step-by-step SMC framework: 1️⃣ Identify Market Structure Determine trend direction Look for HH, HL, LH, LL Wait for break of structure (BOS) or change of character (CHOCH) 2️⃣ Mark Supply & Demand Zones Demand Zone → where institutions buy Supply Zone → where institutions sell These zones give high-probability entry points. 3️⃣ Spot Order Blocks (OB) Last bullish/bearish candle before strong move Smart Money often re-tests OB before continuing trend 4️⃣ Track Liquidity Find where retail traders keep their: Stop-losses Equal highs/lows Trendlines Smart Money hunts liquidity before pushing price to the real direction. 5️⃣ Wait for Confirmation Entry You can enter with: OB retest Demand/Supply reaction Liquidity sweep + CHOCH FVG (Fair Value Gap) fill 6️⃣ Manage the Trade TP at next liquidity zone SL below/above protected swing Follow the trend, not the noise
QAZIFXTRADER
سقوط قریبالوقوع اتریوم: نشانههای هشداردهنده در برابر مقاومت ۳۲۰۰ دلار!
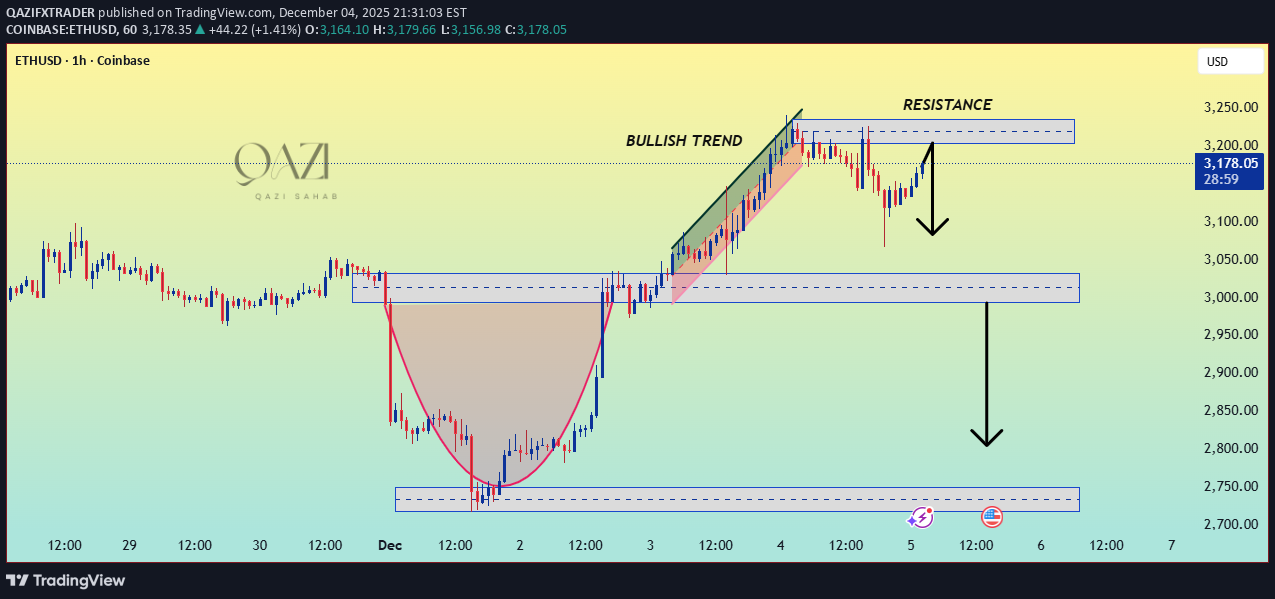
This ETHUSD H1 chart highlights a clean market structure where price recently rallied through a strong bullish trend, supported by a series of higher highs and higher lows. After a deep rounded bottom formation at the lower demand zone, Ethereum surged upward and reached the 3,200 resistance area, a significant supply zone where buyers previously struggled. At this resistance level, price showed clear signs of rejection. The structure now suggests that ETH is losing bullish momentum, and a corrective move is becoming more likely. The chart signals two major downside targets: 1: First Support Zone (~3,020–3,050): This is a previous consolidation and breakout region. Bears may push price into this zone first, creating a short-term reaction point. 2: Major Demand Zone (~2,750–2,780): A deeper liquidity pool where the previous trend reversal was initiated. If the first support fails, price could extend into this zone, marking a stronger correction. The current move shows a minor pullback toward resistance before continuation down—indicating a potential “lower high” formation and bearish continuation setup. Overall, ETHUSD is at a critical level: below resistance, losing momentum, and aligning with possible correction phases unless buyers reclaim control above the 3,200 zone.first target hit wait for second
QAZIFXTRADER
هشدار ریزش بیت کوین: تحلیل الگوی سقف دوقلو و تله نقدینگی در تایم فریم ساعتی
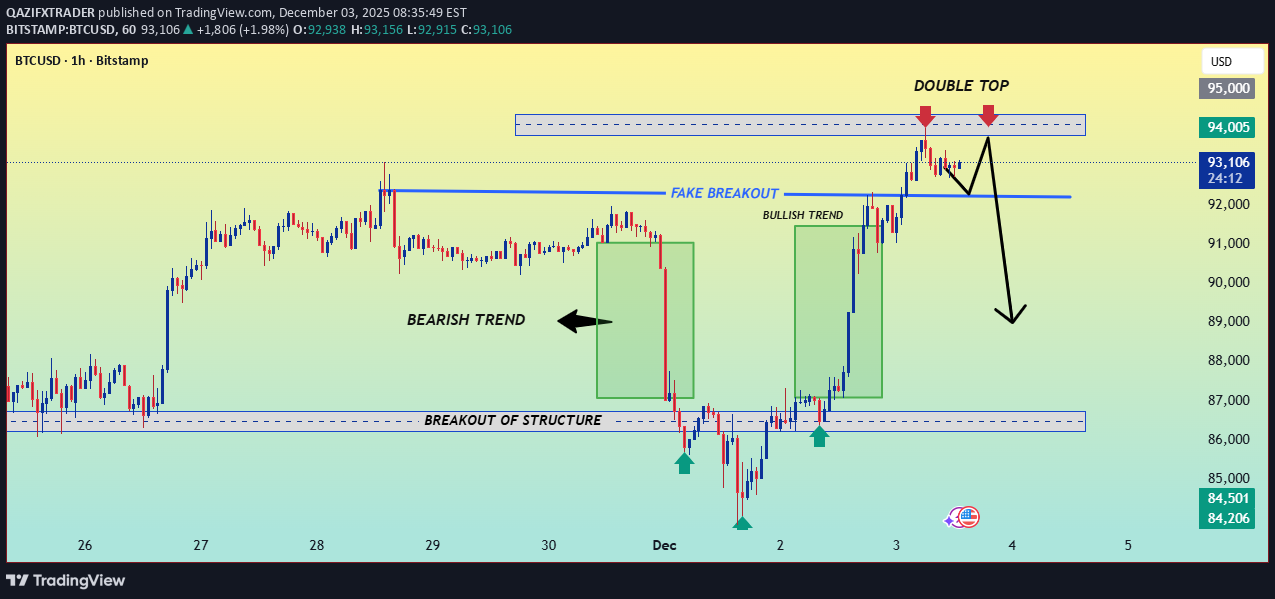
This chart illustrates a complete market structure shift on BTCUSD, highlighting a fake breakout, a clear double-top formation, and a potential bearish reversal setup. After a strong bullish rally and liquidity sweep above resistance, price rejects the upper zone and forms a double top, signaling exhaustion. A break and retest of the mid-range support could trigger a deeper sell-off toward the previous structural breakout zone. Key elements include: 1:Fake breakout above resistance 2:Double-top rejection at premium pricing 3:Transition from bullish momentum to potential bearish trend continuation High-probability short setup targeting $89K–$87K liquidity 1. Structure and Trend Changes Bearish Trend: The period leading up to December 1st shows consolidation and a slight downward movement, labeled "BEARISH TREND". Breakout of Structure: The price drops significantly below a key support area around $87,000, labeled "BREAKOUT OF STRUCTURE". This confirms the short-term bearish momentum. V-Shaped Reversal: Following the breakout, the price quickly reverses, establishing a new low and then sharply rallying. Bullish Trend: The strong upward move starting around December 2nd is labeled "BULLISH TREND", indicating a recovery and a change in the immediate market direction. Fake Breakout: The chart marks a previous high near $92,000, which was temporarily breached but failed to hold, suggesting a temporary exhaustion or manipulation before the major push higher. 2. Current Pattern Formation: Double Top The most critical feature on the chart is the potential "DOUBLE TOP" pattern forming at the current highs. First Top: The initial peak of the strong bullish move. Second Top: The price has returned to the same resistance zone (between $94,000 and $95,000) and is showing a rejection (the red arrow). The current price is near $93,102. Double Top Zone: The horizontal blue shaded box marks the significant resistance area where the pattern is forming. 3. Immediate Projection (The Plan) The arrows drawn on the chart suggest a specific trading bias: Scenario 1 (Completion of Double Top): The price is expected to rise slightly to tag the resistance zone fully for the second time. Scenario 2 (Reversal): After tagging the second top, the dominant black arrow indicates a strong potential reversal to the downside, targeting significantly lower levels (potentially back towards the $89,000 - $87,000 region). 4. Key Levels to Watch Major Resistance (Double Top): $94,000 - $95,000 (This must hold for the bearish scenario to play out). Current Support/Neckline: The most critical level for a confirmed double top pattern is the swing low between the two peaks. Based on the arrow's implied target, the low around the $92,000 horizontal line or the base of the recent move around $90,000 would be key levels to watch for confirmation of the reversal. A break below the neckline would validate the double top pattern. In summary: The analyst believes the recent strong bullish move is exhausted and that the formation of a Double Top at the $94,000 - $95,000 resistance area is a strong signal for a significant short-term correction/sell-off.
QAZIFXTRADER
اتریوم در آستانه سقوط؟ نشانههای قوی برگشت نزولی در مقاومت کلیدی!
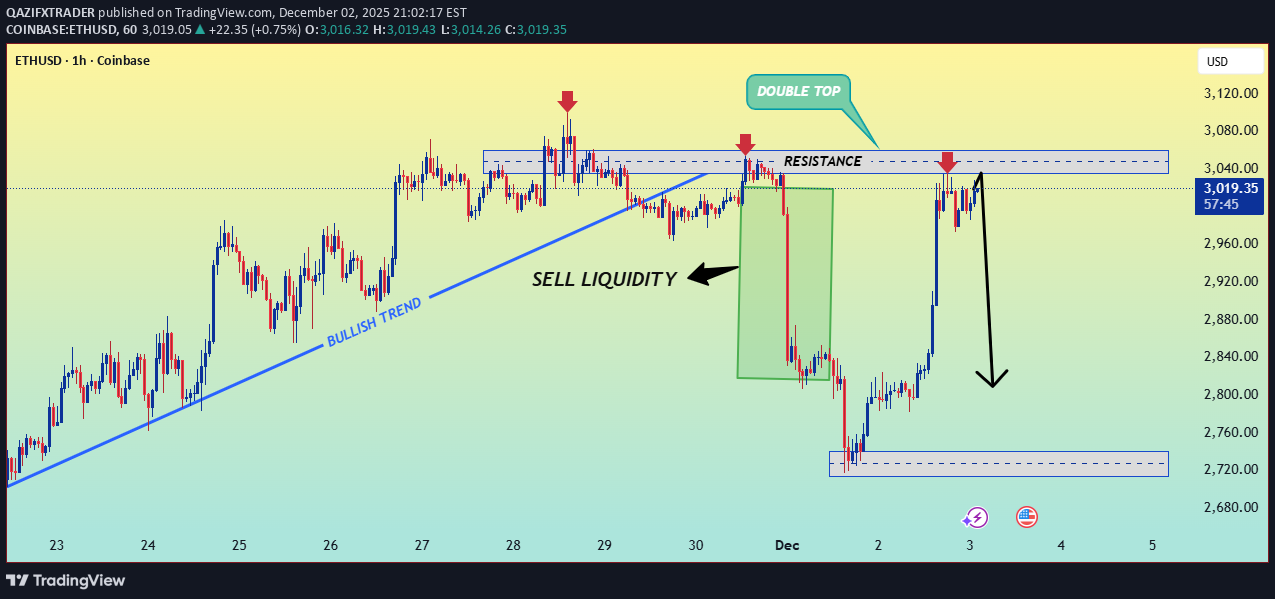
Ethereum has formed a clear double-top pattern at a major resistance zone, suggesting weakening bullish momentum. After sweeping sell-side liquidity and breaking the ascending trendline, price retested the resistance area and showed strong rejection. This indicates a likely bearish continuation, with downside targets aligned with the previous demand zone around $2,720–$2,750. Traders should watch for confirmation of a lower high before entering short positions. 1. Prior Trend: Bullish Trendline (Broken) Price was following a clean bullish trendline, making consistent higher lows. This trendline was eventually broken, which is the first sign of weakening bullish structure. 2. Major Resistance Zone Identified Price repeatedly reacted to the $3,030–$3,050 resistance zone, forming: Multiple rejections (red arrows) Liquidity build-up above equal highs A double-top pattern, signaling exhaustion of buyers This level is clearly a strong institutional resistance zone. 3. Liquidity Sweep & Market Structure Shift Inside the highlighted zone: Price swept liquidity above previous highs (stop-hunt). Immediately after, a strong bearish displacement occurred (large red move). This created a market structure shift (MSS) from bullish to bearish. This is typical of: Smart Money Concepts (SMC) — Liquidity grab + reversal 4. Bearish Retracement Back Into Supply After falling sharply, ETH retraced back into: The same resistance/supply zone Inside the double-top region With weakened bullish reaction This suggests the retracement is corrective, not a bullish continuation. 5. Expected Move (Based on Structure) A clear sell-side target around $2,720–$2,750 A previous demand zone where orders were filled last time Clean lows below, acting as sell-side liquidity ✔ Trendline broken → bullish trend weakening ✔ Liquidity swept at resistance → stop-hunt ✔ Double top → reversal signal ✔ Strong bearish displacement → institutional selling ✔ Retest into supply → continuation setup ✔ Downside target: $2,720–$2,750
QAZIFXTRADER
تحلیل طلا (XAUUSD) در تایم فریم 1 ساعته: آیا مسیر صعود تا 4300 ادامه دارد؟
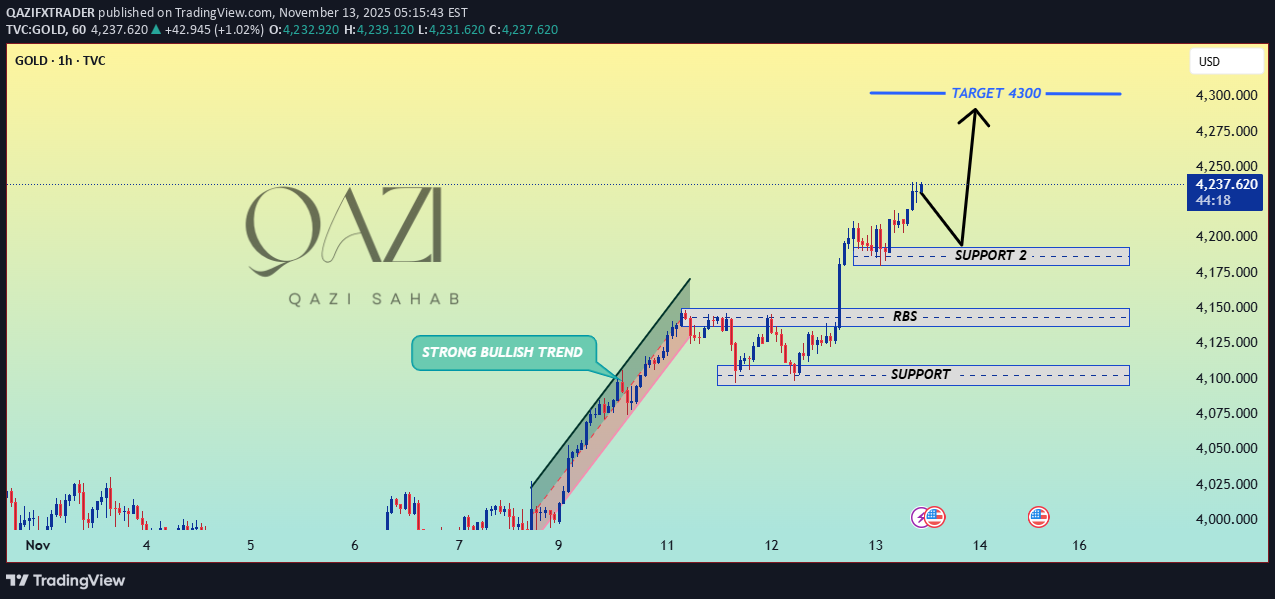
📈 GOLD (XAU/USD) Technical Snapshot The chart illustrates a strong bullish trend that initiated around November 9th. Following this powerful upward move, the price entered a consolidation or pullback phase. Current Price: Approximately 4,235.506. Key Support Levels: SUPPORT 2: Around 4,185 (The most recent significant support). RBS (Resistance-Broken-as-Support): Around 4,140 (A previous resistance level now expected to act as support). SUPPORT: Around 4,100. Outlook: The analysis anticipates a further move up, likely following a slight pullback toward SUPPORT 2. Target The immediate long-term price target is set at 4,300. This suggests traders are looking for an entry near SUPPORT 2 to ride the continuation of the strong bullish momentum towards the 4,300 target.
QAZIFXTRADER
تحلیل طلا (XAUUSD) در تایم فریم 4 ساعته: فرصت خرید پس از شکست مقاومت!
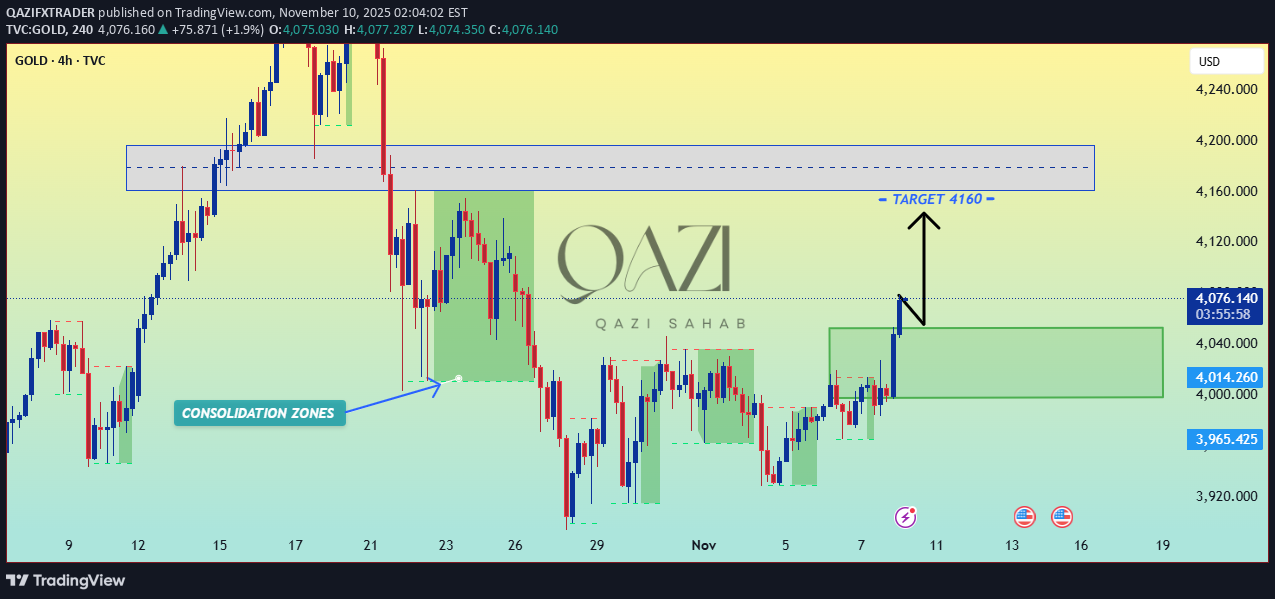
This is a 4-hour technical analysis chart for GOLD . 🟢 Key Price Zones Consolidation Zones: The chart highlights several areas where the price moved sideways, indicating a period of indecision or accumulation. The most recent consolidation zone is marked between roughly $3,965 and $4,040. Current Action: The price has recently broken out above the upper boundary of the most recent consolidation zone (above $4,040). Resistance Zone: A significant overhead resistance area is marked between approximately $4,170 and $4,200. 🎯 Trading Scenario The main scenario shown is a bullish continuation following the breakout: 1. Breakout and Retest: The price is shown to have broken the consolidation zone and is moving higher. The black arrows suggest a potential short-term pullback or a direct continuation. 2. Target: The immediate target for this upward move is set at Target 4160 (likely $4,160), which is just below the main resistance zone.running 500 pips
QAZIFXTRADER
تحلیل فنی بیت کوین (BTC/USD) در تایم فریم ۱ ساعته: سناریو صعودی یا سقوط به ۱۰۰,۰۰۰ دلار؟
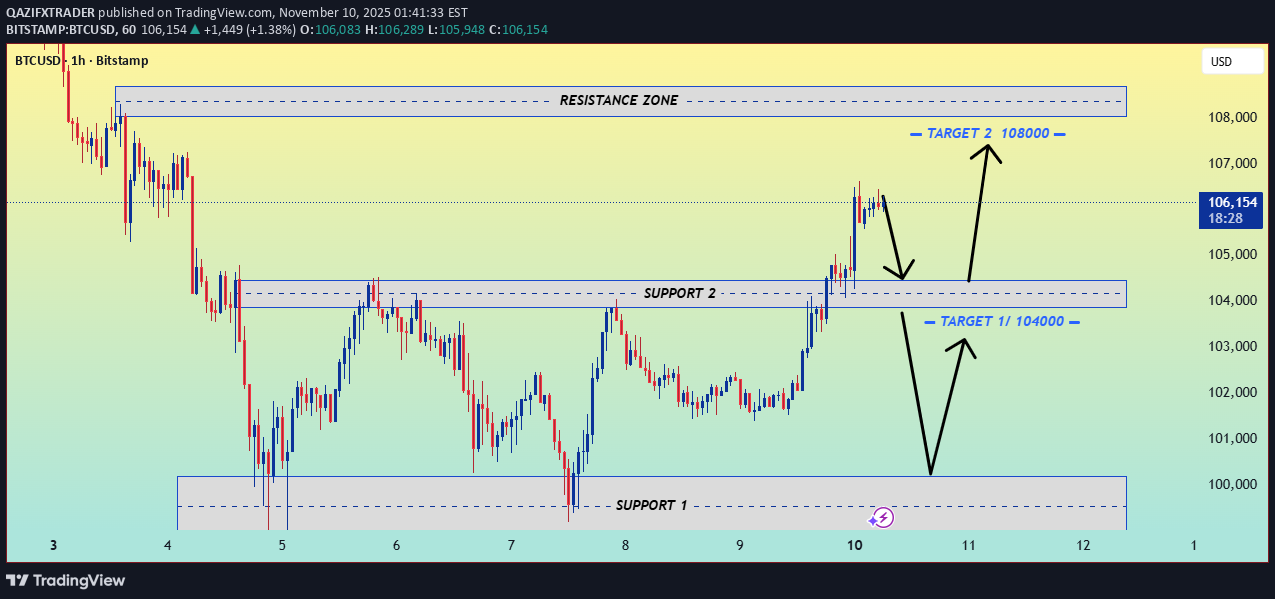
That's an interesting technical analysis chart for BTC/USD on a 1-hour timeframe. Here is a short description of the key elements and scenarios depicted: The chart shows Bitcoin's price currently sitting at approximately **$106,133**. 📉 Key Price Levels Resistance Zone: The primary overhead resistance is marked just below $109,000. Support 2 (Broken/Tested): An intermediate support/resistance level is established around the $104,000 mark. The price has recently moved above this zone. Support 1: A strong base is indicated around $100,000. 📈 Scenarios and Targets The chart illustrates two potential short-term scenarios, characterized by a possible **retest** of a former resistance/support level: 1. Bullish Scenario (Upward Path): * The price moves down to retest the Support 2 zone (around $104,000). * If it holds, it's expected to bounce up toward Target 2 at $108,000. 2. Bearish Scenario (Downward Path): * The price moves down and breaks below the Support 2 zone. * It's expected to drop significantly toward Support 1 at $100,000. Target 1 is set at the level of the broken Support 2, which is $104,000, likely indicating a failure to hold this area before the drop to $100,000. The analysis hinges on the price action around the $104,000 level.
QAZIFXTRADER
تحلیل فوری بیت کوین (ETH/USD): فرصت خرید در حمایت 3700 یا سقوط به 3850؟
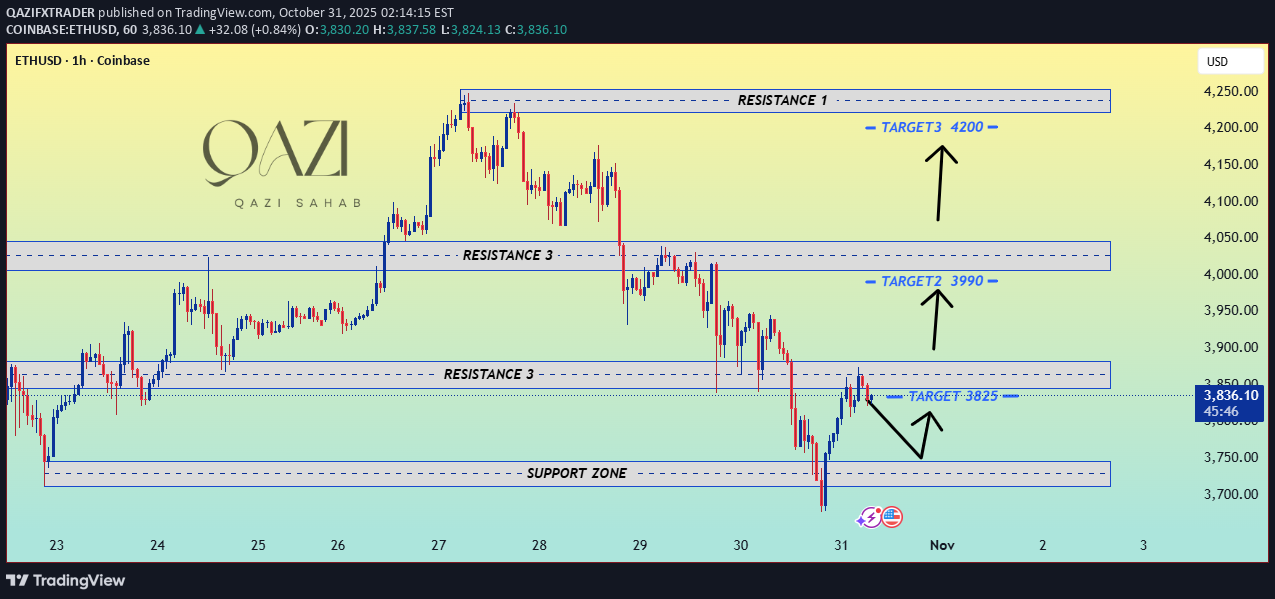
The chart highlights key support and resistance zones Key Observations: The price is currently hovering around the $3,827.74 level, just below an area labeled RESISTANCE 3 (which appears to be acting as current resistance). A SUPPORT ZONE is marked around the \$3,700 - \$3,750range. The chart indicates a potential upward movement with three sequential targets: TARGET 3825: The first immediate objective (this target has already been reached or is the immediate next level, depending on the interpretation of the arrow). TARGET 3990: Corresponds to the next resistance area, labeled RESISTANCE 3 higher up. TARGET 4200: Corresponds to the highest marked resistance, labeled RESISTANCE 1. The short-term arrows suggest the price may first test the immediate resistance (around \$3,850) and then potentially move down to retest the support zone before attempting a larger move toward the $3,990 target.
Disclaimer
Any content and materials included in Sahmeto's website and official communication channels are a compilation of personal opinions and analyses and are not binding. They do not constitute any recommendation for buying, selling, entering or exiting the stock market and cryptocurrency market. Also, all news and analyses included in the website and channels are merely republished information from official and unofficial domestic and foreign sources, and it is obvious that users of the said content are responsible for following up and ensuring the authenticity and accuracy of the materials. Therefore, while disclaiming responsibility, it is declared that the responsibility for any decision-making, action, and potential profit and loss in the capital market and cryptocurrency market lies with the trader.