Technical analysis by QAZIFXTRADER about Symbol BTC on 12/9/2025

QAZIFXTRADER
بیت کوین آماده انفجار؟ منتظر شکست خط 85 هزار دلار باشید!
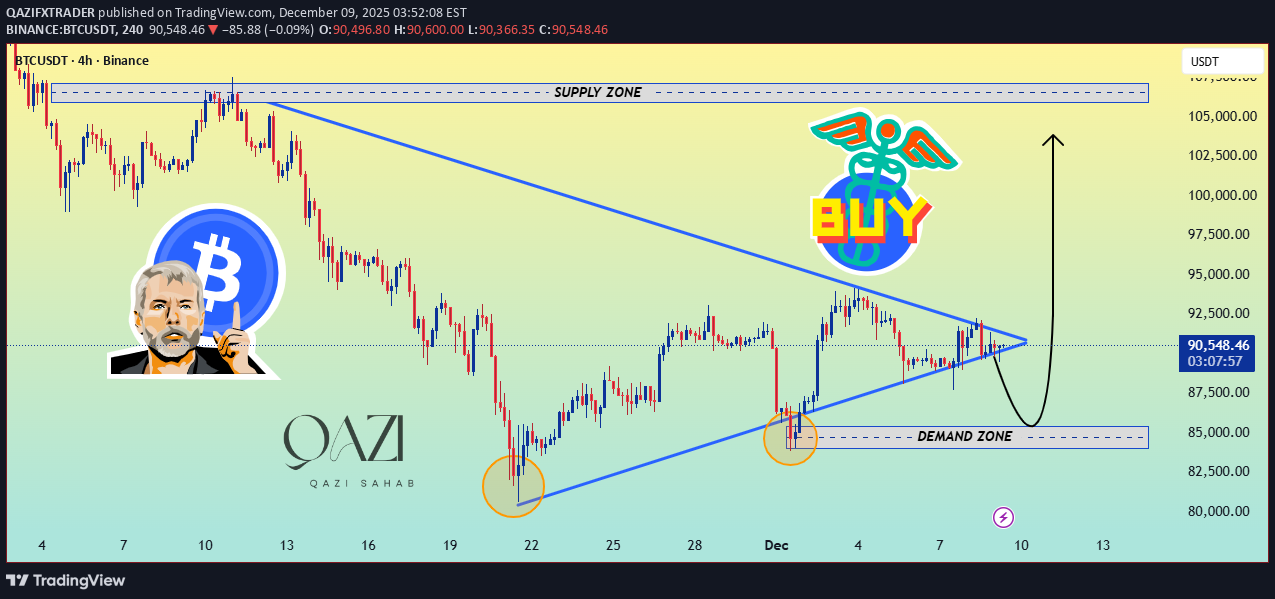
Bitcoin is consolidating inside a tightening symmetrical triangle, sitting right above a strong Demand Zone (≈ 85,000–87,000). Price has formed multiple higher lows, showing that buyers are defending the zone aggressively. A breakout from this structure could send BTC straight toward the major Supply Zone near 105,000+, where previous selling pressure was strong. If price retests the Demand Zone one more time and shows rejection, it may provide a high-probability BUY setup, targeting new highs. Market is coiling → volatility incoming → big move loading. Traders should watch the breakout levels closely. Trend Bias: Bullish ✅ BTCUSDT – Technical Analysis Bitcoin is currently trading inside a symmetrical triangle, indicating a phase of compression and reduced volatility. This pattern usually leads to a strong breakout, either up or down — but the chart shows more signs pointing toward the upside. 🔍 Key Technical Points 1️⃣ Strong Demand Zone (85,000–87,000 USDT) Price has bounced from this zone multiple times (highlighted circles). Each retest shows buyer strength, proving this is a solid support area. As long as BTC stays above this zone, the bullish bias remains strong. 2️⃣ Symmetrical Triangle Squeeze Lower trendline is rising → buyers are stepping up. Upper trendline is descending → compression building. Price is now at the apex → volatility breakout is near. 3️⃣ Breakout Bias: Bullish Your chart emphasizes a BUY scenario, and structurally it makes sense: Trendline supports are intact. Higher lows indicate accumulation. Market typically breaks upward when forming rising compression near strong support. 4️⃣ Targets on Upside If BTC breaks out upward: First target: 95,000 Main target: Supply Zone around 102,000–105,000 This aligns with your big arrow projection. 5️⃣ But… Watch the Retest A potential fakeout dip into the demand zone could appear before the big move. Traders often wait for: ✔ A retest ✔ Bullish candle formation ✔ Volume confirmation