Technical analysis by QAZIFXTRADER about Symbol ETH on 12/5/2025

QAZIFXTRADER
سقوط قریبالوقوع اتریوم: نشانههای هشداردهنده در برابر مقاومت ۳۲۰۰ دلار!
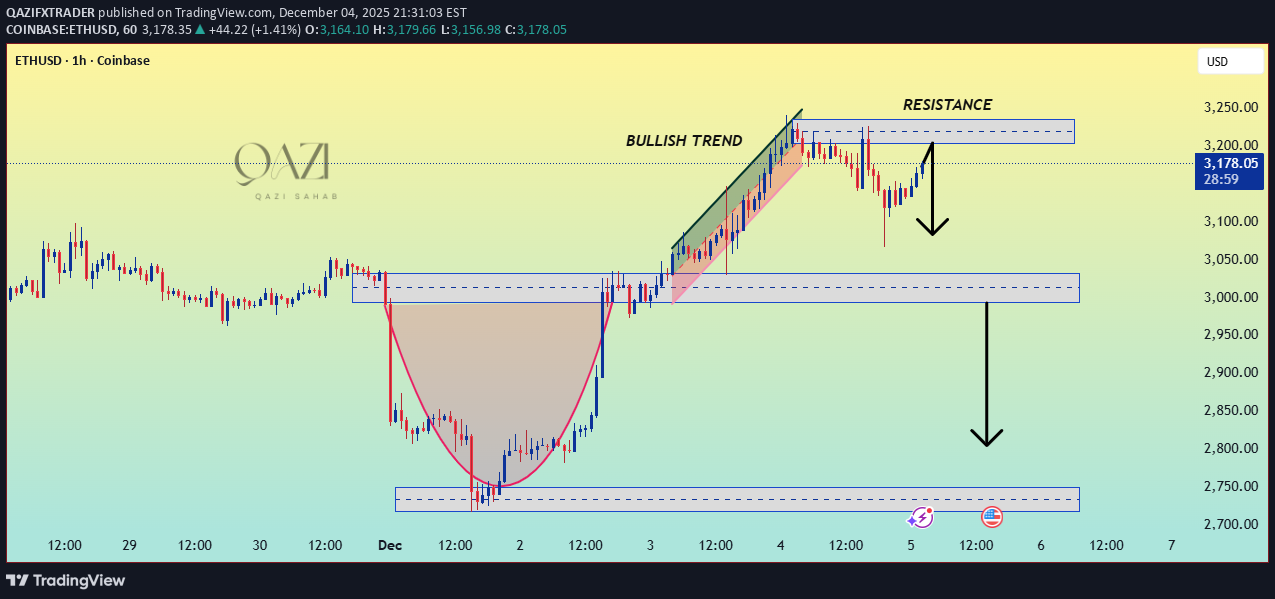
This ETHUSD H1 chart highlights a clean market structure where price recently rallied through a strong bullish trend, supported by a series of higher highs and higher lows. After a deep rounded bottom formation at the lower demand zone, Ethereum surged upward and reached the 3,200 resistance area, a significant supply zone where buyers previously struggled. At this resistance level, price showed clear signs of rejection. The structure now suggests that ETH is losing bullish momentum, and a corrective move is becoming more likely. The chart signals two major downside targets: 1: First Support Zone (~3,020–3,050): This is a previous consolidation and breakout region. Bears may push price into this zone first, creating a short-term reaction point. 2: Major Demand Zone (~2,750–2,780): A deeper liquidity pool where the previous trend reversal was initiated. If the first support fails, price could extend into this zone, marking a stronger correction. The current move shows a minor pullback toward resistance before continuation down—indicating a potential “lower high” formation and bearish continuation setup. Overall, ETHUSD is at a critical level: below resistance, losing momentum, and aligning with possible correction phases unless buyers reclaim control above the 3,200 zone.first target hit wait for second