Technical analysis by QAZIFXTRADER about Symbol BTC on 12/3/2025

QAZIFXTRADER
هشدار ریزش بیت کوین: تحلیل الگوی سقف دوقلو و تله نقدینگی در تایم فریم ساعتی
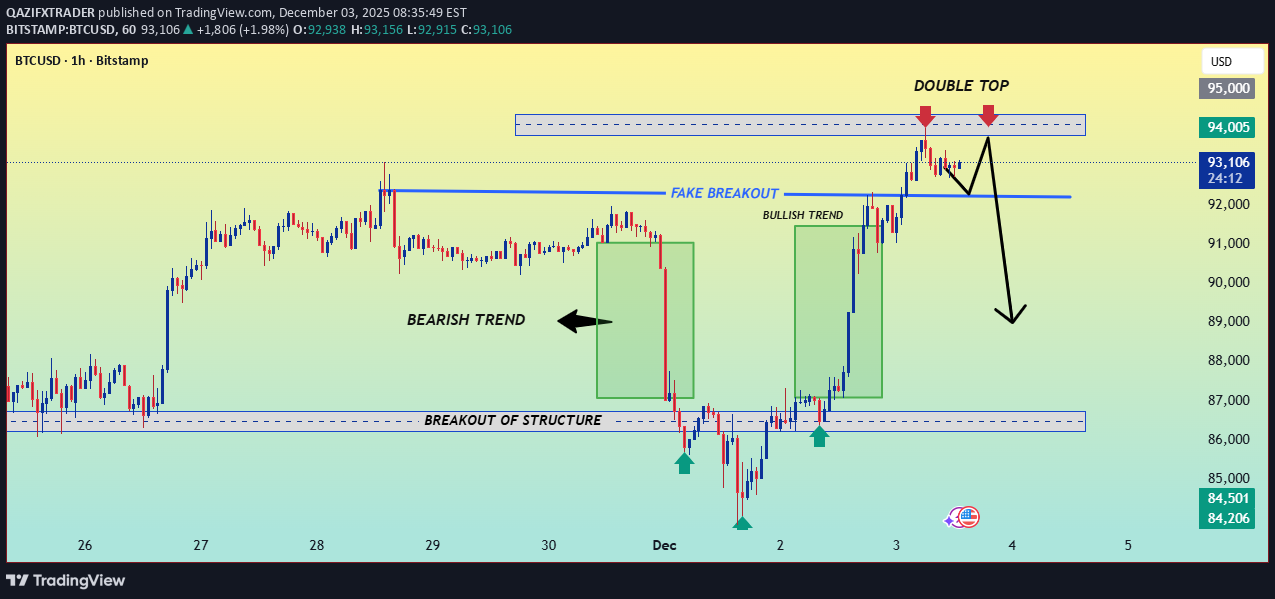
This chart illustrates a complete market structure shift on BTCUSD, highlighting a fake breakout, a clear double-top formation, and a potential bearish reversal setup. After a strong bullish rally and liquidity sweep above resistance, price rejects the upper zone and forms a double top, signaling exhaustion. A break and retest of the mid-range support could trigger a deeper sell-off toward the previous structural breakout zone. Key elements include: 1:Fake breakout above resistance 2:Double-top rejection at premium pricing 3:Transition from bullish momentum to potential bearish trend continuation High-probability short setup targeting $89K–$87K liquidity 1. Structure and Trend Changes Bearish Trend: The period leading up to December 1st shows consolidation and a slight downward movement, labeled "BEARISH TREND". Breakout of Structure: The price drops significantly below a key support area around $87,000, labeled "BREAKOUT OF STRUCTURE". This confirms the short-term bearish momentum. V-Shaped Reversal: Following the breakout, the price quickly reverses, establishing a new low and then sharply rallying. Bullish Trend: The strong upward move starting around December 2nd is labeled "BULLISH TREND", indicating a recovery and a change in the immediate market direction. Fake Breakout: The chart marks a previous high near $92,000, which was temporarily breached but failed to hold, suggesting a temporary exhaustion or manipulation before the major push higher. 2. Current Pattern Formation: Double Top The most critical feature on the chart is the potential "DOUBLE TOP" pattern forming at the current highs. First Top: The initial peak of the strong bullish move. Second Top: The price has returned to the same resistance zone (between $94,000 and $95,000) and is showing a rejection (the red arrow). The current price is near $93,102. Double Top Zone: The horizontal blue shaded box marks the significant resistance area where the pattern is forming. 3. Immediate Projection (The Plan) The arrows drawn on the chart suggest a specific trading bias: Scenario 1 (Completion of Double Top): The price is expected to rise slightly to tag the resistance zone fully for the second time. Scenario 2 (Reversal): After tagging the second top, the dominant black arrow indicates a strong potential reversal to the downside, targeting significantly lower levels (potentially back towards the $89,000 - $87,000 region). 4. Key Levels to Watch Major Resistance (Double Top): $94,000 - $95,000 (This must hold for the bearish scenario to play out). Current Support/Neckline: The most critical level for a confirmed double top pattern is the swing low between the two peaks. Based on the arrow's implied target, the low around the $92,000 horizontal line or the base of the recent move around $90,000 would be key levels to watch for confirmation of the reversal. A break below the neckline would validate the double top pattern. In summary: The analyst believes the recent strong bullish move is exhausted and that the formation of a Double Top at the $94,000 - $95,000 resistance area is a strong signal for a significant short-term correction/sell-off.