Pepperstone
@t_Pepperstone

What symbols does the trader recommend buying?
Purchase History
پیام های تریدر
Filter
Pepperstone
پیناسکنر تریدینگویو: اسکن قدرتمند برای یافتن بهترین فرصتهای معاملاتی
We put TradingView’s PineScreener functionality to work, defining indicators within tailored scans to surface movement, volatility, and momentum directly to the trader. We break down the set-ups that screen well and explore how they can be traded most effectively. Take a look…
Pepperstone
بیت کوین در کف ترس؛ آیا قیمت هم به همین اندازه سقوط کرده است؟
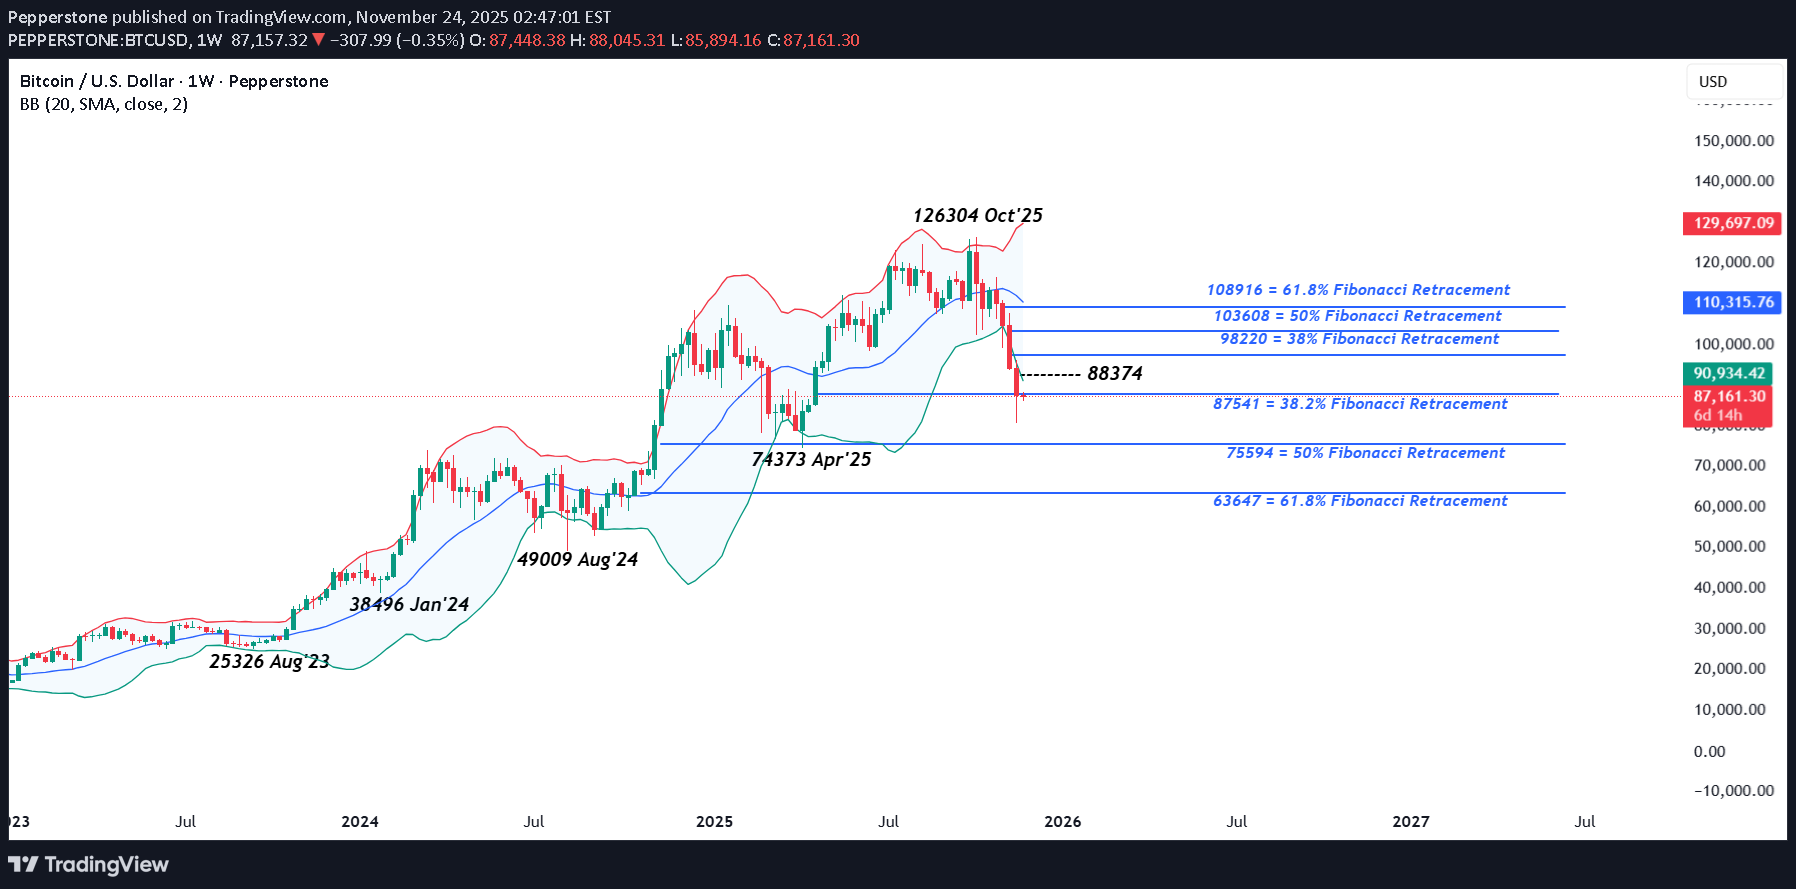
Bitcoin slumped to 80498 on Friday, its lowest trade since late April and a fall of 27% from its opening level of around 110000 at the start of November. However, the negativity hasn’t just been contained to Bitcoin, the crypto currency market has lost over $1 trillion in value during the same period, a move which has sent CoinMarketCap’s fear and greed index into extreme fear territory with a reading of 10 out of 100. Something which is perhaps unsurprising given how quickly the move has happened. Market observers have struggled to point to one single reason for the large drop but it could be linked to profit taking on popular leveraged trades across several asset classes that have produced strong gains in 2025. For example, in October Gold fell 11% from a record high of 4381 to 3886, and in the AI space, during November Palantir Technologies slumped 33% 221.75 to 147.50. Bitcoin’s shift into the mainstream could also be important. Institutional investors are not afraid to cut underperforming positions during periods of risk aversion, and it has been noted that billions have been taken out of Bitcoin exchange traded funds (ETFs) during November. This rush by investors to get out at the same time can reduce liquidity and extend moves to more extreme levels. Over the weekend, Bitcoin prices, which trade 24 hours a day 7 days per week unlike traditional financial markets, stabilised in the short-term trading back above 86000 early on Monday morning. The question now is ‘what comes next?’ To answer this, traders may be looking towards the charts to identify potentially important levels that could indicate the next directional moves for Bitcoin. Technical Update: Retracement Support Levels in Focus: Break Lower or Hold? Bitcoin has dropped 36% from its October all‑time high of 126304, marking a sharp correction in price. Historically such volatility has been typical within crypto markets and traders could now be weighing whether this decline may extend further or is a temporary pullback before price recovery, as has proved to be the case in the recent past. As the chart above highlights, a concern for Bitcoin bulls may well be that support at 87541, the 38.2% Fibonacci retracement, has been broken on a closing basis. Normally this level might be anticipated to limit declines, even encourage upside resumption, but the current risks are this failure to do so in the last week may lead to potential for further weakness. Possible Support Levels: A close below the 38.2% Fibonacci retracement support could be viewed as opening scope for further downside moves. Whether this proves true for Bitcoin in the week ahead remains uncertain, but the break below 87541 does raise the possibility for tests of lower support levels. If this plays out, traders may turn their attention to the 50% Fibonacci retracement at 75594, which links with the April 2025 low of 74373. Should closing breaks below these levels occur, then downside potential may extend toward 63647, which marks the deeper 62% retracement. Potential Resistance Levels: After such a sharp decline, a short‑term recovery is possible to help unwind overextended conditions. However, for this to evolve into a more sustained rebound, closes above 88374 (half of last week’s range) may be necessary. While not an outright positive signal, closes above 88374 may lead to tests of 98220, a level equal to the 38% retracement of the October/November declines. Should closing breaks above 98220 be achieved, this could in turn pave the way for further strength toward 103608, the 50% retracement level. The material provided here has not been prepared accordance with legal requirements designed to promote the independence of investment research and as such is considered to be a marketing communication. Whilst it is not subject to any prohibition on dealing ahead of the dissemination of investment research, we will not seek to take any advantage before providing it to our clients. Pepperstone doesn’t represent that the material provided here is accurate, current or complete, and therefore shouldn’t be relied upon as such. The information, whether from a third party or not, isn’t to be considered as a recommendation; or an offer to buy or sell; or the solicitation of an offer to buy or sell any security, financial product or instrument; or to participate in any particular trading strategy. It does not take into account readers’ financial situation or investment objectives. We advise any readers of this content to seek their own advice. Without the approval of Pepperstone, reproduction or redistribution of this information isn’t permitted.
Pepperstone
وضعیت سهام انویدیا قبل از گزارش درآمد: اصلاح جزئی یا تغییر کامل بازار؟
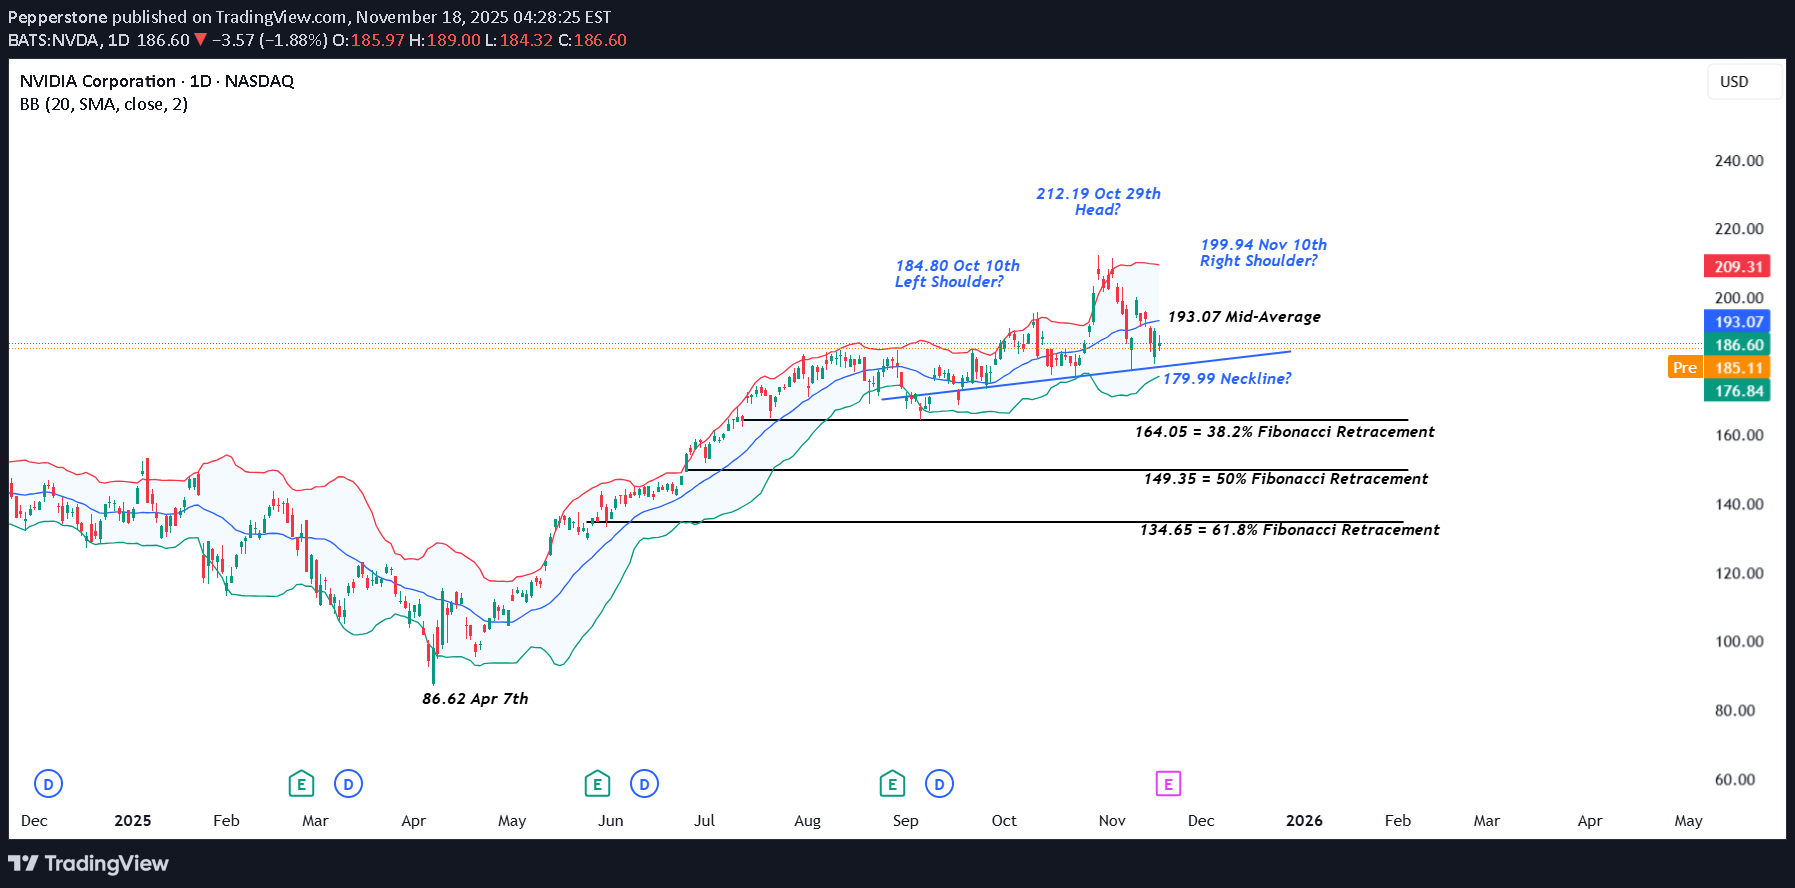
There is no getting away from it, NVIDIA’s earnings, which are due on Wednesday after the close are making traders nervous. The problem with being the largest company in the world by market capitalisation (approx.$4.53 trillion) with a roughly 7.5% weighting in the S&P 500 and closer to 10% weighting in the Nasdaq 100 is that everything related to your company matters, especially when you are seen as the global AI benchmark at a time when traders are wondering if lofty valuations given to the leading companies in the space are justified or not. Suddenly, stories like Softbank selling its entire NVIDIA stake of $5.8 billion last week, gets more headline space in the financial press and now your Q3 earnings are potentially being seen as important to the direction of market sentiment and risk appetite as whether the Federal Reserve decides to cut interest rates again at its final meeting of the year on December 10th. The earnings, when they are released are anticipated to be strong, with Reuters reporting analysts expecting an average 54% year on year rise on Q3 earnings per share. However, while traders may be judging the actual results against market expectations, they may also be keen to hear the updates from CEO Jensen Huang regarding future revenue and chips sales moving forward. With the potential for extra volatility in NVIDIA’s share price across the next 48 hours being apprised of the technical backdrop could be important. Technical Update: Limited Correction or Sentiment Shift? It has been a choppy period for the Nvidia share price since mid-September 2025, activity that has seen 3 distinct highs in price posted. As the chart below shows, these stand at 184.80 on October 10th, 212.19 from October 29th and 199.94, scored on November 10th. As you can also see on the chart, the 2nd of these 3 peaks at 212.19, is higher than the other 2, which is important from a technical perspective. This may lead some analysts to suggest this activity could be forming a potential Head and Shoulders top pattern. It is important to stress that a Head and Shoulders pattern must be completed by a close below the ‘neckline’ or the trend connecting recent price lows, which in the case of Nvidia currently stands at 179.99. Even then, completion of such a pattern isn’t a guarantee of a sentiment shift, but as we approach Nvidia earnings on Wednesday, risks may turn towards increased price volatility, and being aware of potentially relevant support and resistance levels may prove useful. [bWhat if Closes Below 179.99 Support are Seen?: Having seen recent price weakness held and reversed to the upside by the uptrend currently standing at 179.99, this could now be viewed as the first support focus. However, with it also possibly being the neckline of a potential Head and Shoulders pattern, it may prove to be pivotal moving forward. While there is no guarantee closes that below the support at 179.99 may lead to a further phase of price weakness, it might skew risks towards continued declines. Focus may then turn towards 164.05, a level equal to the 38.2% retracement level of April to October strength, possibly even towards 149.35, which is the 50% retracement. What if 179.99 Support Remains Intact?: As already said, any Head and Shoulders pattern must see closes below neckline support to suggest a completion and risks for further price declines. For Nvidia the 179.99 support is still intact on a closing basis, and it could be argued this is not yet a valid reversal pattern. As such, while the 179.99 level holds, traders may view recent price declines as a limited correction within what could still be classed as an uptrend in price. However, if a further phase of price strength is to materialise, traders may require closes back above the still rising Bollinger mid-average currently at 193.07. Such moves if seen, could then lead to tests of 199.94 the November 10th high, even on towards 212.19, the October 29th extreme. The material provided here has not been prepared accordance with legal requirements designed to promote the independence of investment research and as such is considered to be a marketing communication. Whilst it is not subject to any prohibition on dealing ahead of the dissemination of investment research, we will not seek to take any advantage before providing it to our clients. Pepperstone doesn’t represent that the material provided here is accurate, current or complete, and therefore shouldn’t be relied upon as such. The information, whether from a third party or not, isn’t to be considered as a recommendation; or an offer to buy or sell; or the solicitation of an offer to buy or sell any security, financial product or instrument; or to participate in any particular trading strategy. It does not take into account readers’ financial situation or investment objectives. We advise any readers of this content to seek their own advice. Without the approval of Pepperstone, reproduction or redistribution of this information isn’t permitted.
Pepperstone
صعود انفجاری طلا: چرا آرامش سیاسی بازار آمریکا قیمتها را به اوج رساند؟
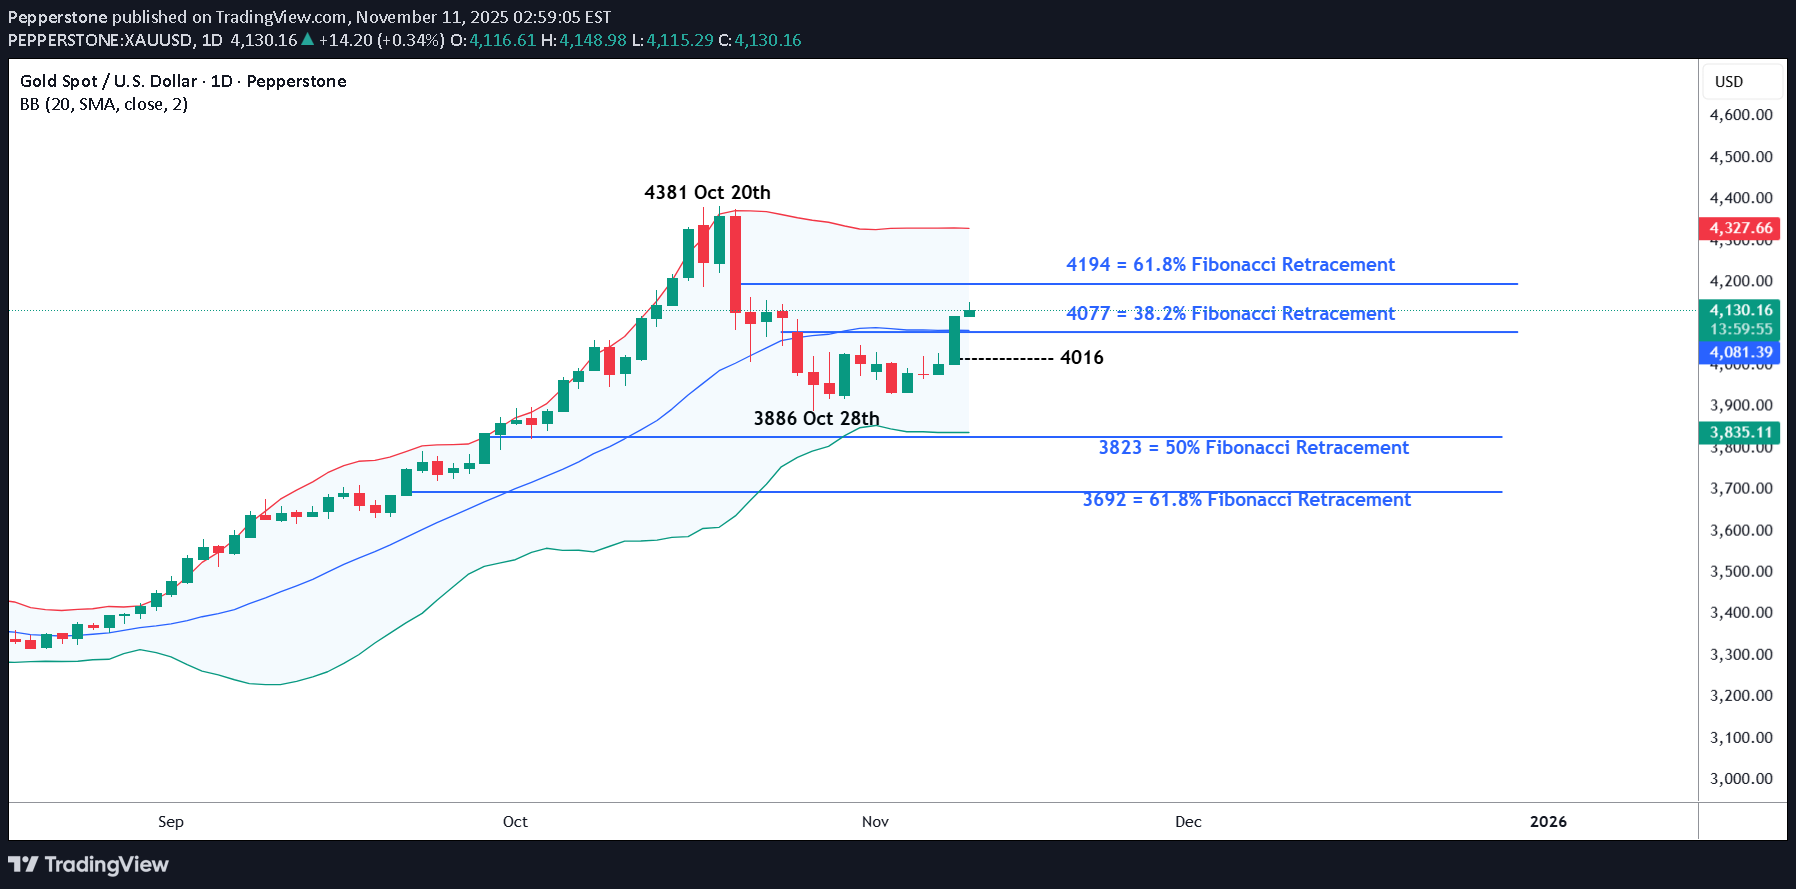
It was interesting to see that weekend progress between Democrat and Republican lawmakers on bringing an end to the longest running federal government shutdown in US history led to a 2.6% surge in Gold, from opening levels around 4000 on Monday up to a 2 week highs of 4116, a move that has extended this morning to print a high at 4149. Traders chose to focus on the potential clarity the move could bring to the Federal Reserve’s (Fed) current interest rate outlook, rather than cutting back on their Gold exposure being held a safe haven hedge against the economic uncertainty and potential damage the long-lasting shutdown was inflicting on the US economy. It is hoped that a reopening of the US government could restore the economic data flow providing updates on the health of the US labour market and direction of inflation in time to influence the decision making of Fed policymakers ahead of their final rate decision of the year on December 10th. The current market pricing of roughly a 65% chance of a further 25bps rate cut at this meeting has helped support Gold’s move higher, as a non-interest-bearing asset. Progress on ending the shutdown seems to be speeding up with the Senate voting to approve a spending package that keeps most of the government open until the end of January, and some departments open until the end of September. The bill now moves to the House of Representatives for approval before being sent to President Trump for his signature. Two potential stumbling blocks that may add further volatility to Gold prices across the remainder of the week. The technical outlook could also be influential after yesterday’s close above resistance at 4077, the 38.2% retracement of the October price decline. Gold Technical Update: Signs of Upside Resumption? Following the price drop into the 3886 October 28th low, Gold entered a phase of more balanced price action, with sideways consolidation dominating recent sessions. This suggested a pause in directional momentum as traders assessed whether the decline had run its course or if further price weakness might resume. However, following the weekend news of a potential US government re-opening, fresh support emerged on Monday. As a result, Gold has now rallied over 6.7% from the October 28th low (3886), marking a notable recovery from the recent weakness. Traders may now be focused on Monday’s closing break back above resistance at 4077, a level equal to the 38.2% Fibonacci retracement of the October weakness. While not a guarantee of further price strength, this move may lead to a phase of recovery. Therefore, it could be useful to gauge support and resistance levels after the latest price activity for possible clues to the next directional themes. Potential Resistance Levels: While future price action will ultimately dictate where Gold moves next, the recent close above 4077 may suggest further upside in price. This could raise the prospect of a test of 4194, the higher 61.8% retracement level of October’s decline. The 61.8% retracement level at 4194 is potentially a strong barrier to price strength, and if tested Gold may face sterner resistance here. However, a closing break above this level could open scope for deeper upside moves toward 4381, the October 20th extreme. Potential Support Levels: After the speed of yesterday’s up move, the first potential support for traders to monitor could be at 4016, a level marking half of the recent rally from the lows at 3886 (October 27th low). A pullback to this level could be a routine reaction to recent strength, however but closes below this level might signal renewed downside pressure. While not a definitive signal of renewed weakness, a close below 4016 could open the door to retest 3886, the October 28th low and potentially even 3823, a level equal to the 50% Fibonacci retracement of the August to October advance.
Pepperstone
شاخص US 500: آیا پایان تعطیلی دولت، اخبار خوب را تمام کرد؟
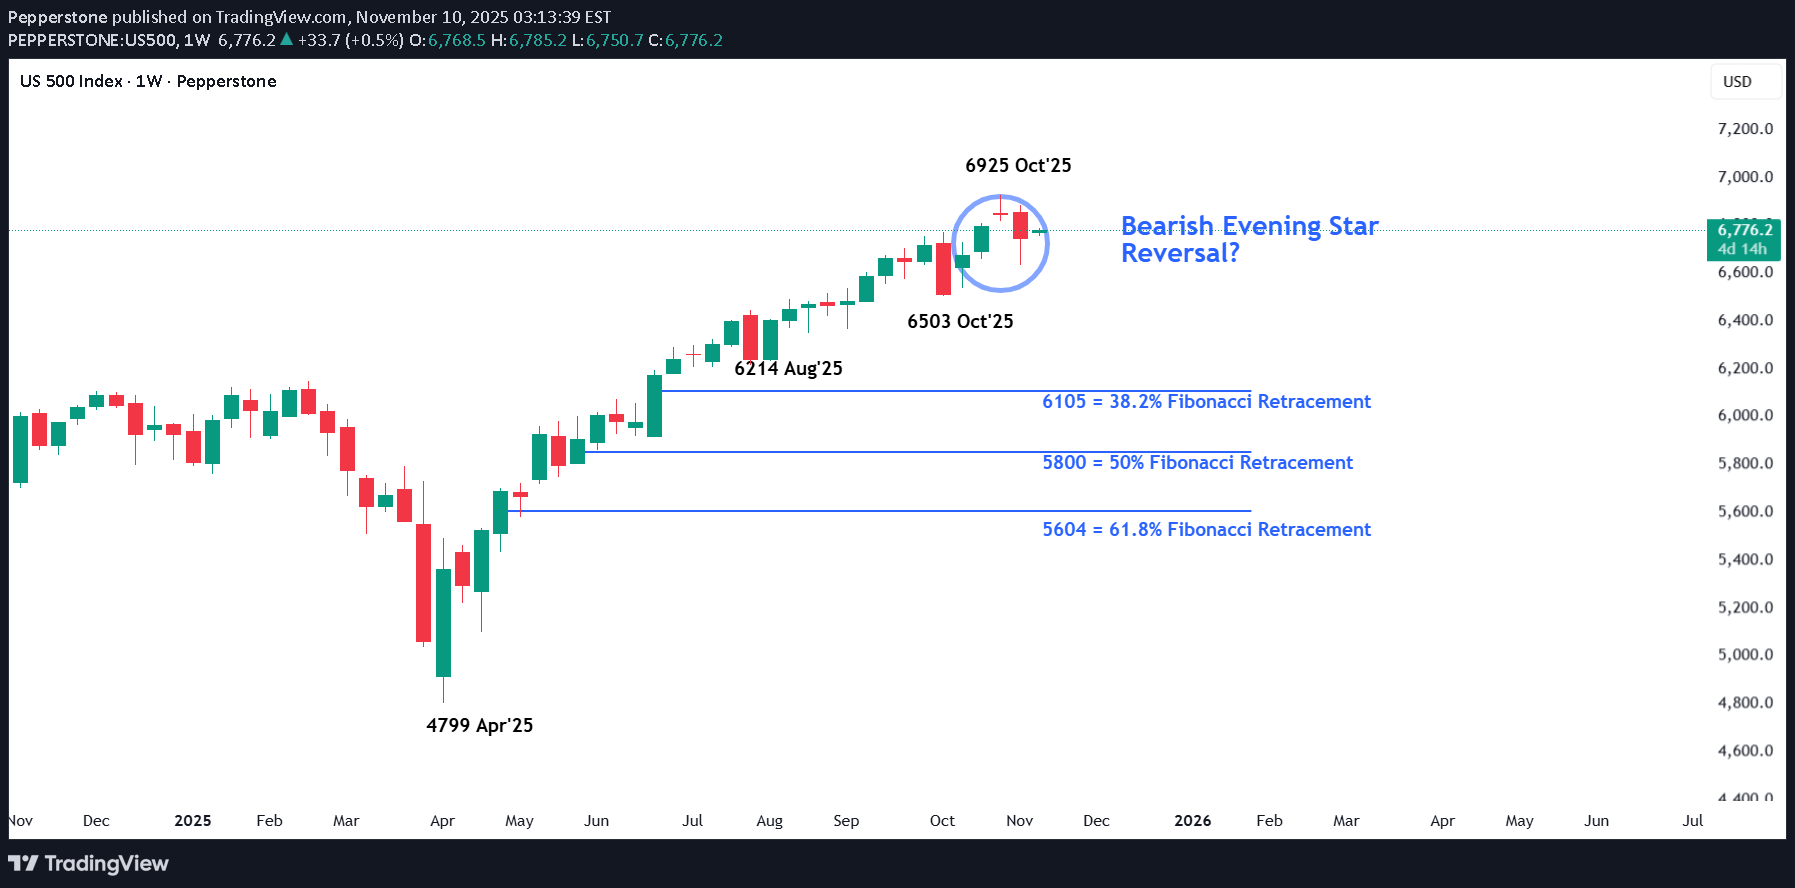
After a volatile and nervy 5 days for US stock indices the week ended on a slightly more stable and positive footing. In relation to the US 500 index this volatility saw it open on Monday November 3rd around 6885, trade down to a low of 6633 early on Friday November 7th, before rallying by over 1% late in the session to close the week at 6742. The driver for the rally was news that Democrats and Republican lawmakers had restarted negotiations to try and resolve what has become the longest US government shutdown in history. This shutdown has been reported by Bloomberg to be costing the US economy around $15 billion per week in lost productivity and has stopped the release of key US economic data readings, leaving Federal Reserve (Fed) policymakers in the dark regarding the health of the US labour market (Non-farm Payrolls) and the direction of inflation (CPI/PPI/PCE). Two areas which are crucial in helping them decide whether they have room, or the need to cut interest rates again at their next meeting in December. Perhaps unsurprisingly, after a jittery week where the lofty valuations of AI firms were called into question and weighed on the price of the US 500 index, traders may now be looking at whether a resolution to the shutdown, which would restart the economic data flow again ahead of the Fed’s next rate decision on December 10th could be possible, bringing with it a potentially much needed boost to flagging sentiment. On Sunday, traders received the news that the Senate had moved closer to an agreement, an update which has helped the US 500 to register an early gain of 0.5% (6790 at 0700 GMT) to start this new trading week. However, even if the agreed bill is eventually passed by the Senate, it must be approved by the House of Representatives and signed by President Trump (Reuters), meaning there could be more volatility ahead for the US 500. Technical Update: Conflicting Signals Within Weekly & Daily Perspectives Since the October 30th all-time high at 6925, the US 500 index has slipped just over 4.2%, reflecting an unwind of potentially over-extended upside conditions. Looking at the charts there appears to be conflicting technical signals between the weekly and daily perspectives at present, leaving the directional bias uncertain heading into the new week. Upcoming sessions could offer clarity on whether the constructive themes emerging on the daily chart or the possibly negative developments evident in the weekly view may take control. Weekly Chart – Potential Negative Outlook?: Over the past three weeks, a possible Evening Star pattern has emerged on the weekly chart, a potentially negative development. Last week’s price weakness may have completed a sentiment shift, and if downside momentum builds, it could lead to further declines in the sessions ahead. It remains to be seen whether this leads to further price weakness, but downside pressure may now build. If developed further, breaks below support at 6503, the October 2025 low could materialise, opening the door to a deeper phase of weakness toward 6214, a level equal to the August 2025 low, potentially even 6105, the 38.2% Fibonacci retracement of the April to October 2025 rally. Daily Chart – Potential Positive Sentiment Shift?: Following the recent sharp price decline, the daily chart presents a dilemma for traders, especially against the backdrop of a potentially negative weekly setup. Friday’s session initially extended recent downside moves but found support at 6647, the 38.2% Fibonacci retracement of the April to October rally. From there, fresh strength emerged, and the session closed near its opening level at the upper end of the day’s range. Candlestick analysis suggests a potentially positive Dragonfly Doji has formed, hinting at an attempt to resume price strength. Confirmation is key, a positive candle on Monday, seen with a close above todays 6769 opening level, would offer weight to this pattern. While not a guarantee of further upside, such activity might also see a close above resistance at 6779 (half the latest decline) a level at present being tested (0700 GMT), to potentially suggest a retest of 6925, the October 30th high. Initially it is unclear whether the weekly or daily outlook will gain the upper hand in the US 500 index, but next week’s price action, especially the moves on Monday, could be important. With the weekly chart hinting at a negative reversal risk and the daily chart showing signs of potential stabilisation, even possible positive risks, Monday’s candle direction may offer clues, and traders may be watching closely for evidence of the next directional themes. The material provided here has not been prepared accordance with legal requirements designed to promote the independence of investment research and as such is considered to be a marketing communication. Whilst it is not subject to any prohibition on dealing ahead of the dissemination of investment research, we will not seek to take any advantage before providing it to our clients. Pepperstone doesn’t represent that the material provided here is accurate, current or complete, and therefore shouldn’t be relied upon as such. The information, whether from a third party or not, isn’t to be considered as a recommendation; or an offer to buy or sell; or the solicitation of an offer to buy or sell any security, financial product or instrument; or to participate in any particular trading strategy. It does not take into account readers’ financial situation or investment objectives. We advise any readers of this content to seek their own advice. Without the approval of Pepperstone, reproduction or redistribution of this information isn’t permitted.
Pepperstone
بیت کوین در آستانه سقوط عمیقتر؟ تحلیل تکنیکال حمایتها و مقاومتها
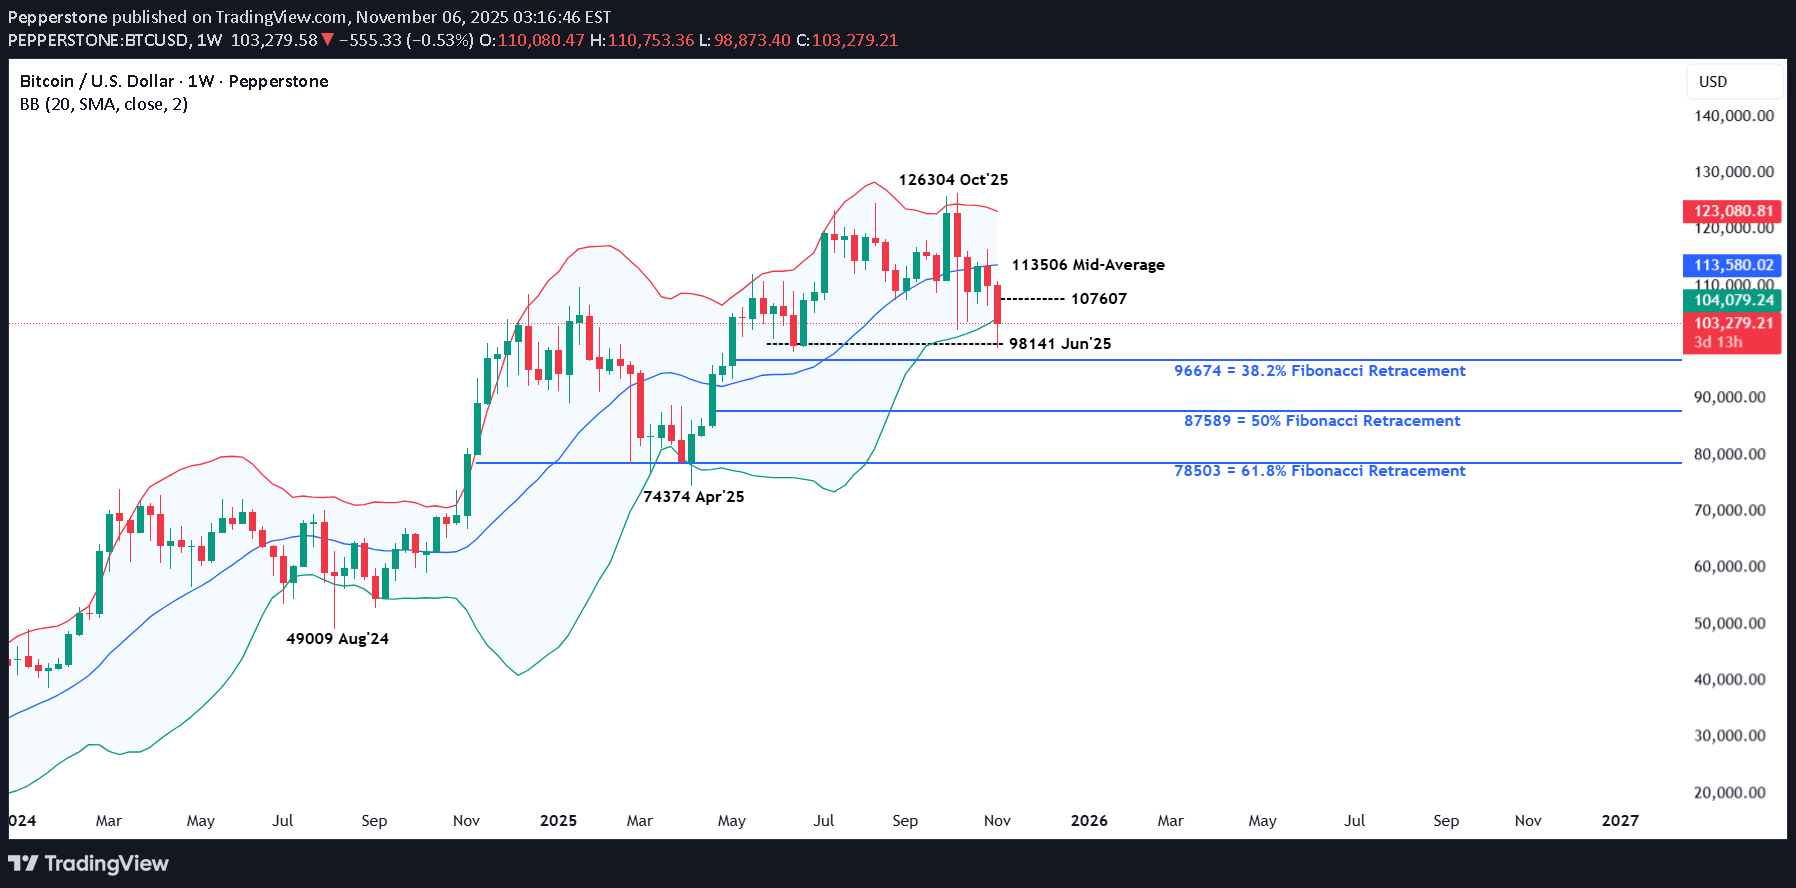
Bitcoin and the wider cryptocurrency market have not been immune to the risk aversion running through financial markets this week as traders reassess whether high valuations and excessive positioning across a range of assets is still valid or is due for an adjustment. This reassessment of pricing has seen Bitcoin trade from its highs from October 6th above 126000 down to a low of 98873 only yesterday, that is a drop of 21.7%. Now of course, the world’s no.1 cryptocurrency can be prone to periods of short-term volatility, however what may be concerning traders this time around is that the reasons for the drop have not been attributed to speculators, or excessive leverage, but long-term holders of more than 6 months liquidating their positions. If true, that could add weight to the theory that the current high of 126304 may remain in place for a prolonged period unless fresh buying interest can quickly return to the market. When these types of situations arise in a popular asset it is often useful to move back to the charts to check the current technical trends to see if they support a potential direction change. Once that initial assessment is complete, the next stage is to look to identify potential key support or resistance. These are the levels that could have a directional impact on Bitcoin moving forward, depending on whether they hold further selling interest, cap buying interest or are broken on a closing basis to indicate that a bigger directional move may be in play. Below is the current technical assessment of Bitcoin. Technical Update: Bitcoin Wipes Out Summer Gains October and early November have so far been challenging for Bitcoin, with its price falling 21.7% from the October 6th all-time high of 126304 to yesterday’s low of 98873. This decline has effectively retraced 100% of the price strength built up since the June lows and may see traders watching for signs of stabilisation or further price weakness. Corrections of this speed and magnitude are not uncommon in crypto, and traders will now be weighing whether the latest decline is another limited pullback within a longer-term uptrend, or an early sign of a broader sentiment shift. Perhaps the technical picture can offer clues as to the next directional themes… Possible Support Levels: Much will continue to depend on how future price trends evolve but traders may now be viewing the recent Bitcoin decline as a correction toward a potential support zone at 96674/98141. This area is equal to the 38.2% Fibonacci retracement of the August 2024 to October 2025 rally and the June 2025 monthly low, potentially making it a key focal point for signs of stabilisation or further downside risk. This 96674/98141 support band now may be watched on a closing basis and classed as a possible pivot to current price activity. While not a guarantee of further price weakness, closes below 96674 might suggest a deeper retracement is possible towards 87589, which is the 50% retracement, even 78503, a level equal to the deeper 61.8% level. Potential Resistance Levels: While the 96674/98141 support band continues to limit the current price weakness, it’s possible a reactive recovery is on the cards, especially after the latest 21.7% decline. Traders may now be focusing on 105585, a level equal to the 38.2% Fibonacci retracement of October 27th to November 5th weakness. If tested, how this level is defended on a closing basis may offer clues to whether further price strength may be on the cards. If closing breaks above 105585 were to emerge in upcoming sessions this could renew attempts to push to higher levels. Such moves if seen, might then open possibilities to 107607, which is the 50% retracement, even 109775, which is equal to the higher 61.8% level. The material provided here has not been prepared accordance with legal requirements designed to promote the independence of investment research and as such is considered to be a marketing communication. Whilst it is not subject to any prohibition on dealing ahead of the dissemination of investment research, we will not seek to take any advantage before providing it to our clients. Pepperstone doesn’t represent that the material provided here is accurate, current or complete, and therefore shouldn’t be relied upon as such. The information, whether from a third party or not, isn’t to be considered as a recommendation; or an offer to buy or sell; or the solicitation of an offer to buy or sell any security, financial product or instrument; or to participate in any particular trading strategy. It does not take into account readers’ financial situation or investment objectives. We advise any readers of this content to seek their own advice. Without the approval of Pepperstone, reproduction or redistribution of this information isn’t permitted.
Pepperstone
خبرهای خوب بازار سهام آمریکا تمام شده است؟ تحلیل US 500
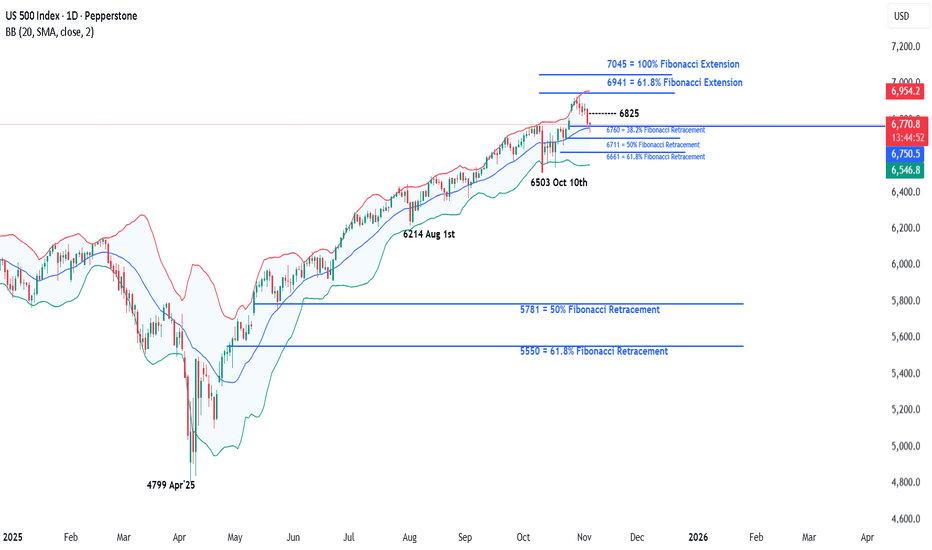
Concerns about excessive stock market valuations, especially when talking about AI focused companies, isn’t something new. In fact, it has been an on-going theme over the last 6 months of the year leading to bouts of risk aversion. This was again the case late on Monday evening, and throughout the day yesterday when the earnings of Palantir Technologies were in the spotlight. The strange thing was that the earnings from this company, released after the close on Monday, beat analysts’ expectations, however a lack of clarity on future revenue needed to justify a market capitalisation of over $600 billion was what brought the latest concerns of an AI bubble back to the attention of traders, leading to a negative sentiment shift for the wider sector and the US 500 index in general. Now, this may or may not be the start of a wider correction and much will depend on future risk events, price action and technical trends (more on this below), however the question for traders this time around is whether the positive news flow for US indices in the short term has already been priced? After all the US 500 index only hit a new record of 6925 on October 30th, 5 days ago. November and December are historically strong performance months for the US 500, however currently traders are faced with several issues to navigate. Only a week ago the Federal Reserve cast some doubt over whether a rate cut in December would happen or not, with policymakers maintaining this stance in their comments at various events since then. This wasn’t expected and has led to some disappointment for traders which weighed on US 500 sentiment. Q3 earnings have generally beaten expectations but then valuations were already high to reflect this, leading to some potential fatigue. Trade tensions between the US-China have cooled, but concerns still remain about economic growth in both countries, especially in the US, where a US government shutdown has led to the delay of key data releases such as CPI, retail sales and the all-important Non-farm Payrolls update on the current health of the US labour market, a key factor influencing the decision making of the Fed on potential interest rate cuts. This means the release of today’s US ADP Private Payrolls data at 1315 GMT and the US ISM Services PMI survey at 1500 GMT could have a bigger influence over the direction of the US 500 moving across the week. Technical levels and trends may also become increasingly important. Technical Update: Back to Fibonacci Retracement Support After reaching a new all-time high of 6925 on October 30th, the US 500 index has corrected by 2.9%, easing short-term overextended upside conditions. This pullback may reflect a healthy pause within a broader uptrend, but the question now appears to be whether this marks the extent of corrective downside moves or is the beginning of a phase of further price weakness. As the chart below shows, latest declines in the US 500 index have now returned to a potential support zone at 6750/6760, marking the 38.2% Fibonacci retracement of the October 10th to 30th rally and the current level of the Bollinger mid-average. This possible support band may limit current declines, but closing behaviour around this area could be important in determining whether buyers can regain the upper hand or if deeper corrective risks can emerge. Traders could now be watching this 6750/6760 support closely, as closing break below might see increased downside pressure. Such moves could then mean focus shifts to 6711, even 6661, marking the deeper 50% and 61.8% Fibonacci retracement levels. That said, while the support is currently under pressure, the 6750/6760 range still holds on a closing basis and may help limit further selling pressure, even possibly see renewed attempts at price upside. However, traders may also now be monitoring 6825, equal to half the recent price decline, as a resistance level in the sessions ahead. If momentum is to shift back toward attempts to renew price strength, a closing break above 6825 may be required to suggest scope to retest the 6925 October 30th all-time high. The material provided here has not been prepared accordance with legal requirements designed to promote the independence of investment research and as such is considered to be a marketing communication. Whilst it is not subject to any prohibition on dealing ahead of the dissemination of investment research, we will not seek to take any advantage before providing it to our clients. Pepperstone doesn’t represent that the material provided here is accurate, current or complete, and therefore shouldn’t be relied upon as such. The information, whether from a third party or not, isn’t to be considered as a recommendation; or an offer to buy or sell; or the solicitation of an offer to buy or sell any security, financial product or instrument; or to participate in any particular trading strategy. It does not take into account readers’ financial situation or investment objectives. We advise any readers of this content to seek their own advice. Without the approval of Pepperstone, reproduction or redistribution of this information isn’t permitted.
Pepperstone
طلا در آستانه ۴۰۰۰ دلار: مسیر بعدی صعود یا سقوط؟ (تحلیل تکنیکال)
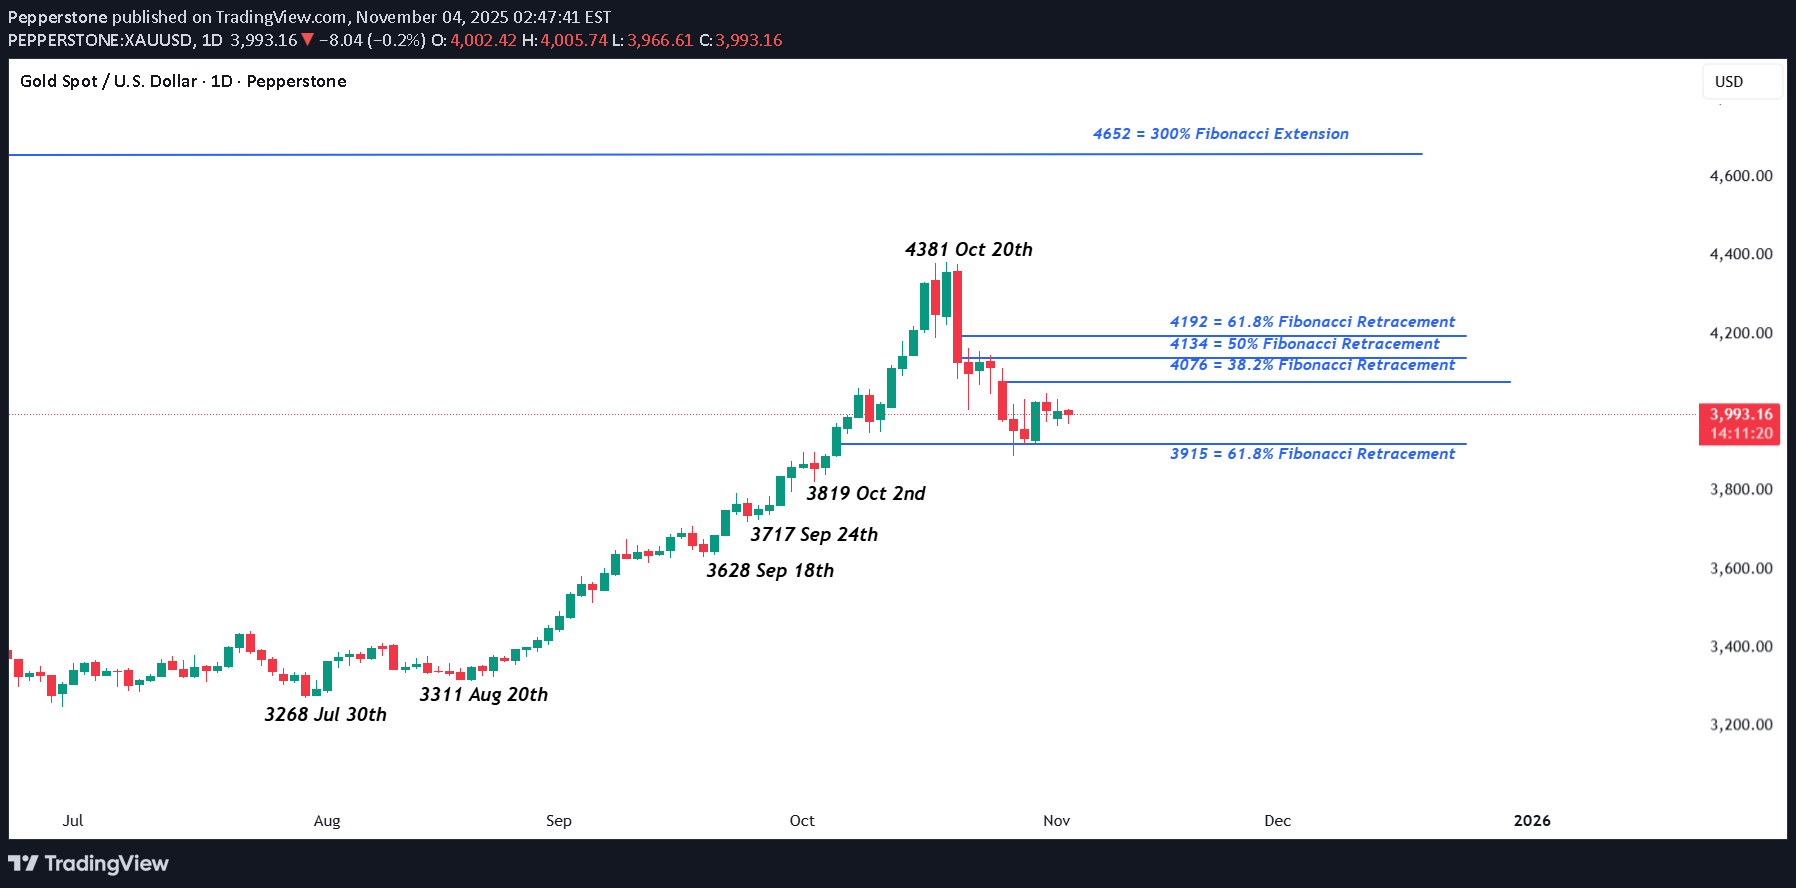
Gold prices may have stabilised after their sharp correction from an all-time high at 4381 on October 20th to a low of 3887 on October 28th, however traders still bear the scars from that excessive and volatile move which has left the popular metal dancing in a 3% range either side of 4000. Judging where Gold prices may move next has become more challenging with Federal Reserve policymakers trying to cool market expectations of a further interest rate cut at their next meeting in December. As a general rule, lower interest rates can help support Gold prices as it is a non-yielding asset. Not only that, but this changing outlook from the Fed has also seen the US dollar move up to its highest level for 3 months, which has further weighed on Gold prices, as it makes the safe haven asset, which is priced in dollars, more expensive to global investors. However, many of the drivers that attracted traders to add Gold to their portfolios remain, such as geo-political risks in Ukraine, credit risk and uncertainty regarding the direction of global economic growth. In this type of environment paying attention to the technical outlook can be just as important as staying appraised of macro headline risk. Technical Update: Does 3915 Mark the Extent of Corrective Moves? Gold has corrected over 11.25% from its October 20th all-time high into last Tuesday’s October 28th session low, unwinding the possible over-extended upside conditions that built during the sharp August 20th to October 20th price advance. The key dilemma for traders now is whether the recent weakness marks a healthy market correction or suggests a deeper shift in sentiment. If it’s the former, we could see renewed buying interest and a resumption of the broader uptrend. However, if it’s the latter, risks may lead to a further phase of price weakness. While the next directional theme for Gold remains uncertain, technical analysis can offer potential clues. By identifying key support and resistance levels, traders can anticipate where directional risks may emerge, especially if those levels break on a closing basis. A breach of support may signal deeper corrective risk, while a close above resistance could resume positive momentum. Potential Resistance Levels: Gold’s 11.25% decline from the October 20th high appears to have found support at 3,915, the 61.8% Fibonacci retracement of the September 18th to October 20th advance. Price action has since stabilised around this level, suggesting potential for attempts to renew upside. Traders may now shift focus to key resistance levels, with closing breaks above those levels needed to indicate further price strength. With upside developing following tests of the 3915-retracement support, traders could now be monitoring the 4076 level, which is the 38.2% Fibonacci retracement of the October price weakness. Successful closing breaks above 4076 could result in tests of 4134, the 50% level, even 4192, the higher 61.8% retracement. Potential Support Levels: As suggested above, with the latest phase of price weakness being held by the 3915 retracement levels, traders will likely be monitoring this as the first possible support. Closing breaks under this level could be a catalyst for continued price declines. Such moves while not a guarantee of a phase of further price weakness, could open tests of 3819, the October 2nd session low, even 3717, which is the September 24th downside extreme. The material provided here has not been prepared accordance with legal requirements designed to promote the independence of investment research and as such is considered to be a marketing communication. Whilst it is not subject to any prohibition on dealing ahead of the dissemination of investment research, we will not seek to take any advantage before providing it to our clients. Pepperstone doesn’t represent that the material provided here is accurate, current or complete, and therefore shouldn’t be relied upon as such. The information, whether from a third party or not, isn’t to be considered as a recommendation; or an offer to buy or sell; or the solicitation of an offer to buy or sell any security, financial product or instrument; or to participate in any particular trading strategy. It does not take into account readers’ financial situation or investment objectives. We advise any readers of this content to seek their own advice. Without the approval of Pepperstone, reproduction or redistribution of this information isn’t permitted.
Pepperstone
انفجار ارزش انویدیا به ۵ تریلیون دلار: جهش تاریخی و مسیر بعدی سهام غول هوش مصنوعی
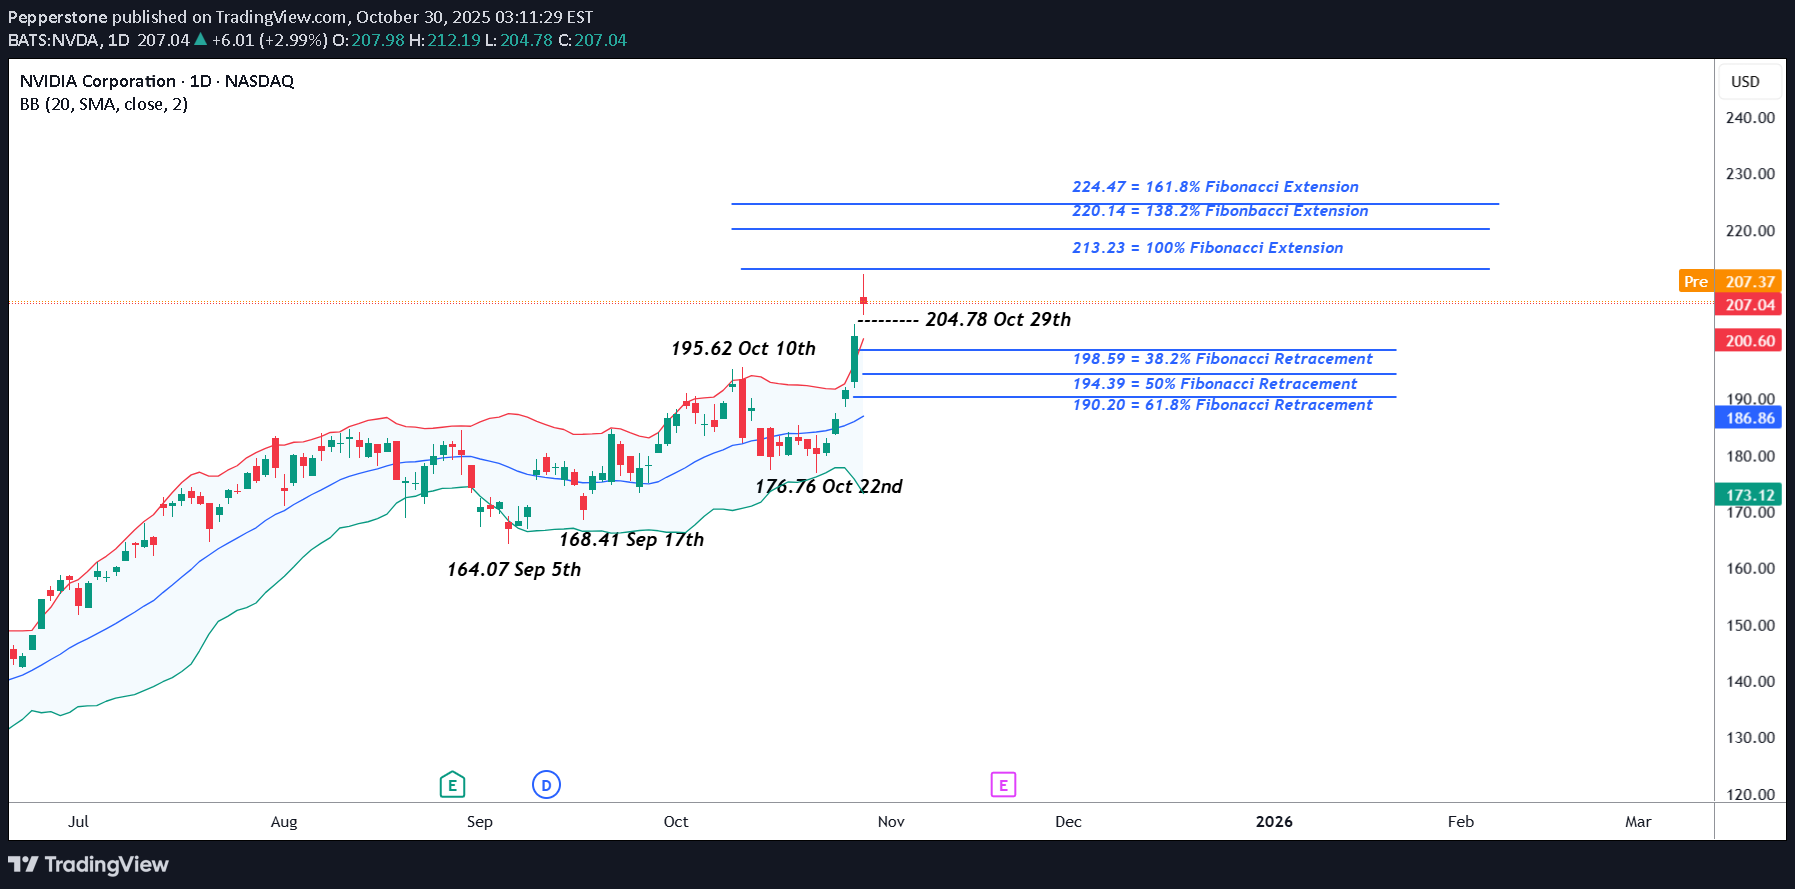
A mere 24 hours after Apple become the third company in history to reach a $4 trillion valuation, NVIDIA set a new benchmark by becoming the first company ever to register a market capitalisation of $5 trillion. Despite concerns about over extended valuations, the news flow for NVIDIA was initially positive to start this new week as the company attempts to solidify its future at the centre of the potential AI revolution. CEO Jensen Huang revealed the company had received $500 billion of AI chip orders, including contracts to build supercomputers for the US government and then President Trump commented on Wednesday that NVIDIA’s latest Blackwell chips could be a discussion point when he meets with President Xi at Thursday’s summit in South Korea. Putting this into numbers, after opening on Monday at 189.25, the stock soared 12% across the first 3 trading days to a high of 212.19 on Wednesday. That move brought its year-to-date rally to 54%, very impressive indeed! Although, it must be said that prices did slip back to close the day at 207.04. However, overnight the positive sentiment may have stalled slightly, the Federal Reserve cut interest rates 25bps as expected but Chairman Powell provided a more cautious outlook on future cuts than had been anticipated. Also, earnings from Alphabet, Microsoft and Meta released late on Wednesday were mixed, with strong profits offset by rising costs. Looking forward, the initial updates from the President Trump and President Xi meeting has started to arrive on newswires and traders will be keen to assess the actual details of what was discussed about NVIDIA chip sales between the two countries. A crucial aspect could be whether sales of NVIDIA’s latest Blackwell chip was discussed and if not, what were the reasons why. Then it’s eyes down for the release of Amazon and Apple earnings after the close tonight which could either confirm the recent bullish moves or throw a sentiment curve ball which could negatively impact in positioning into the weekend. Technical Update: Acceleration Higher Shifts Focus to Extension Resistance In just six trading sessions, NVIDIA's share price has rallied over 20%, reaching fresh all-time highs. Such a rapid acceleration can often signal strong momentum but also raises the risk of short-term upside exhaustion, although it's difficult to pinpoint where such moves might slow or even see risks of possible reversal. In this environment, traders might monitor support and resistance levels, with resistance zones signalling potential for profit-taking, while breaks below support could lead to further price weakness. [b Potential Resistance Levels: As price action pushes into uncharted territory with new all-time highs, identifying resistance becomes a challenge. However, traders often turn to Fibonacci extension levels, derived from the most recent correction, to highlight potential areas where upside momentum may slow or even reverse. As the chart above shows, for NVIDIA, this last correction developed between October 10th and October 22nd and the latest strength appears to be stalling in the short term ahead of 213.23, a level equal to the 100% Fibonacci extension. There is no guarantee such extension levels will be successful in capping price strength and closing breaks above the 213.23 resistance may shift focus to 220.14, which is the higher 138.2% extension level. Potential Support Levels: To maintain NVIDIA’s current price strength, traders may now be focused on Wednesday’s low at 204.78 as near-term support; if price weakness tests this level, its defense will be watched, as a closing break below 204.78 could trigger further downside pressure. A close below 204.78 could lead to tests of 198.59, the 38.2% Fibonacci retracement of the October 22nd to 29th rally, but if that support gives way, risks may extend toward 194.39, the deeper 50% retracement level. The material provided here has not been prepared accordance with legal requirements designed to promote the independence of investment research and as such is considered to be a marketing communication. Whilst it is not subject to any prohibition on dealing ahead of the dissemination of investment research, we will not seek to take any advantage before providing it to our clients. Pepperstone doesn’t represent that the material provided here is accurate, current or complete, and therefore shouldn’t be relied upon as such. The information, whether from a third party or not, isn’t to be considered as a recommendation; or an offer to buy or sell; or the solicitation of an offer to buy or sell any security, financial product or instrument; or to participate in any particular trading strategy. It does not take into account readers’ financial situation or investment objectives. We advise any readers of this content to seek their own advice. Without the approval of Pepperstone, reproduction or redistribution of this information isn’t permitted.
Pepperstone
نوسانات طلا تمام شد؟ تحلیل کلیدی حمایت و مقاومت برای هفته آینده
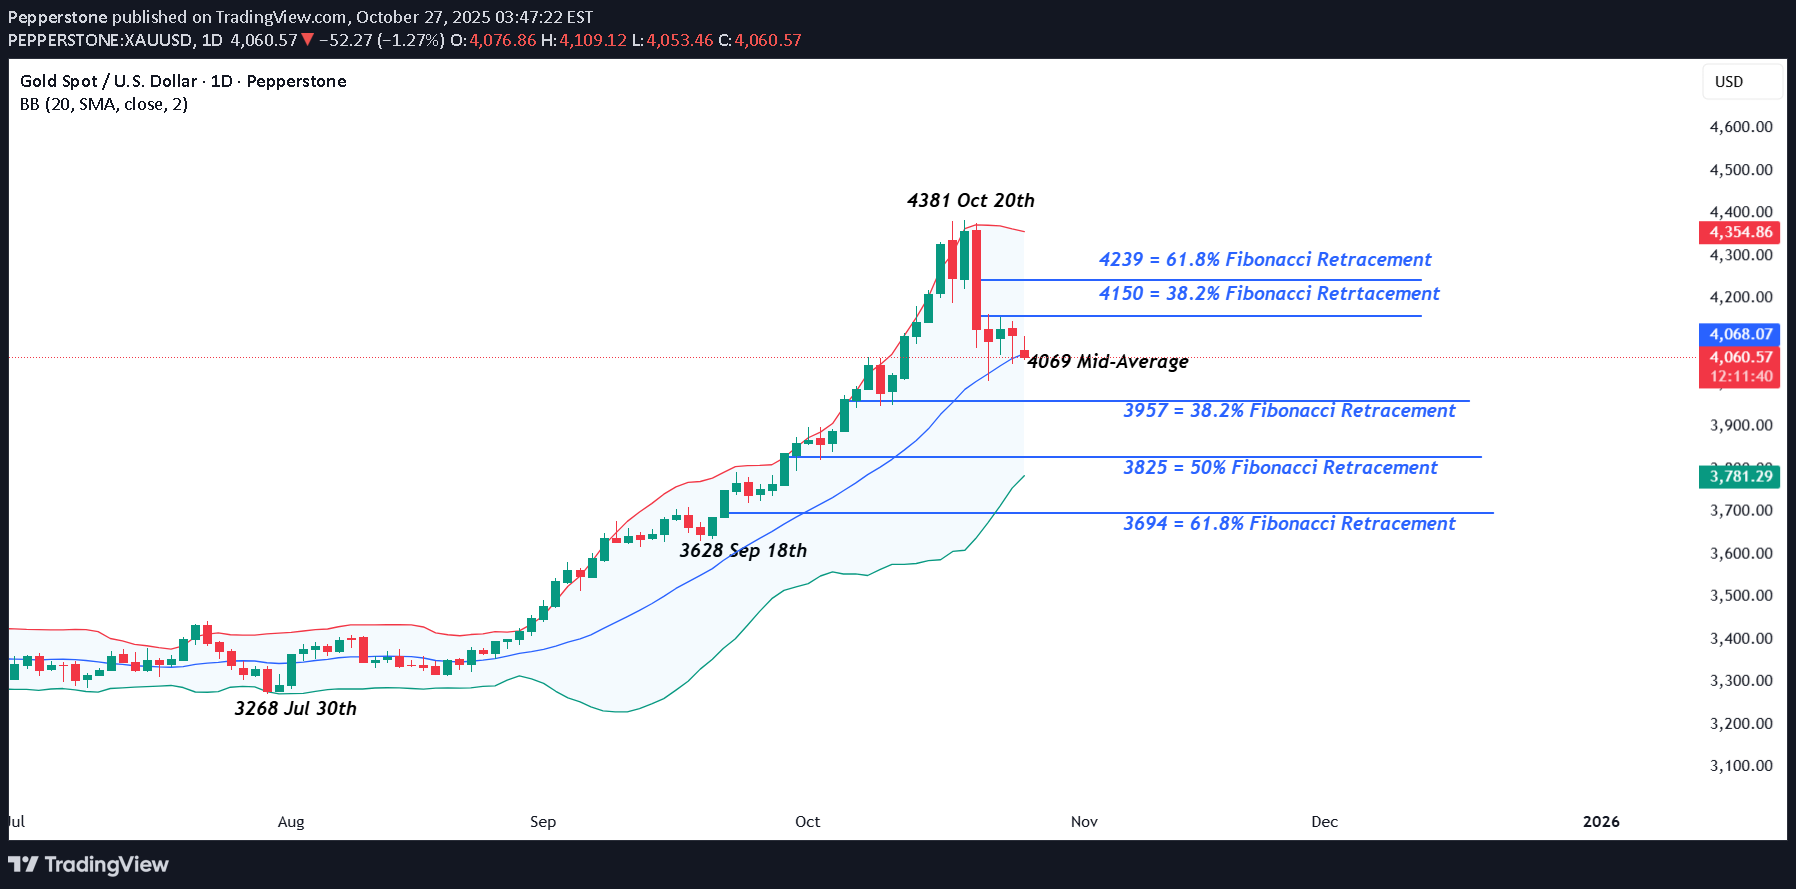
Gold volatility hit new heights last week when a push from opening levels at 4243 on Monday (Oct 20th) up to a new record high of 4381 was immediately followed on Tuesday (Oct 21st) by a crash back to lows at 4004 as traders were forced to liquidate weak long positions after key short term technical support levels gave way. If price moves last week were dominated by positioning, moves in the week ahead could be more events driven providing traders with a lot for to focus on and potentially further excessive volatility to navigate. Weekend news has so far provided positive soundbites on progress towards de-escalating trade tensions between the US and China. President Trump has stated he is confident of a deal after US and Chinese trade representatives concluded a 2-day meeting in Malaysia (Reuters), while US Treasury Secretary Scott Bessant commented that he believes the two negotiating teams have agreed on a successful framework for President Trump and President Xi to discuss when they meet on Thursday (Oct 30th), their first face to face meeting in 6 years. This has already led to a sell-off in Gold prices from Friday’s closing level at 4112 to a low of 4053 this morning. Geo-politics remains in focus as Ukrainian and Russian forces trade drone strikes in Ukraine, while a Kremlin spokesperson said it was too early to talk about the cancellation of a meeting between President’s Putin and Trump, despite the White House’s blacklisting of Russia’s main 2 oil producers, Rosneft and Lukoil last Wednesday complicating the issue. Also on Wednesday evening, the Federal Reserve announce their next interest rate decision at 1800 GMT, with the press conference led by Chairman Jerome Powell commencing at 1830 GMT. While a 25bps (0.25%) rate cut is expected from Fed policymakers, the press conference could be the main volatility driver for Gold prices, as Chairman Powell provides traders with an update on whether a further rate cut is likely in December as anticipated, or if an on-going US government shutdown, which has stopped key US economic growth and labour market data releases, has clouded the issue. Technical trends may also have a significant impact on where Gold moves next. Technical Update: Is the Bollinger Mid-Average Key? Gold’s sharp 8.60% sell-off from the October 20th all-time high at 4381 prompted speculation over a possible sentiment shift that could mean an end to the recent strong advance. However, the rising Bollinger mid-average has so far contained the decline as can be seen on the chart below. This rising Bollinger mid-average, currently at 4069, held the latest Gold decline, suggesting it might be a key support focus again this week. How the Gold price behaves around this level on a closing basis may offer clues to the next directional bias, either marking stabilisation or opening the risk of a deeper phase of weakness. If the Bollinger Mid-Average Holds Price Weakness: If the support at 4069 continues to hold on a closing basis, Gold may see renewed attempts at strength. Traders could then be focused on how potential resistance at 4150, which is the 38% Fibonacci retracement of the latest decline, is defended. While the mid-average support remains intact, a closing break above 4150, could lead to further upside possibilities, shifting focus to 4239, the 61.8% retracement of the recent decline, or even extending toward 4381 the October 20th all-time high again. If the Bollinger Mid-Average Support is Broken: While 4069 has so far contained Gold’s recent selling pressure, it may not hold indefinitely. A closing break below this level might raise the risk of a more extended phase of weakness, opening deeper corrective themes. Closes below 4069 in Gold could shift trader focus to 3957, which is the 38.2% Fibonacci retracement of the July 30th to October 20th rally. If this support gives way, downside risks may in turn extend toward 3825, a level which marks the deeper 50% retracement level. The material provided here has not been prepared accordance with legal requirements designed to promote the independence of investment research and as such is considered to be a marketing communication. Whilst it is not subject to any prohibition on dealing ahead of the dissemination of investment research, we will not seek to take any advantage before providing it to our clients. Pepperstone doesn’t represent that the material provided here is accurate, current or complete, and therefore shouldn’t be relied upon as such. The information, whether from a third party or not, isn’t to be considered as a recommendation; or an offer to buy or sell; or the solicitation of an offer to buy or sell any security, financial product or instrument; or to participate in any particular trading strategy. It does not take into account readers’ financial situation or investment objectives. We advise any readers of this content to seek their own advice. Without the approval of Pepperstone, reproduction or redistribution of this information isn’t permitted.
Disclaimer
Any content and materials included in Sahmeto's website and official communication channels are a compilation of personal opinions and analyses and are not binding. They do not constitute any recommendation for buying, selling, entering or exiting the stock market and cryptocurrency market. Also, all news and analyses included in the website and channels are merely republished information from official and unofficial domestic and foreign sources, and it is obvious that users of the said content are responsible for following up and ensuring the authenticity and accuracy of the materials. Therefore, while disclaiming responsibility, it is declared that the responsibility for any decision-making, action, and potential profit and loss in the capital market and cryptocurrency market lies with the trader.