
Mohammad_Mirdehghan
@t_Mohammad_Mirdehghan

What symbols does the trader recommend buying?
Purchase History
پیام های تریدر
Filter
Mohammad_Mirdehghan
Bitcoin vs Silver (BTC/XAG) – Intermarket Risk Perspective
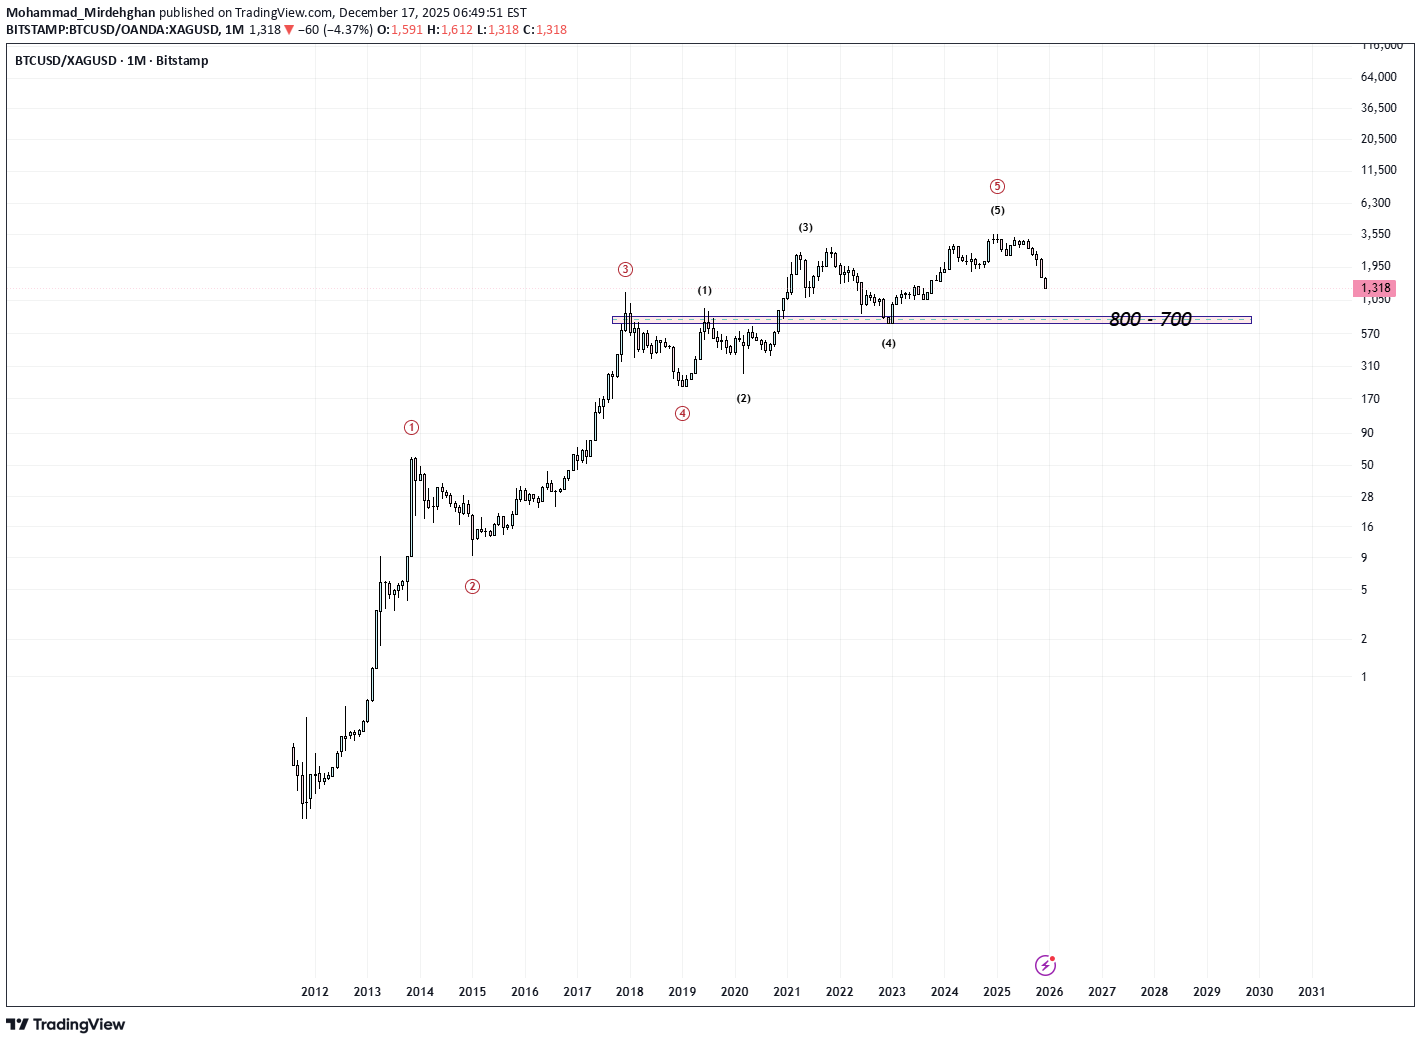
Yes, this is exactly what rising relative risk between two assets looks like. Intermarket analysis allows us to identify where capital is actually flowing, rather than focusing on isolated price movements in a single market. By comparing a high-risk asset to a defensive one, we gain a clearer view of the broader risk regime. The missing link in the current market cycle is this: when precious metals move to the top of the capital hierarchy, ultra-risk assets such as crypto inevitably come under sustained pressure. The Bitcoin-to-Silver ratio visualizes this dynamic remarkably well. The Elliott wave structure appears clean and mature, with the ratio now hovering around a historically significant equilibrium zone (approximately 700–800) — a level that has repeatedly acted as a pivot for capital rotation. This chart is not just a ratio; it is a macro signal of risk appetite. As long as silver and precious metals remain dominant, continued downside pressure on crypto assets is a logical and intermarket-consistent outcome.
Mohammad_Mirdehghan
Head & Shoulders Breakdown in Progress, Eyes on 1.83 and 1.61

XRP is showing a classic Head and Shoulders reversal pattern, which has now broken down below the neckline, indicating a potential bearish continuation. 🔻 Bearish Structure Highlights: The head and shoulders formation is well-defined and price has confirmed a neckline break. The breakout is occurring within a descending channel, aligning with the broader bearish context. Momentum oscillator (DTosc) is also turning down after a lower high, supporting the bearish case. 📉 Targets: First target: 1.83580 Extended target: 1.61184 🔴 Invalidation Zone: A daily close above the right shoulder and key resistance at 2.3589–2.4829 would invalidate this bearish view and signal potential reversal. 📌 Trade Plan: Favoring short setups below the neckline Targeting the support levels noted above Stop-loss suggested above 2.48 for conservative risk control The setup offers a clean risk/reward opportunity based on a textbook bearish reversal pattern.
Mohammad_Mirdehghan
TRUMP/USD – Watching Key Support at 12.45–12.15 for Potential Re

The TRUMP/USD pair is consolidating near the strong horizontal support zone at 12.45–12.15, aligning with the 61.8% Fibonacci retracement of the previous bullish leg. 🔹 Key Levels & Scenario: Support zone: 12.45–12.15 – price has repeatedly tested and held this area Upside targets: 50% retracement at 14.096 78.6% retracement at 15.134 The pair is showing early signs of stabilization, suggesting a potential rebound toward these Fibonacci levels if the support holds. 📉 Invalidation: A decisive daily close below 12.15 would invalidate the bullish bias and open the door for deeper retracement. 📌 Trading Plan: Watching for price action signals (candlestick reversal or breakout) above 12.45 Targets: 14.096 and 15.134 SL: Below 12.15 for a conservative risk management approach This idea focuses on the potential for a short-term reversal in a larger consolidation phase, supported by clear Fibonacci and horizontal confluence.
Mohammad_Mirdehghan
BTC/USD Long-Term Channel Targeting 120,721 – 136,849

Bitcoin continues to trade within a well-defined ascending channel on the weekly timeframe. After a healthy corrective phase, price action is rebounding strongly off the channel’s lower boundary, aligning with the ongoing long-term bullish trend. 🔹 Wave Structure and Fibonacci Extensions: The corrective structure suggests a completed ABC pattern, with the current move potentially initiating a new bullish impulse. Key Fibonacci extension levels: 161.8% at 120,721 200% at 130,246 224% at 136,849 These levels correspond to the upper channel boundary, providing potential long-term upside targets. 🔹 Oscillator Confirmation: The DTOsc indicator is rebounding from oversold territory, suggesting renewed bullish momentum. 📌 Trade Idea: Long-term bias: Bullish, targeting upper Fibonacci levels within the channel Invalidation: A weekly close below the channel’s lower boundary (~85,000) would challenge this scenario This chart supports a patient, long-term bullish view for BTC/USD, with significant upside targets over the coming months.
Mohammad_Mirdehghan
ETH/USD – Key Support Holding, Eyes on 3000 for Upside Target

Ethereum is maintaining a strong bullish structure within a clearly defined ascending channel. Recent price action shows a successful retest of the lower channel boundary and the horizontal support zone around 2477 – 2450. 🔹 Support & Trendline Confluence: The support zone at 2477–2450 is aligned with the lower boundary of the rising channel. Multiple successful retests of this trendline indicate strong demand in this area. 🔹 Bullish Scenario: As long as the 2477–2450 support zone holds, ETH/USD has a good chance to resume its upward move. The next target for bulls is the 161.8% Fibonacci extension level at 2997.24, which coincides with the upper channel boundary. 📌 Plan: Long positions are favored as long as price holds above 2450. Targeting 2997, with intermediate steps of confirming higher lows. 📉 Invalidation: A break and daily close below 2450 would invalidate this bullish scenario and suggest further downside. This is a classic “buy-the-dip” scenario within an established uptrend, offering a favorable risk/reward opportunity.
Mohammad_Mirdehghan
TRX/USDT Breakout Setup – Eyes on 0.298–0.332 Fibonacci Targets

TRON (TRX) is showing a bullish continuation structure within an ascending channel, following a breakout from a falling wedge pattern. Currently, the price is consolidating inside a small bullish pennant, indicating a potential breakout to the upside. If this breakout materializes, it could trigger a rally toward the Fibonacci extension levels. 📌 Key Targets: 0.29849 (200% Extension) 0.31102 – 0.31222 (224% Cluster) 0.33207 (261.8% Extension) 📈 Technical Confluences: Price is trending steadily within an ascending channel Previous breakout from a falling wedge pattern confirms bullish sentiment Higher lows structure remains intact The pennant pattern typically resolves in the direction of the prevailing trend 📉 Invalidation Level: A breakdown below the lower trendline and 0.258 support would invalidate the bullish scenario. This chart setup offers a favorable risk/reward opportunity if the breakout is confirmed with strong volume.
Mohammad_Mirdehghan
BTC/USD Facing Key Resistance – Watch for Daily Close Confirmati

Bitcoin is currently testing a critical resistance zone between 107,150 and 107,800, which has previously acted as a strong supply area. For the bullish trend to continue, we need to see a daily close above this resistance range. Until a confirmed breakout occurs, the price is vulnerable to a pullback toward the rising trendline, which has been supporting the uptrend since April. 📌 Key Points: Strong horizontal resistance at 107,150–107,800 Rising wedge structure could signal exhaustion A daily candle close above 107,800 is required for further upside continuation Failure to break this resistance increases the probability of a correction toward the ascending trendline support This is a critical area to monitor for both breakout traders and those looking for potential short-term reversal setups.
Mohammad_Mirdehghan
Bullish AB=CD Pattern on XAUUSD – PRZ at 3142–3172

This chart shows a clear Bullish AB=CD pattern forming on the daily timeframe of XAUUSD (Gold Spot). In this setup: The CD leg equals AB in both length and time symmetry, forming a classic AB=CD structure. The pattern completes in the Potential Reversal Zone (PRZ) between 3142 and 3172, where: The CD leg extends to 113% of AB at 3172.58 A confluence of Fibonacci projections (including 200% extension of BC) enhances the significance of 3142.23 The price reacted from the PRZ, hinting at a potential bullish reversal. 🔹 Key Technical Levels: PRZ (Potential Reversal Zone): 3142 – 3172 AB = CD Completion: Near 3172 200% BC Extension: 3142 🎯 Trade Idea: Entry Zone: Between 3142 – 3172 Stop Loss: Below 3140 (breakdown invalidates the structure) Target 1: 3311 (61.8% retracement of CD) Target 2: 3365 (78.6% retracement of CD) 📌 Conclusion: The AB=CD pattern is a powerful harmonic structure, especially when accompanied by Fibonacci confluence. As long as price holds above the PRZ, a bullish move toward 3311 and 3365 remains likely. A break below 3140 would negate this idea.
Mohammad_Mirdehghan
Gold (XAU/USD) – Bullish Breakout Ahead?

🔍 Technical Breakdown: Gold has respected the key demand zone at 2,911 – 2,916, forming a strong base for a potential bullish continuation. The recent correction followed a complex wave pattern, completing an ABCDE structure before bouncing. The price is now moving towards the 161.8% Fibonacci extension at 2,992, a key upside target. 📊 Momentum Indicators: The Stochastic Oscillator is recovering from lower levels, signaling renewed bullish momentum. A break above recent highs could accelerate upside movement toward the psychological $3,000 mark. 🔥 Trading Outlook: Bullish Bias: As long as Gold holds above 2,911, the upside structure remains intact. Upside Target: 2,992 – 3,000 based on Fibonacci confluence. Invalidation: A sustained break below 2,911 could shift momentum bearish. 📢 Are You Bullish on Gold? Comment below & hit Boost if you’re riding this move! 🚀✨ 🔔 Follow for More Precision Trading Insights!
Mohammad_Mirdehghan
Conditions for Continued Heavy Decline in Bitcoin

Following the realization of the previous analysis (attached to this report) , Bitcoin is currently forming a neutral pattern of an expanding type on the 4-hour time frame. If this scenario is in the process of completion, the final wave movement should not break the $89,925-$88,300 level. As long as this level is not breached, a price rebound and support are expected, with minimum targets of $99,000 and $101,000.The price trend is continuing exactly as analyzed.
Disclaimer
Any content and materials included in Sahmeto's website and official communication channels are a compilation of personal opinions and analyses and are not binding. They do not constitute any recommendation for buying, selling, entering or exiting the stock market and cryptocurrency market. Also, all news and analyses included in the website and channels are merely republished information from official and unofficial domestic and foreign sources, and it is obvious that users of the said content are responsible for following up and ensuring the authenticity and accuracy of the materials. Therefore, while disclaiming responsibility, it is declared that the responsibility for any decision-making, action, and potential profit and loss in the capital market and cryptocurrency market lies with the trader.