
MiguelFTCurado
@t_MiguelFTCurado

What symbols does the trader recommend buying?
Purchase History
پیام های تریدر
Filter
MiguelFTCurado
Cardano (ADA) +100% soon
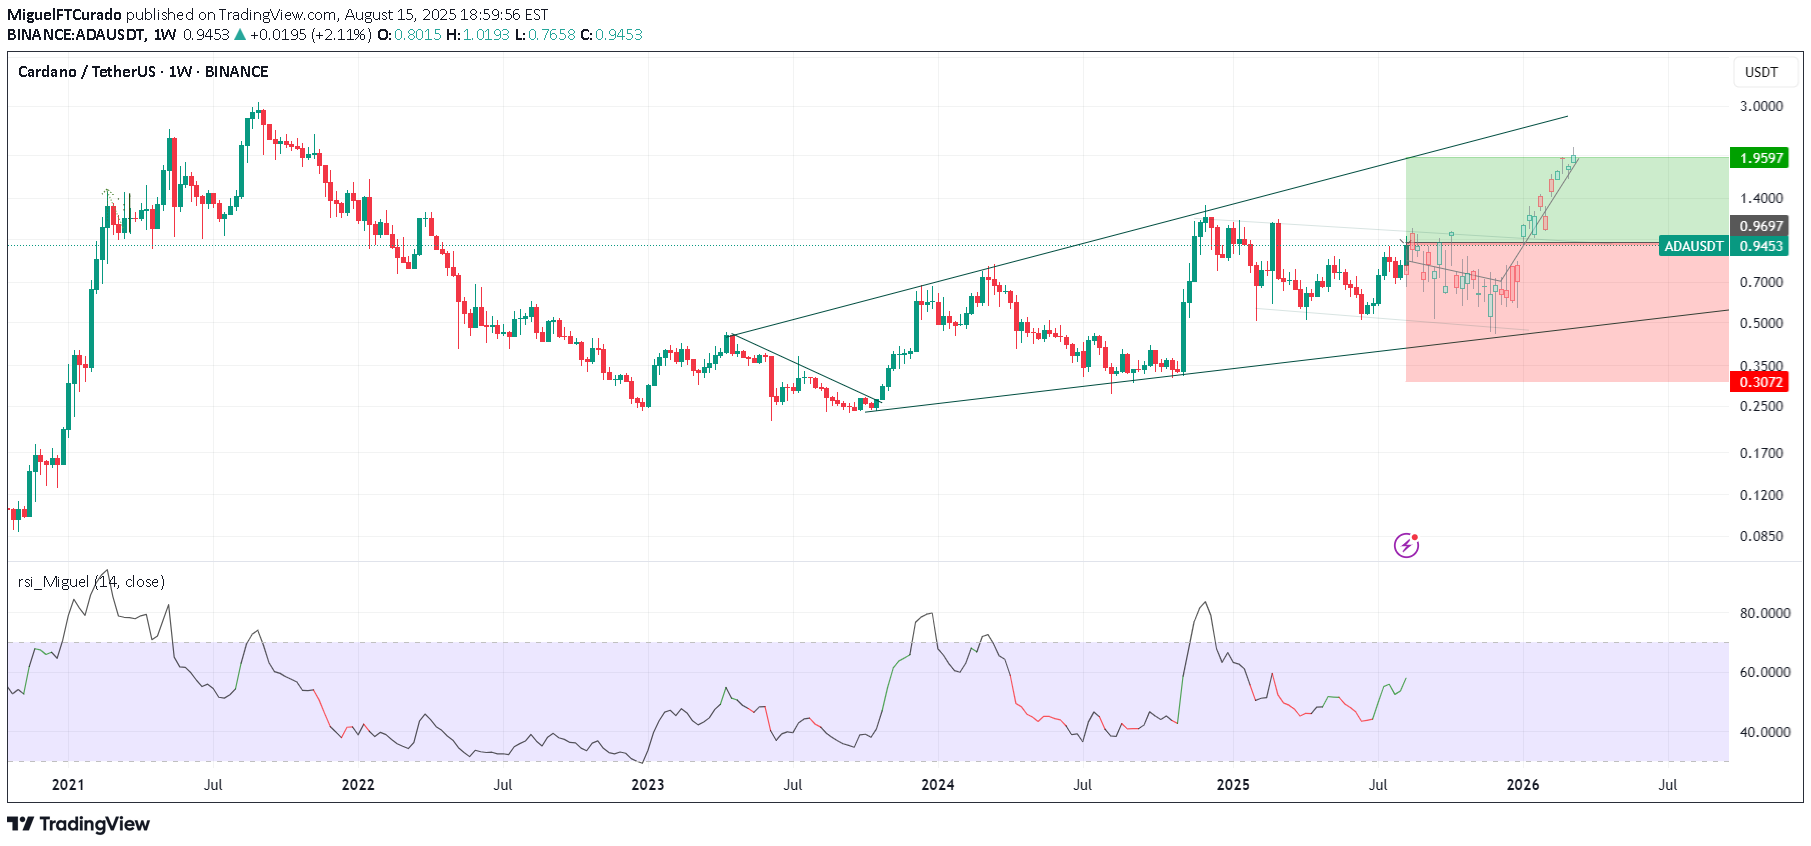
Why Might ADA (Cardano) “Explode” in Price soon? 1. Major Upgrades & Governance Milestones In August 2025, the Cardano community passed a landmark $70 million (≈96 million ADA) proposal to fund pivotal upgrades—including Ouroboros Leios, Hydra, Mithril, and Project Acropolis—designed to significantly boost scalability, interoperability, and developer tooling These upgrades are expected to be rolled out over a 12-month roadmap—with milestone-based releases tightly monitored by stakeholders—making each major rollout a potential catalyst for ADA price jumps 2. Technical Breakouts & Chart Patterns Analysts recently identified a bull-flag breakout on ADA’s chart, suggesting a potential 100–150% rally toward $1.60–$1.75 if momentum continues Technical indicators (such as RSI and MACD) point to possible 46% gains if ADA breaks above key resistance levels or a push toward $0.90–$1.00 if the bullish trend extends 3. On-Chain & Institutional Activity Cardano’s ecosystem is showing strong on-chain momentum with daily transactions near 2.6 million, low average fees and growing developer confidence Institutional sentiment is increasing—Grayscale has allocated ~18.5% of its smart-contract fund to ADA, and ETF speculation is growing as regulatory clarity improves Long-term holders remain resolute—over 15 billion ADA hasn’t moved for more than a year, indicating low selling pressure, while retail buzz increases 4. Whale Activity & Real-World Utility A recent spike in "whale activity", including large ADA accumulation and a positive MVRV ratio (~22%), often precedes strong upward momentum Improved real-world integration—like native ADA tools for Apple platforms and potential Apple Pay compatibility—can enhance mainstream adoption and act as price triggers 5. Broader Market & Macro Sentiment ADA’s price tends to move with broader crypto sentiment. However, even amid market corrections, ADA has shown resilience and occasionally outperformed larger tokens—e.g., pumping while others crashed, driven largely by ETF buzz and technical setups Headlines and media sentiment—even speculative projections (e.g., targeting $10)—can fuel dramatic moves, though these should be viewed with caution. 6. Forbes Advisor’s Top 10 Cryptocurrencies (August 14, 2025) Cardano (ADA) BNB (BNB) Bitcoin (BTC) Polkadot (DOT) Ethereum (ETH) Litecoin (LTC) Solana (SOL)
MiguelFTCurado
Think of RSI like a car’s speedometer: The speed (RSI) changes b
"Think of RSI like a car’s speedometer: The speed (RSI) changes before the position (price) changes direction." 1. What RSI actually is? RSI (Relative Strength Index) is just a math transformation of price data. It measures the ratio of recent upward moves to downward moves over a period (often 14 candles) and compresses it into a 0–100 scale. 2. Why RSI sometimes “moves first” This isn’t magic — it’s because RSI is sensitive to the speed and size of recent price changes, not just direction. - If price is still going up but at a slower pace, RSI can already start turning down. - If price is falling more gently than before, RSI can start curling up before price actually reverses. 3. Why traders care about RSI reversals? - If RSI starts turning down from an overbought level while price is still climbing, it can be an early warning of a possible price top. - Same for the opposite: RSI turning up from oversold while price still dips can signal an upcoming bounce. 4. RSI above or below 50 50 on the RSI is the “momentum neutral” line. - When RSI is above 50, recent gains outweigh recent losses → momentum is bullish. - When RSI is below 50, recent losses outweigh recent gains → momentum is bearish. 5. The “delay” you see The delay is more about your eyes than the math: - RSI smooths recent price moves (average gains/losses), so it reacts slightly ahead to changes in momentum. - Price must actually reverse for you to “see” it, but RSI reflects that change in momentum first. - Think of RSI like a car’s speedometer: The speed (RSI) changes before the position (price) changes direction. 6. How to deal with noise* in RSI? Use higher timeframes (1D, 1W, 1M) to confirm signals from small charts. *Noise in trading = small, random price movements that don’t reflect the bigger trend. On a 1-minute or 5-minute chart, there’s a lot of this — caused by scalpers, bots, spreads, liquidity gaps, and normal market “chatter.”Feel free to comment or ask something 🤑
MiguelFTCurado
DOGE +35%
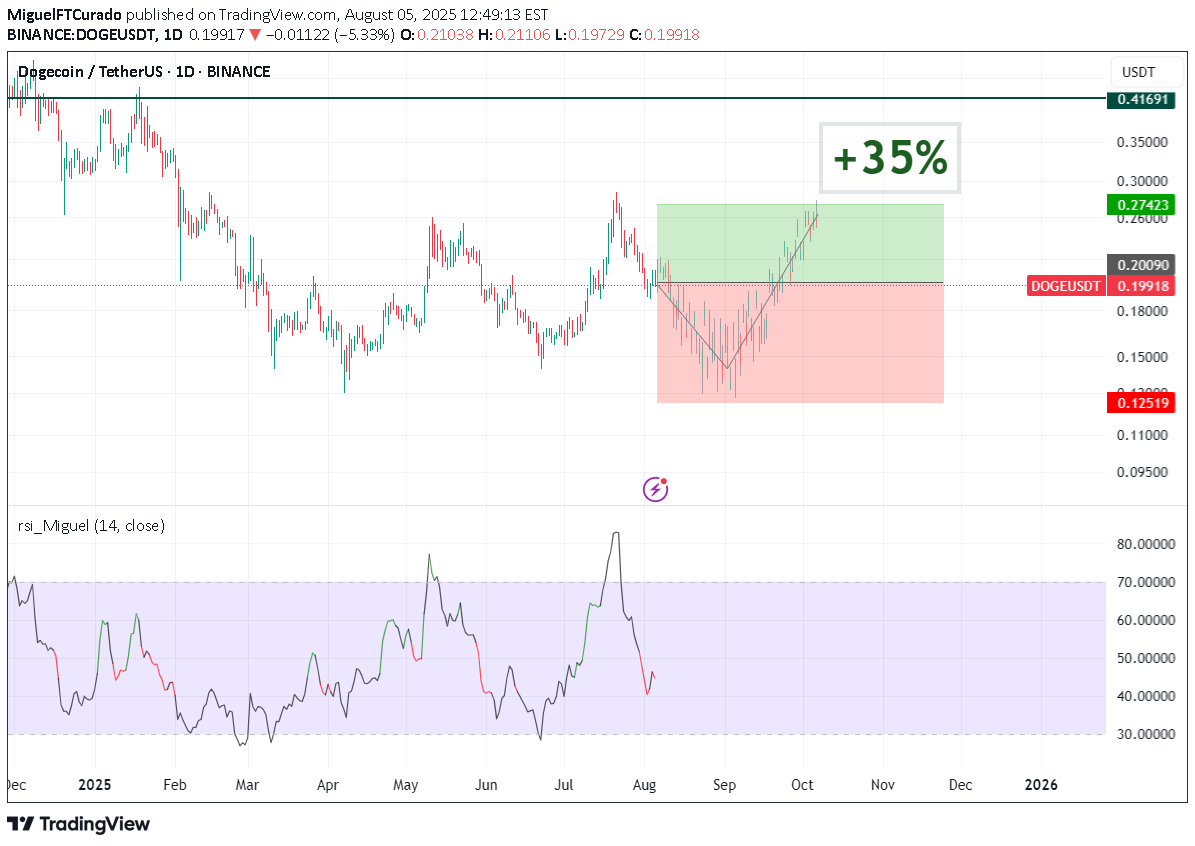
TakeProfit 0.268 Buy 0.200 StopLoss 0.125 Risk/Reward ratio ~1 Expected time: 2 or 3 months
MiguelFTCurado
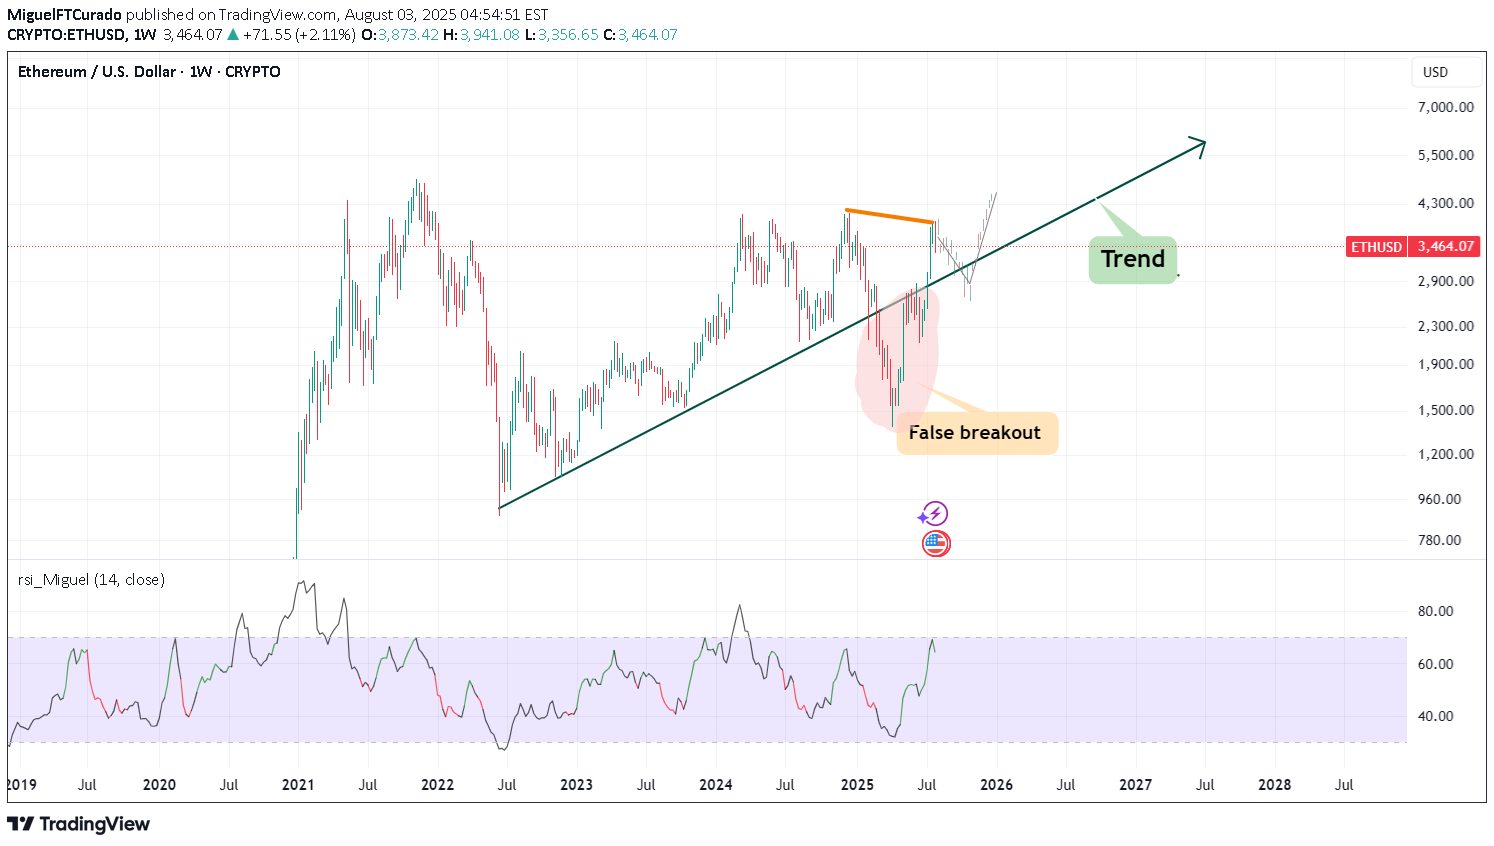
Seven topics explaining why Ethereum might be heading towards at
Seven topics explaining why Ethereum might be heading towards at least $4,500 after returning to its trend: 1. Market Sentiment and Bullish Reversal When Ethereum breaks out of a consolidation phase or a downtrend, it often signals a shift in market psychology. A bullish reversal can be triggered by technical patterns such as ascending triangles, breakouts above key resistance levels, or bullish candlestick formations. Positive news (e.g., regulatory clarity, major partnerships, or favorable market reports) enhances investor confidence. Once traders recognize a trend reversal, it leads to increased buying momentum, further propelling ETH higher. This shift in sentiment often acts as a self-fulfilling prophecy, attracting more capital into the asset. 2. Institutional Adoption and Investment Institutional investors, including hedge funds, asset managers, and pension funds, play a crucial role in cryptocurrency price dynamics. Large-scale investments, ETFs, or custodial solutions designed for institutional clients can generate significant buy pressure. Notable endorsements from major financial firms or integration of Ethereum-based products into mainstream financial platforms can serve as a validation, encouraging broader participation. This institutional involvement often brings stability and confidence, supporting sustained upward movement towards higher targets like $4,500. 3. DeFi and NFT Growth Ethereum's ecosystem is the backbone of the decentralized finance (DeFi) sector and NFTs. The expanding adoption of DeFi applications (lending, borrowing, staking) and booming NFT markets increase demand for ETH, since it is essential for transaction fees and smart contract execution. As new projects and use cases emerge, the utility of ETH grows, directly impacting its value. Additionally, mainstream adoption of DeFi and NFTs draws more retail and institutional investors into the ecosystem, contributing to price appreciation. 4. Network Developments Ethereum continues to undergo significant upgrades to address scalability, security, and sustainability. Ethereum 2.0, with features like proof-of-stake (PoS) consensus, shard chains, and Layer 2 scaling solutions (like Rollups), greatly enhance network efficiency. These upgrades improve user experience and reduce transaction costs, making Ethereum more attractive for developers and users. The improving technology infrastructure can result in increased transaction volume, user activity, and investor confidence, which collectively drive the price upward. 5. Macro and Cryptocurrency Market Factors Broader macroeconomic conditions influence Ethereum’s price. A declining dollar, inflation concerns, or global economic uncertainty can push investors toward alternative assets like cryptocurrencies. Bitcoin’s market movement often correlates with ETH, and a bullish Bitcoin trend can lift ETH prices as well. Additionally, positive regulatory developments or a general rally in the crypto market can create a favorable environment, supporting Ethereum’s ascent to higher levels. 6. Technical Indicators Traders rely heavily on technical analysis. Breakouts above significant resistance levels (e.g., previous highs around $3,500 or $4,000), increased trading volume, and bullish chart patterns such as flags or bullish divergence reinforce the upward trend. These technical signals attract momentum traders and institutional players, which accelerate the price increase. Consistent bullish technicals contribute to a self-sustaining upward trajectory toward the $4,500 target. 7. Supply Dynamics Ethereum's supply mechanics significantly influence its price. The implementation of EIP-1559 introduced a fee-burning mechanism that reduces circulating supply over time, creating a deflationary pressure. When network activity is high, more ETH is burned, decreasing supply and potentially increasing scarcity. Furthermore, the transition to Ethereum 2.0's proof-of-stake reduces issuance, limiting new ETH supply entering the market. These supply-side dynamics, combined with growing demand, can lead to significant appreciation, moving ETH toward and beyond the $4,500 level.
MiguelFTCurado
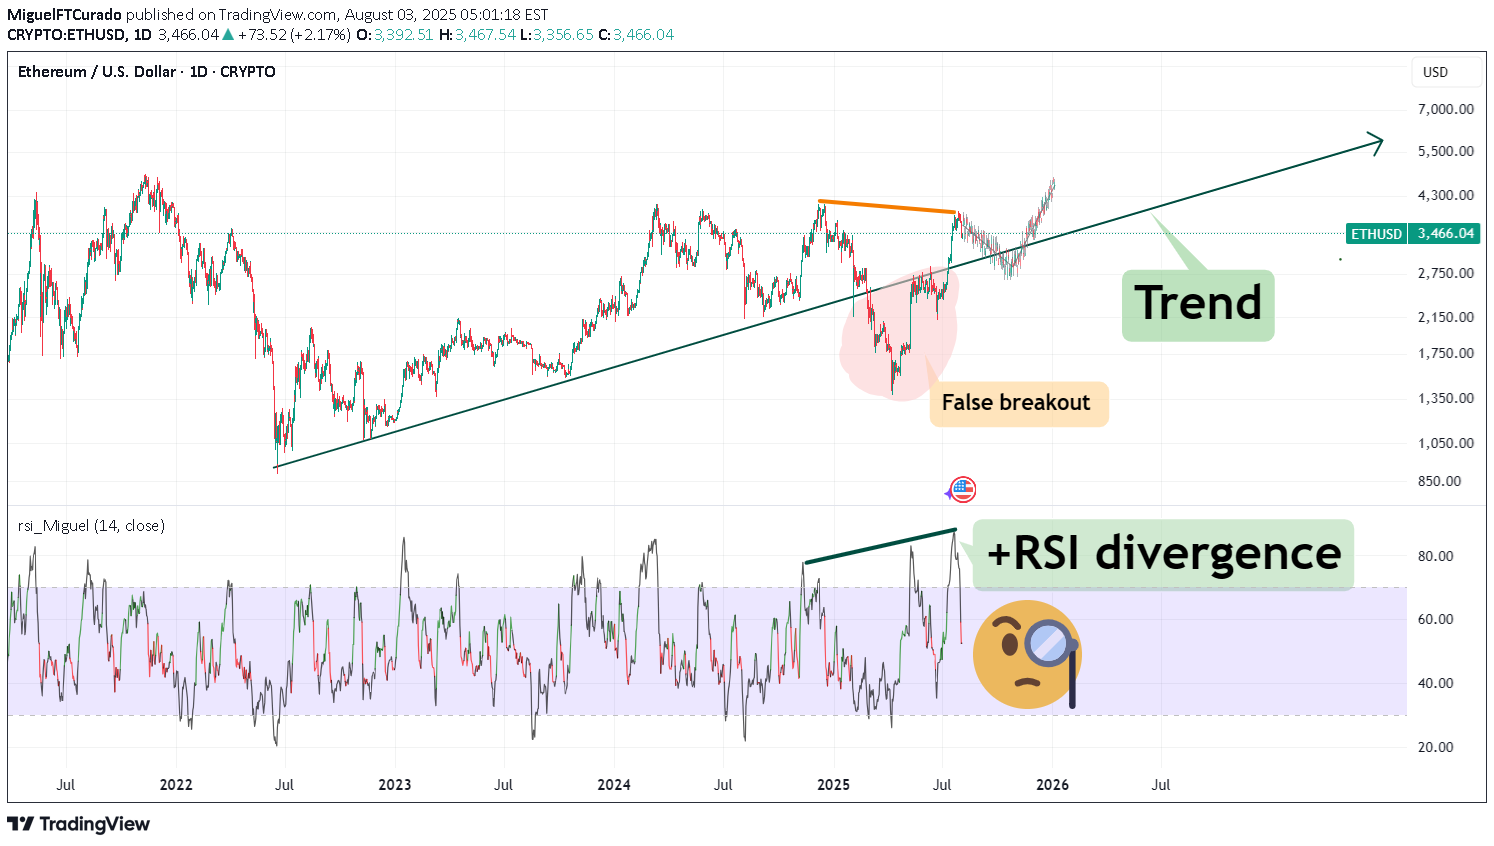
ETH to + $4,500
7 topics explaining why Ethereum might be heading towards at least $4,500 after returning to its trend: 1. Market Sentiment and Bullish Reversal When Ethereum breaks out of a consolidation phase or a downtrend, it often signals a shift in market psychology. A bullish reversal can be triggered by technical patterns such as ascending triangles, breakouts above key resistance levels, or bullish candlestick formations. Positive news (e.g., regulatory clarity, major partnerships, or favorable market reports) enhances investor confidence. Once traders recognize a trend reversal, it leads to increased buying momentum, further propelling ETH higher. This shift in sentiment often acts as a self-fulfilling prophecy, attracting more capital into the asset. 2. Institutional Adoption and Investment Institutional investors, including hedge funds, asset managers, and pension funds, play a crucial role in cryptocurrency price dynamics. Large-scale investments, ETFs, or custodial solutions designed for institutional clients can generate significant buy pressure. Notable endorsements from major financial firms or integration of Ethereum-based products into mainstream financial platforms can serve as a validation, encouraging broader participation. This institutional involvement often brings stability and confidence, supporting sustained upward movement towards higher targets like $4,500. 3. DeFi and NFT Growth Ethereum's ecosystem is the backbone of the decentralized finance (DeFi) sector and NFTs. The expanding adoption of DeFi applications (lending, borrowing, staking) and booming NFT markets increase demand for ETH, since it is essential for transaction fees and smart contract execution. As new projects and use cases emerge, the utility of ETH grows, directly impacting its value. Additionally, mainstream adoption of DeFi and NFTs draws more retail and institutional investors into the ecosystem, contributing to price appreciation. 4. Network Developments Ethereum continues to undergo significant upgrades to address scalability, security, and sustainability. Ethereum 2.0, with features like proof-of-stake (PoS) consensus, shard chains, and Layer 2 scaling solutions (like Rollups), greatly enhance network efficiency. These upgrades improve user experience and reduce transaction costs, making Ethereum more attractive for developers and users. The improving technology infrastructure can result in increased transaction volume, user activity, and investor confidence, which collectively drive the price upward. 5. Macro and Cryptocurrency Market Factors Broader macroeconomic conditions influence Ethereum’s price. A declining dollar, inflation concerns, or global economic uncertainty can push investors toward alternative assets like cryptocurrencies. Bitcoin’s market movement often correlates with ETH, and a bullish Bitcoin trend can lift ETH prices as well. Additionally, positive regulatory developments or a general rally in the crypto market can create a favorable environment, supporting Ethereum’s ascent to higher levels. 6. Technical Indicators Traders rely heavily on technical analysis. Breakouts above significant resistance levels (e.g., previous highs around $3,500 or $4,000), increased trading volume, and bullish chart patterns such as flags or bullish divergence reinforce the upward trend. These technical signals attract momentum traders and institutional players, which accelerate the price increase. Consistent bullish technicals contribute to a self-sustaining upward trajectory toward the $4,500 target. 7. Supply Dynamics Ethereum's supply mechanics significantly influence its price. The implementation of EIP-1559 introduced a fee-burning mechanism that reduces circulating supply over time, creating a deflationary pressure. When network activity is high, more ETH is burned, decreasing supply and potentially increasing scarcity. Furthermore, the transition to Ethereum 2.0's proof-of-stake reduces issuance, limiting new ETH supply entering the market. These supply-side dynamics, combined with growing demand, can lead to significant appreciation, moving ETH toward and beyond the $4,500 level.
MiguelFTCurado
UNI +24%

📈 Uniswap (UNI) Price Prediction for 2025Analysts project that UNI could reach between $9.85 and $16.08 by the end of 2025, depending on market conditions and adoption rates. Botsfolio🔍 Factors Influencing the PredictionDeFi Growth: Uniswap's role as a leading decentralized exchange positions it to benefit from the overall growth of decentralized finance.Protocol Upgrades: Enhancements like Uniswap V4, introducing features such as customizable hooks, could attract more users and increase UNI's utility.mudrex.comMarket Sentiment: Current indicators suggest a neutral to slightly positive sentiment, which could support gradual price increases.⚠️ ConsiderationsRegulatory Environment: Changes in cryptocurrency regulations could impact Uniswap's operations and UNI's value.Competition: The rise of other decentralized exchanges may affect Uniswap's market share and, consequently, UNI's price.
MiguelFTCurado
Why Ethereum Could 10x in the Next Few Years

🚀 1. Ethereum ETF Approval ETFs are approved in the U.S. (similar to the Bitcoin ETFs in early 2024), institutional money will flood in. Grayscale, BlackRock, and others have already filed. Ethereum’s price jumped significantly after similar events in the past. 2. Deflationary Supply (Post-EIP-1559) Since EIP-1559, ETH has been burned with every transaction. Combined with Proof-of-Stake (The Merge), ETH is now net deflationary during periods of high network activity. 3. Layer 2 Ecosystem Is Exploding Rollups (Arbitrum, Optimism, Base, zkSync) are scaling Ethereum. These L2s settle on Ethereum L1, driving fees and activity. Vitalik’s "rollup-centric roadmap" is playing out — this benefits ETH long-term. 4. Real Yield from Staking Ethereum now offers a real, sustainable yield from staking (~3–5%). Institutions love yield. ETH becomes more like a productive asset, not just a speculative token. 5. Ethereum as the Base Layer of Web3 DeFi, NFTs, gaming, DAOs — Ethereum is still the dominant smart contract platform. The most secure, battle-tested, and widely adopted chain. Developers and enterprises continue to build on Ethereum over competitors. 6. Macro Tailwinds As the U.S. moves toward looser monetary policy, risk assets (including crypto) historically benefit. Crypto adoption is growing globally — from Latin America to Asia — and Ethereum is often the entry point.
MiguelFTCurado
The worst-case scenario for Bitcoin

📉 Potential Dip to $70,000 in 2026 Some analysts suggest that Bitcoin could experience a correction to around $70,000 in 2026. This potential downturn may be influenced by: Market Cycles: Bitcoin's price has historically followed cyclical patterns, with periods of rapid growth followed by corrections. Regulatory Changes: Shifts in global regulatory stances toward cryptocurrencies could impact investor sentiment and market dynamics. Macroeconomic Factors: Economic events, such as changes in interest rates or geopolitical tensions, could influence risk appetite among investors. It's important to note that while a dip to $70,000 is within the realm of possibility, other forecasts for 2026 are more optimistic. For instance, CoinCodex projects Bitcoin trading between $94,836 and $160,074 in 2026, with an average price of $119,743 . 🚀 Surge to Over $130,000 in 2027 Looking ahead to 2027, several factors could contribute to a significant increase in Bitcoin's price: Institutional Adoption: Growing interest from institutional investors could drive demand. Technological Advancements: Improvements in blockchain technology and scalability solutions may enhance Bitcoin's utility. Global Economic Conditions: In times of economic uncertainty, Bitcoin is often viewed as a hedge against inflation. Analysts have provided various projections for 2027: Binance forecasts a price range between $140,491 and $216,738, with an average of $170,100 . Bittime estimates an average price of $138,000, with potential highs up to $150,000Not into doom-and-gloom takes. Right now, I feel a lot safer sticking with Ethereum and a few solid altcoins. 💪🔒 #Crypto #Ethereum #Altcoins
MiguelFTCurado
APE is showing early signs of accumulation after prolonged conso

MiguelFTCurado
DOGE WAKES UP?! The Dog Is Stretching… and It’s Not Just a Meme

🐶💥 DOGE WAKES UP?! The Dog Is Stretching… and It’s Not Just a Meme Anymore 🐕🚀 DOGEUSDT – Daily Chart Breakdown The dog has been sleeping… but every time it twitches, the market barks. Now, Dogecoin is showing major RSI divergence + volume uptick — and that usually means one thing: something’s coming 🧠📈 🧩 Technical Signals: ✅ Bullish RSI Divergence (momentum building while price dips) ✅ MACD Flipping Green ✅ Bouncing off long-term trendline support 🚀 Cup & Handle? Or Launchpad to $0.20? Resistance to watch: $0.155 Breakout zone: $0.168 👁 Watchlist It. Chart It. Respect It. You don’t want to be the last one to see the breakout candle. “They laugh at Doge... until it moons again.” – Ancient Crypto Proverb 🌕 📢 Follow for more alpha and try the rsi_Miguel indicator to catch these setups early! #DOGE #Dogecoin #CryptoCharts #Breakout #MemeCoinMagic #TradingView #RSIDivergence #ShibesAssemble
Disclaimer
Any content and materials included in Sahmeto's website and official communication channels are a compilation of personal opinions and analyses and are not binding. They do not constitute any recommendation for buying, selling, entering or exiting the stock market and cryptocurrency market. Also, all news and analyses included in the website and channels are merely republished information from official and unofficial domestic and foreign sources, and it is obvious that users of the said content are responsible for following up and ensuring the authenticity and accuracy of the materials. Therefore, while disclaiming responsibility, it is declared that the responsibility for any decision-making, action, and potential profit and loss in the capital market and cryptocurrency market lies with the trader.