
MeeCoin
@t_MeeCoin

What symbols does the trader recommend buying?
Purchase History
پیام های تریدر
Filter
MeeCoin
[DOTUSDT] Polkadot Approaching Breakout: Round Bottom Targ

Polkadot (DOT) is currently forming a round bottom pattern with a key resistance level at $4.40. On the daily timeframe, DOT has been attempting to break through this resistance but has not yet succeeded. If this breakout attempt fails, DOT could retrace back to the $4.20 support zone for another retest. However, the round bottom structure suggests a gradual accumulation phase. Combined with the broader market’s anticipation of an altcoin season and the upcoming approval processes for DOT-related ETFs, this setup positions DOT as a compelling investment candidate. From a technical perspective, should the breakout materialize, a rally toward the $6.50 target zone appears to be a realistic and achievable scenario.
MeeCoin
[OPUSDT] Waiting for Breakout Wave
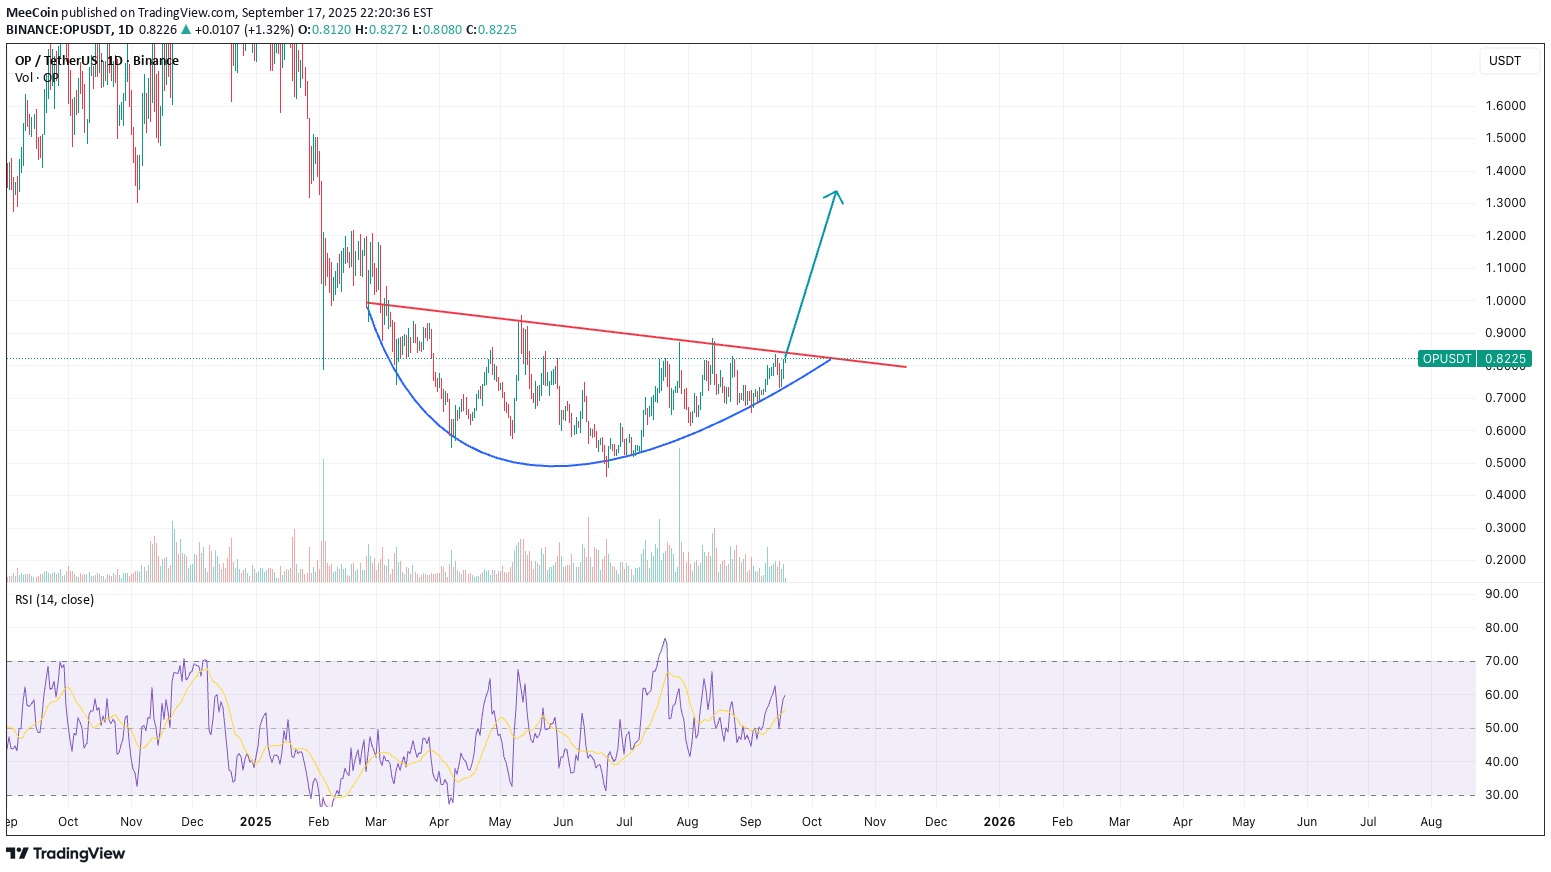
It is clear that OP has formed a round bottom and is now approaching resistance at 0.83. With market volume still increasing, I expect OP to break this resistance soon. In case OP rejects the resistance, I believe it won’t take long before a breakout occurs, as the price is reaching the end of the round bottom formation. I have already entered a buy position at this level. This analysis is for reference only and should not be considered financial advice.
MeeCoin
[NEARUSDT] Accumulation Within Triangle, Waiting for Breakout
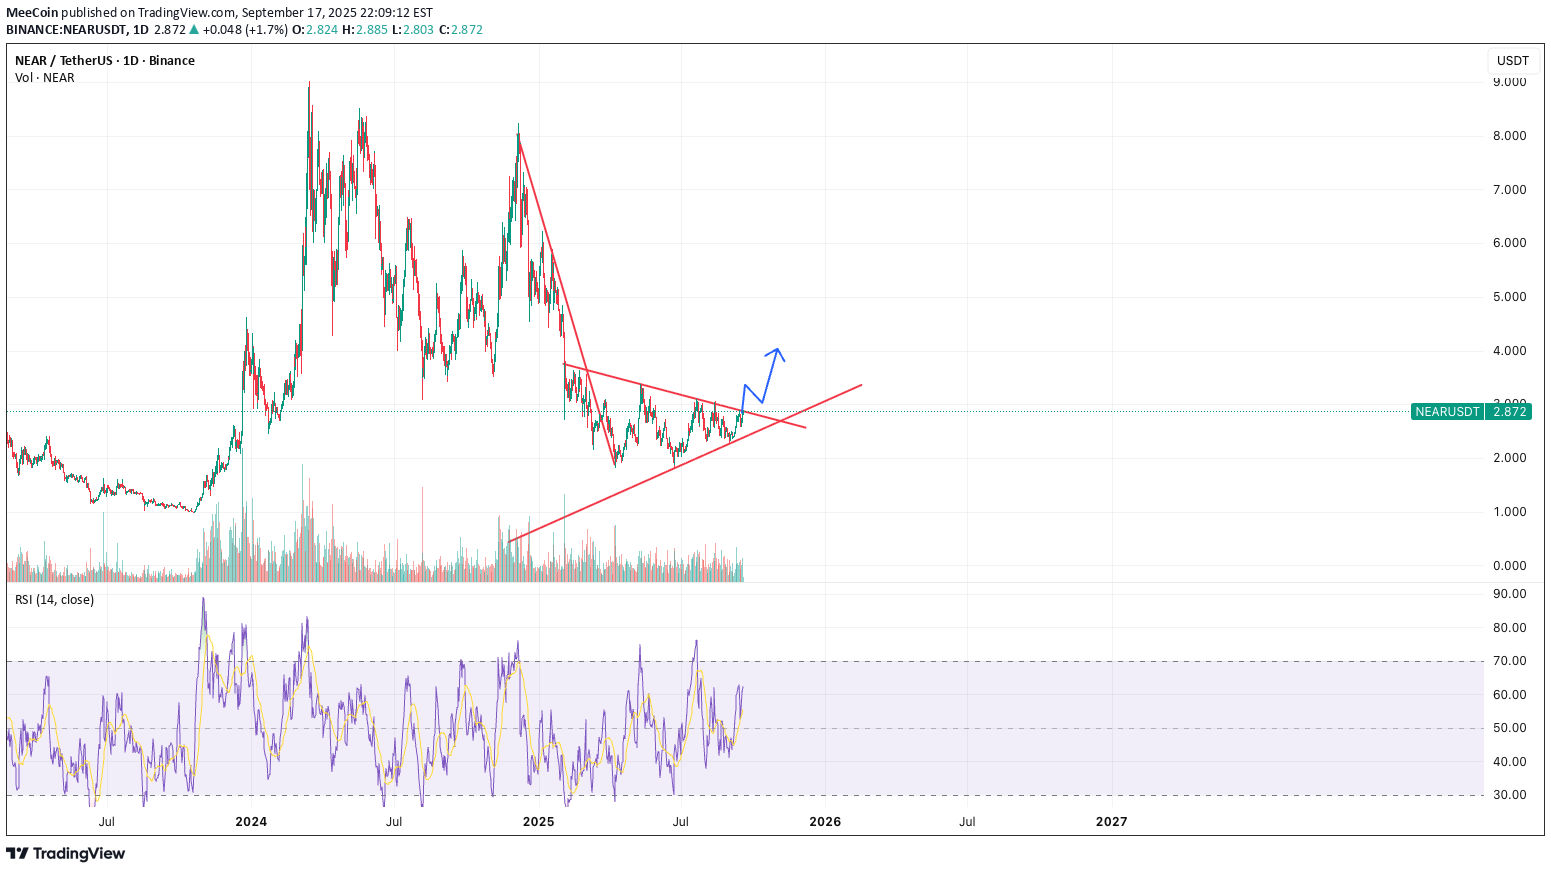
NEAR is currently consolidating within a triangle pattern, with price action tightening around the $2.65 axis. At the moment, NEAR is testing the upper boundary of the triangle, awaiting a potential breakout. A move above the $3.00 level is needed to confirm a bullish wave. However, with the Fed signaling possible rate cuts in 2025 and potentially continuing into 2026, I believe this presents an attractive buying opportunity. From a broader perspective, NEAR’s current price remains in a range suitable for long-term holding. Therefore, I suggest a buy-and-hold position on NEAR. This analysis is for reference only and should not be considered financial advice.
MeeCoin
[BTCUSDT] Breakout or Breakdown?
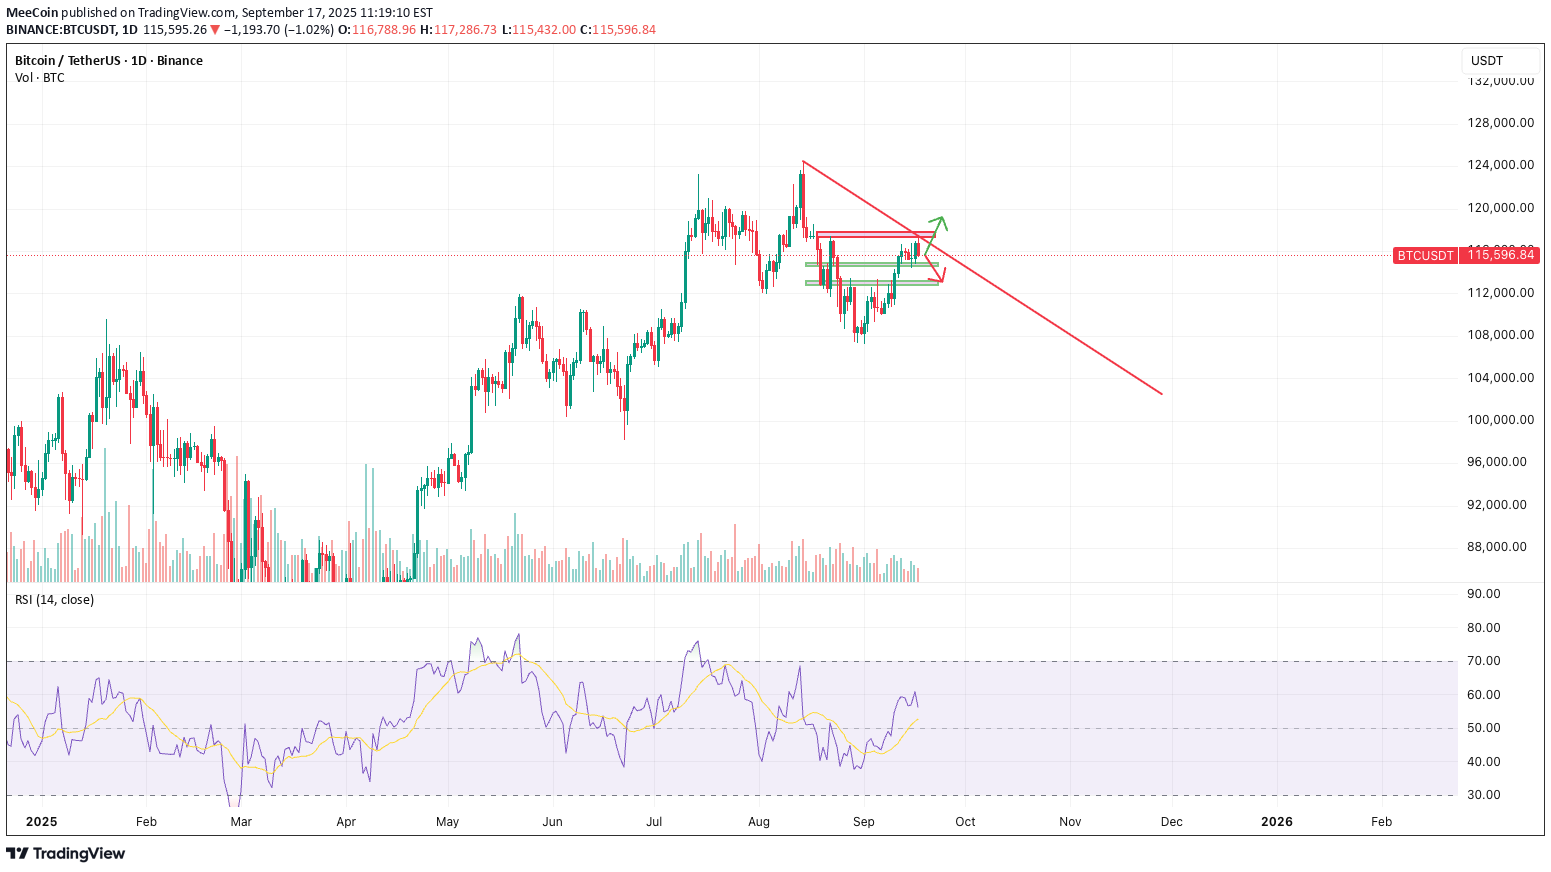
In my previous analysis, I reached the target at 117k and exited my position. Check my profile posts. I believe the recent rally has largely reflected market expectations that the Fed will cut interest rates. Given the Fed’s cautious stance in recent months, I think the most likely scenario is a 0.25% rate cut. With a 0.25% cut, I expect the market to remain relatively subdued and potentially dip slightly due to a sell-the-news effect. With a 0.50% cut, the market could react more positively in the short term, sparking a temporary surge across multiple asset classes. If the Fed keeps rates unchanged, I expect a negative market reaction. My base case is that the Fed opts for a 0.25% cut as a way to test market response, which could lead to a mild decline. Therefore, I lean more toward a bearish outlook. On the hourly chart, I am watching two key support levels at 114.5k and 113.25k. On the upside, if the Fed cuts by 0.50% and price breaks above 117k, I will reassess for potential bullish continuation. This analysis is for reference only and should not be considered financial advice.[BTCUSDT] Update 1 BTC had a slight dump as expected but quickly bounced back with strong volume. I am canceling my short view. At the moment, I have no clear opinion on BTC’s direction. My expectation is that BTC may move sideways, creating opportunities for altcoins to pump.
MeeCoin
WLDUSDT: Correction After Strong Rally
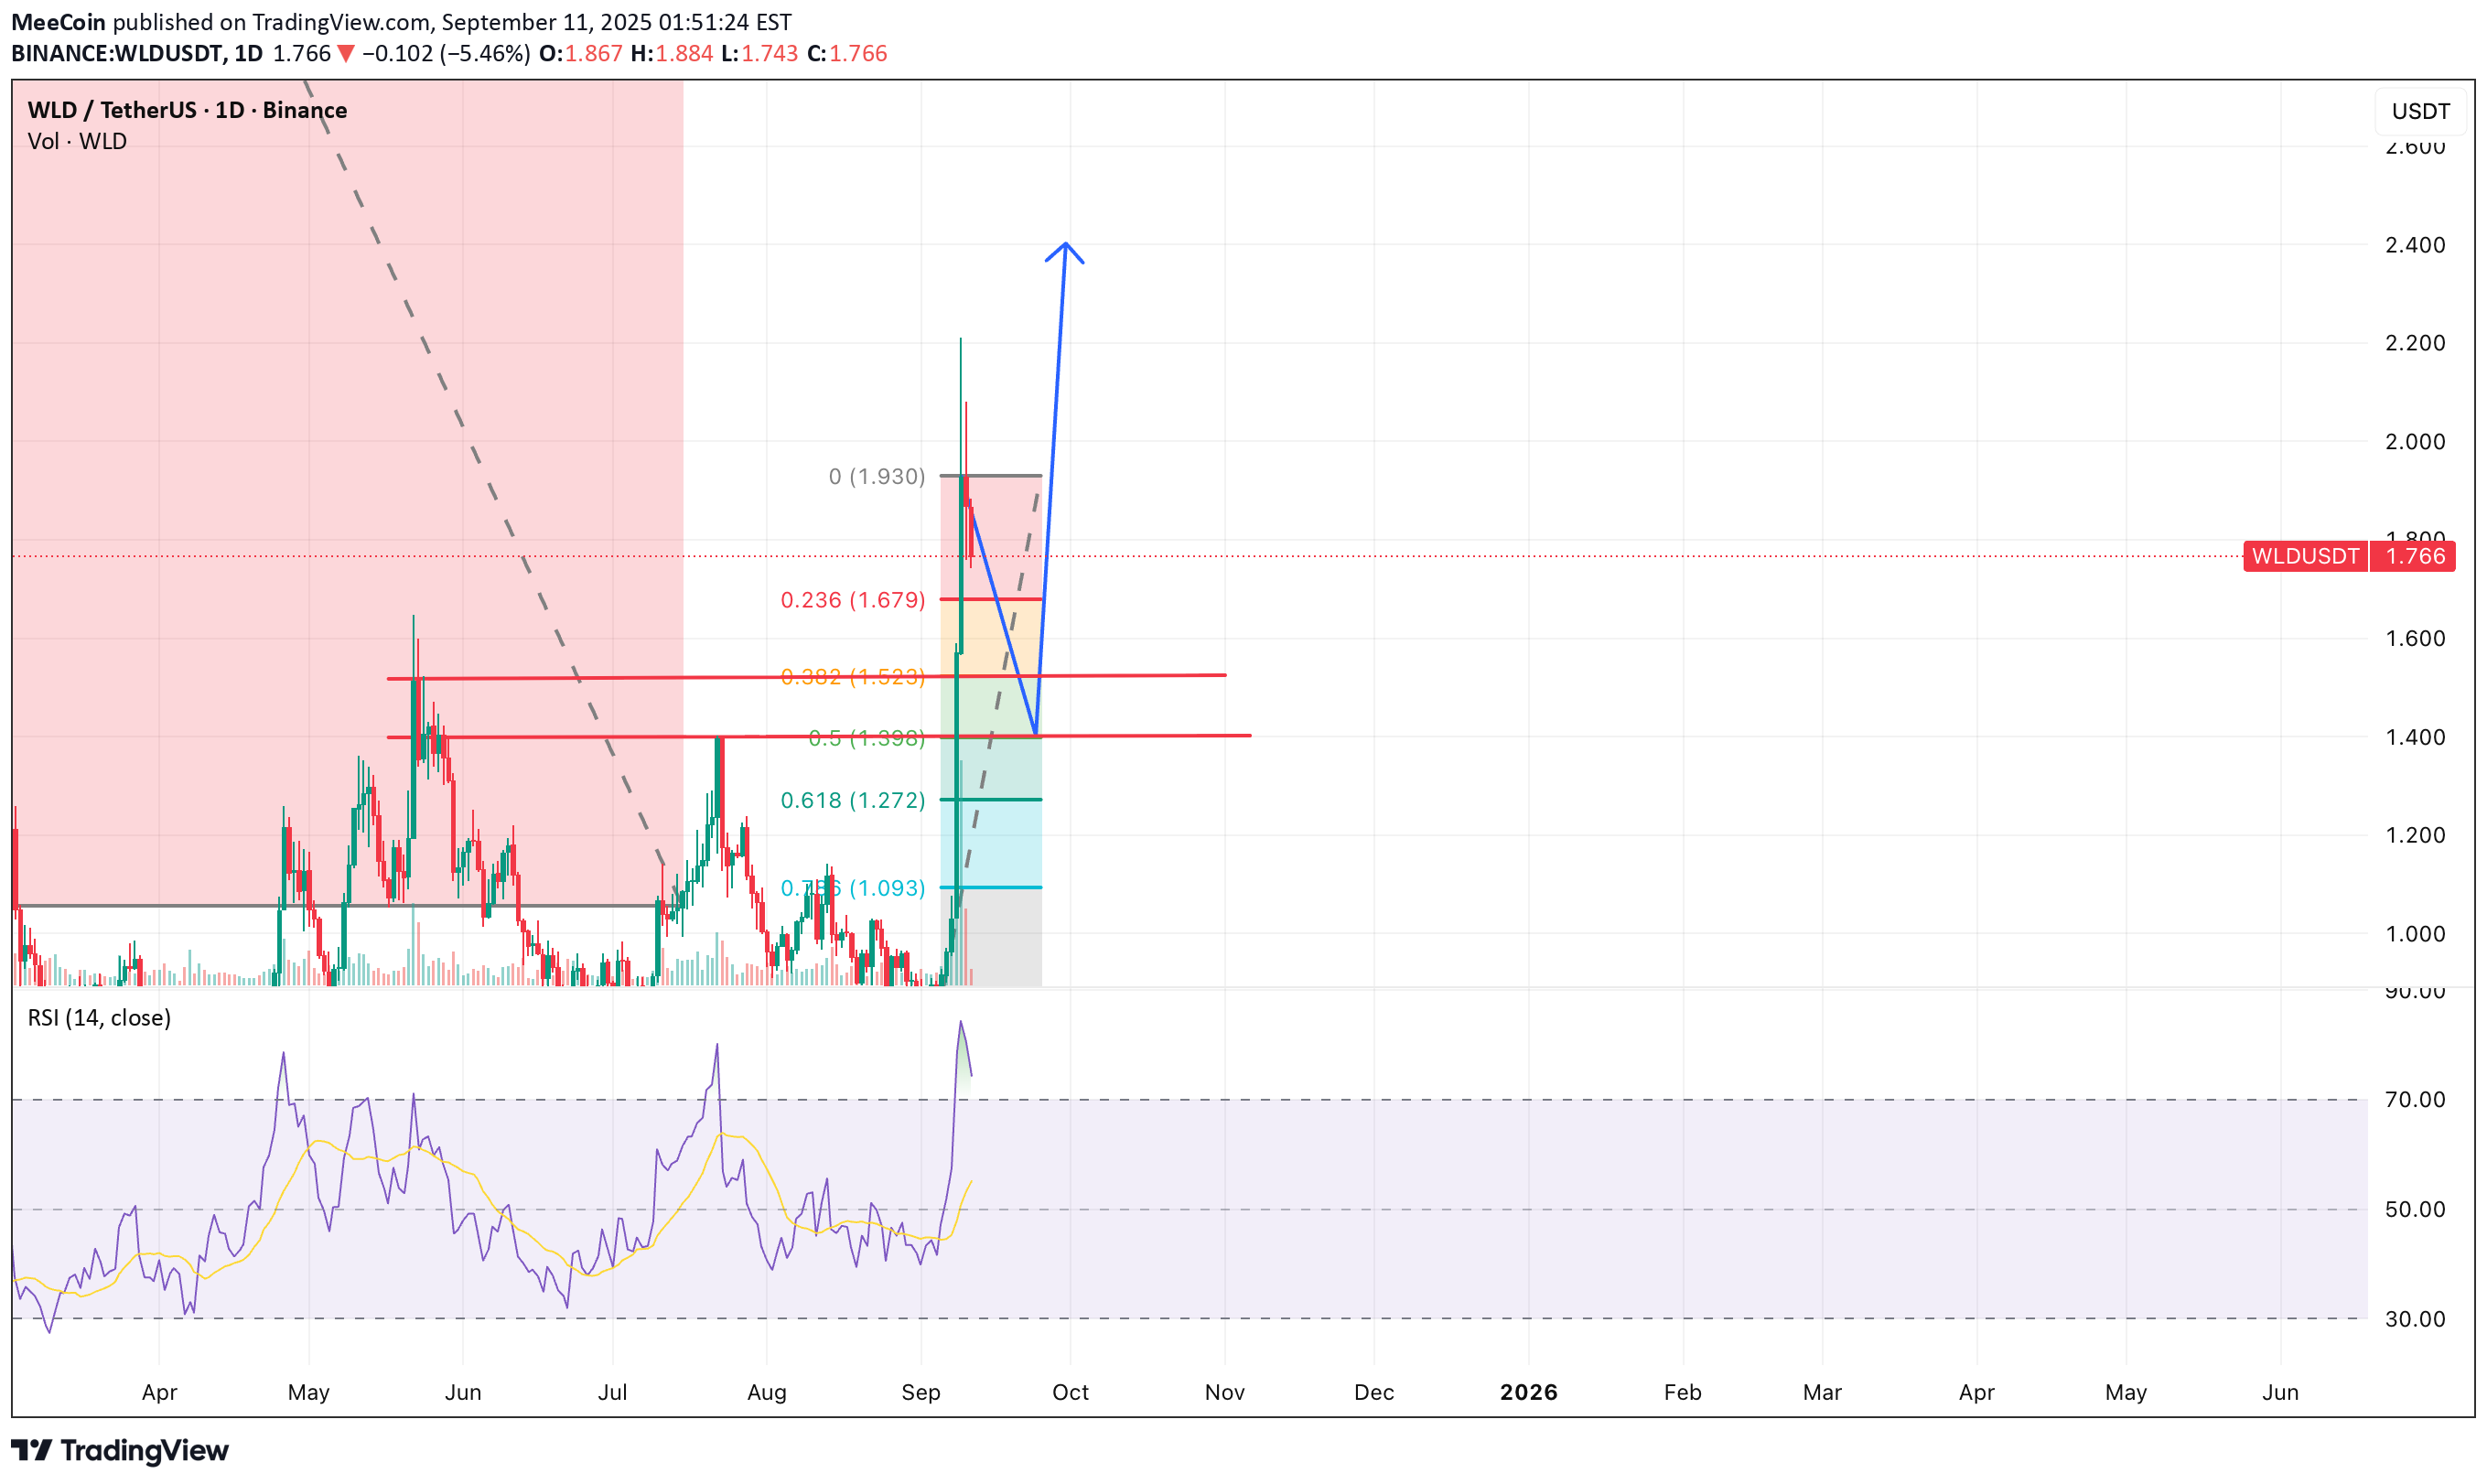
On the daily timeframe, WLD’s RSI is gradually declining, signaling a potential correction. On the hourly chart, RSI continues to fall toward 40, further confirming the corrective outlook. I expect WLD to extend its pullback toward the two support levels at $1.523 and $1.40. At the moment, I am looking for an exit price to close 50% of my WLD holdings to ensure safety. Disclosure: I am currently holding WLD, and this may influence my personal outlook. This analysis is for reference only and should not be considered financial advice.Update 1: WLDUSDT Price touched the first support and quickly bounced with solid buying pressure. I hesitated and did not re-enter, so this may turn out to be a failed trade for me. Nevertheless, I respect my decision and will use the capital I secured to look for opportunities in another coin.Update 2: Target 1 ReachedHello, target reached, I close this chart.
MeeCoin
SAROSUSDT: Weakening Buy Momentum, Bears May Take Control
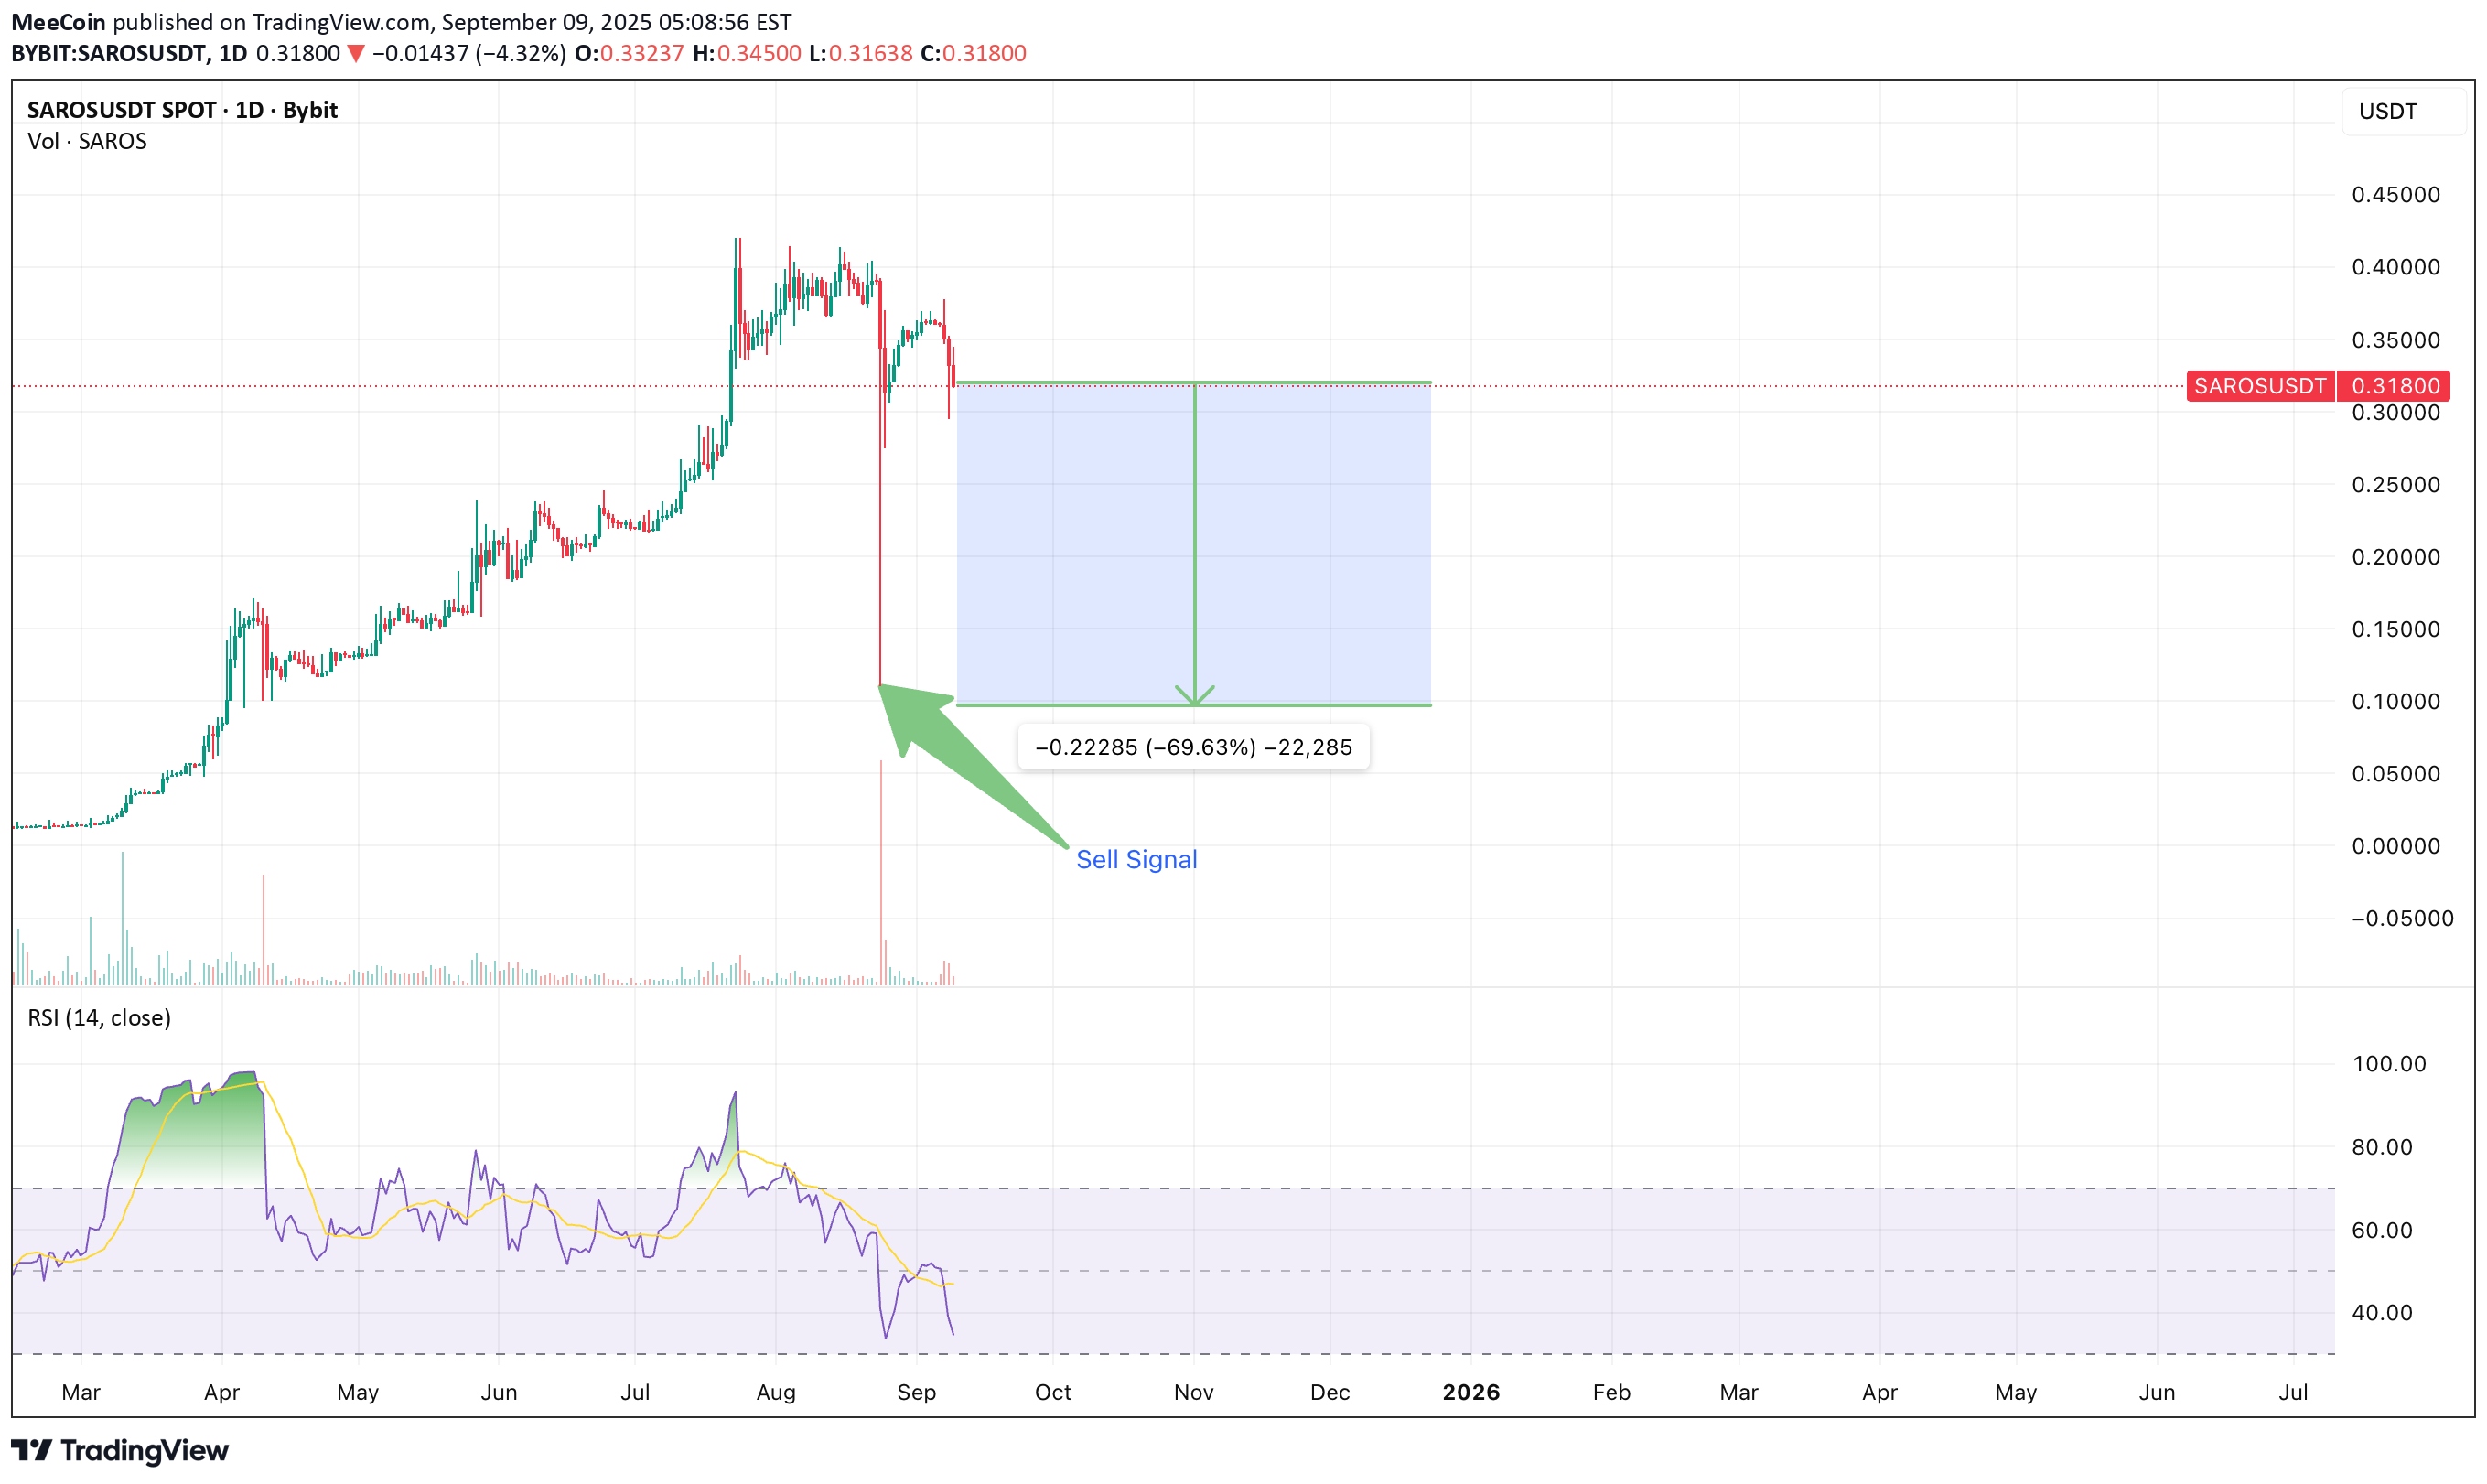
SAROS has been on an extended rally, but despite the price increase, trading volume has remained very low, making the price vulnerable to manipulation. On August 24th, we witnessed a sharp sell-off that drove the price down by two-thirds within just a few hours. Although market liquidity helped the price recover, I find this behavior unusual. It could be whales testing liquidity, or simply a large investor taking profits. In either case, I will not risk investing in a coin with weak liquidity and strong profit-taking sentiment from holders. If you are currently holding SAROS, I believe this is the time to consider taking profits. This analysis is for reference only and should not be considered financial advice.
MeeCoin
AVAXUSDT: Strong Buying Momentum
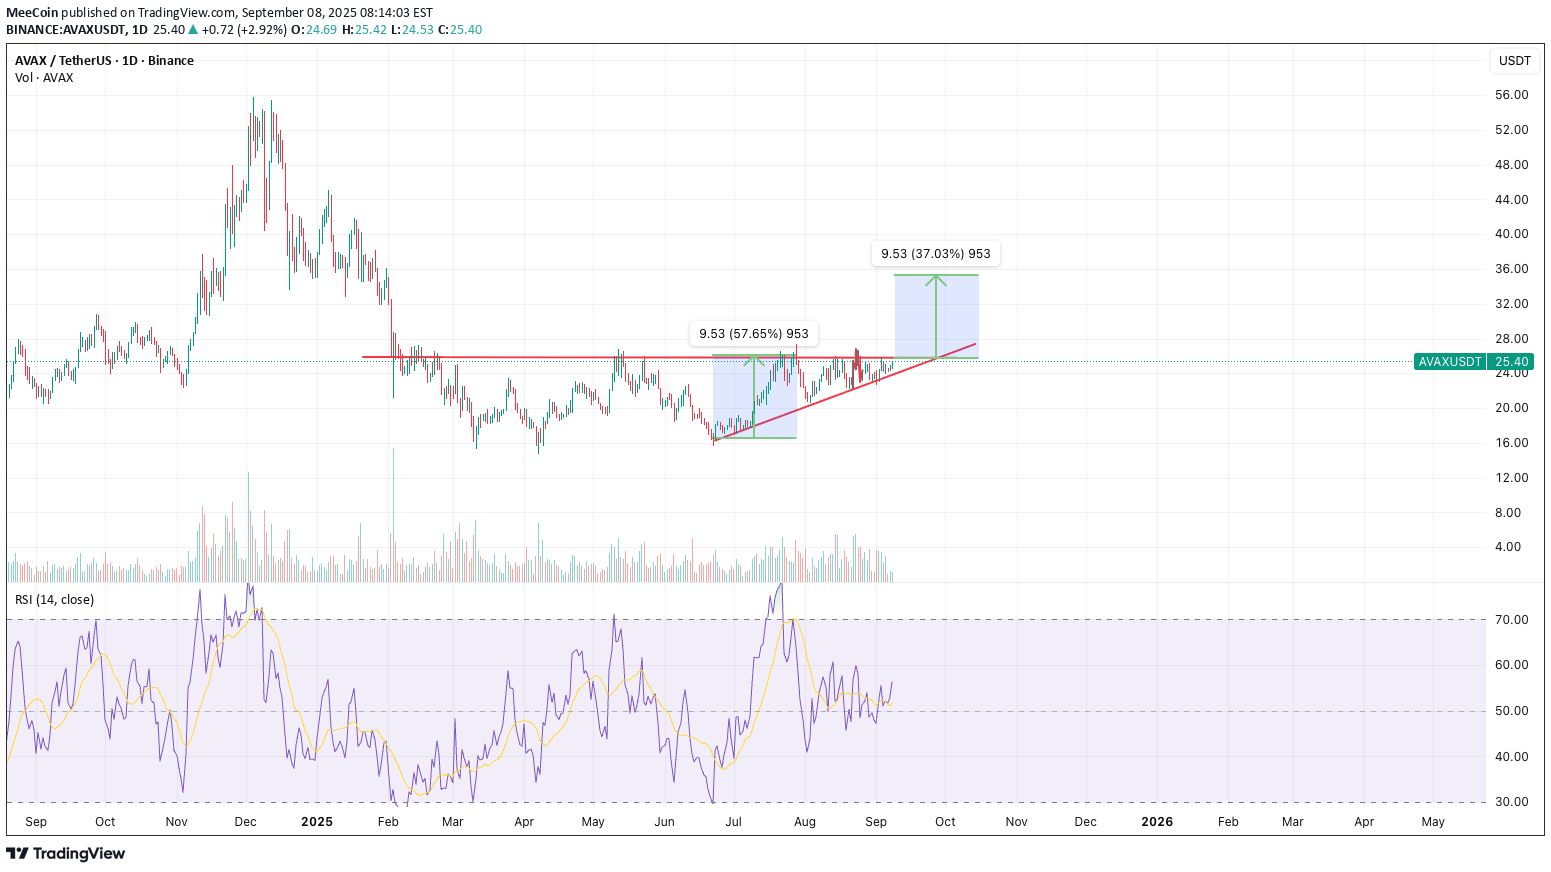
The AVAX chart is showing a clear bullish bias, holding firmly within an ascending triangle pattern with key resistance at the $25.6–$25.8 zone. Alongside positive macro signals, such as the Fed’s high likelihood of cutting interest rates in mid-September and renewed strength in risk-on assets, I expect AVAX to break through resistance. The first target is projected around the $31–$32 zone, with the next target near $35. Disclosure: I am currently holding an AVAX position with an average entry price of $22. This may influence my personal outlook on the market.Update: AVAX reached target, let's take profits and wait for another chart from us :)
MeeCoin
XAUUSD: Setting Up for a Potential Reversal
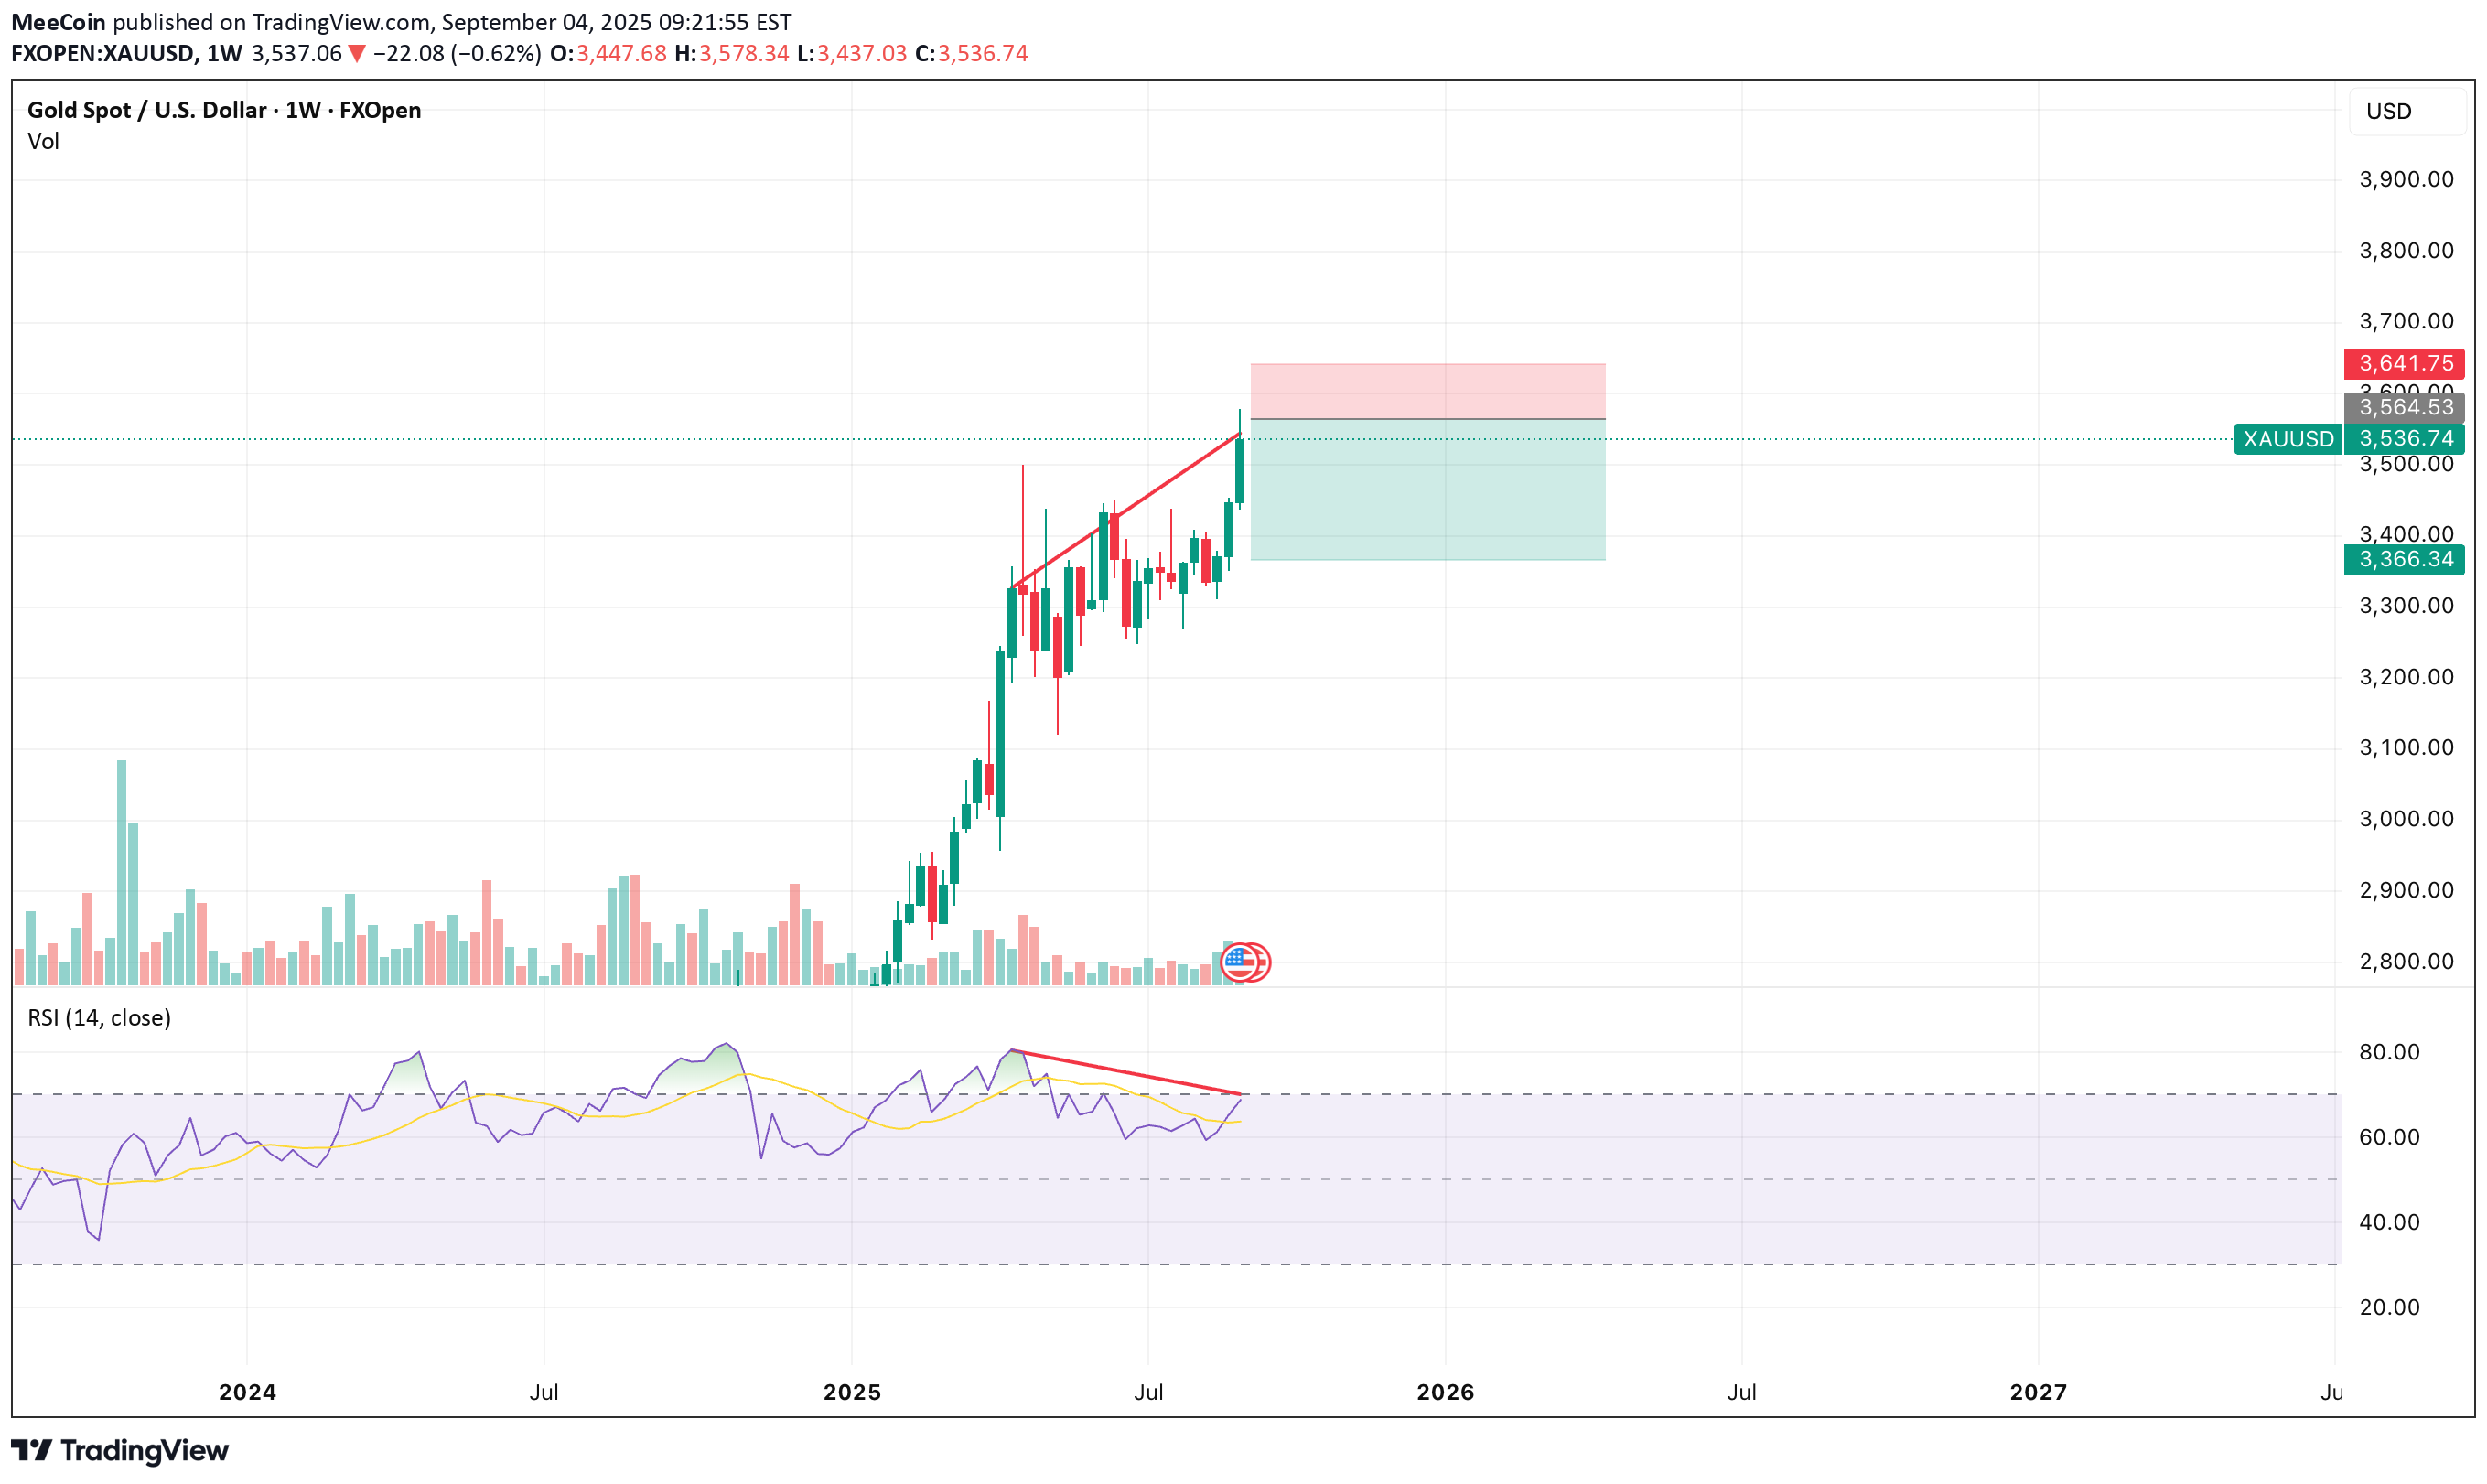
On the weekly timeframe, XAUUSD is showing a bearish divergence signal. The daily chart indicates selling pressure as profit-taking emerges around the $3,577 peak. A potential short setup could form near the previous high, especially if the daily RSI drops below 70. In my view, this level presents an attractive shorting opportunity. This analysis is for reference only and should not be considered financial advice.Update 1: XAUUSD XAU continues its strong rally, reaching the weekly resistance level. I am waiting for a clear signal of the daily RSI moving back below 70 to consider a short position. Apologies for plotting the target a bit too early, but I want to emphasize that entering a short trade while the RSI is still rising within the overbought zone (above 70) carries significant risk. Instead, it’s safer to wait for the RSI to roll over and exit the 70 zone, which will provide a cleaner short entry. This analysis is for reference only and should not be considered financial advice.Update 2: Trade Cancelled Gold continues its strong upward momentum with no signs of reversal on the daily timeframe. As mentioned earlier, I will not enter a position until the daily RSI drops back below the 70 level. Therefore, I’ve decided to skip this trade, as weekly timeframe setups generally take longer to play out. I will provide a more precise outlook once clearer reversal signals appear.
MeeCoin
[BTCUSDT] is preparing for a potential reversal
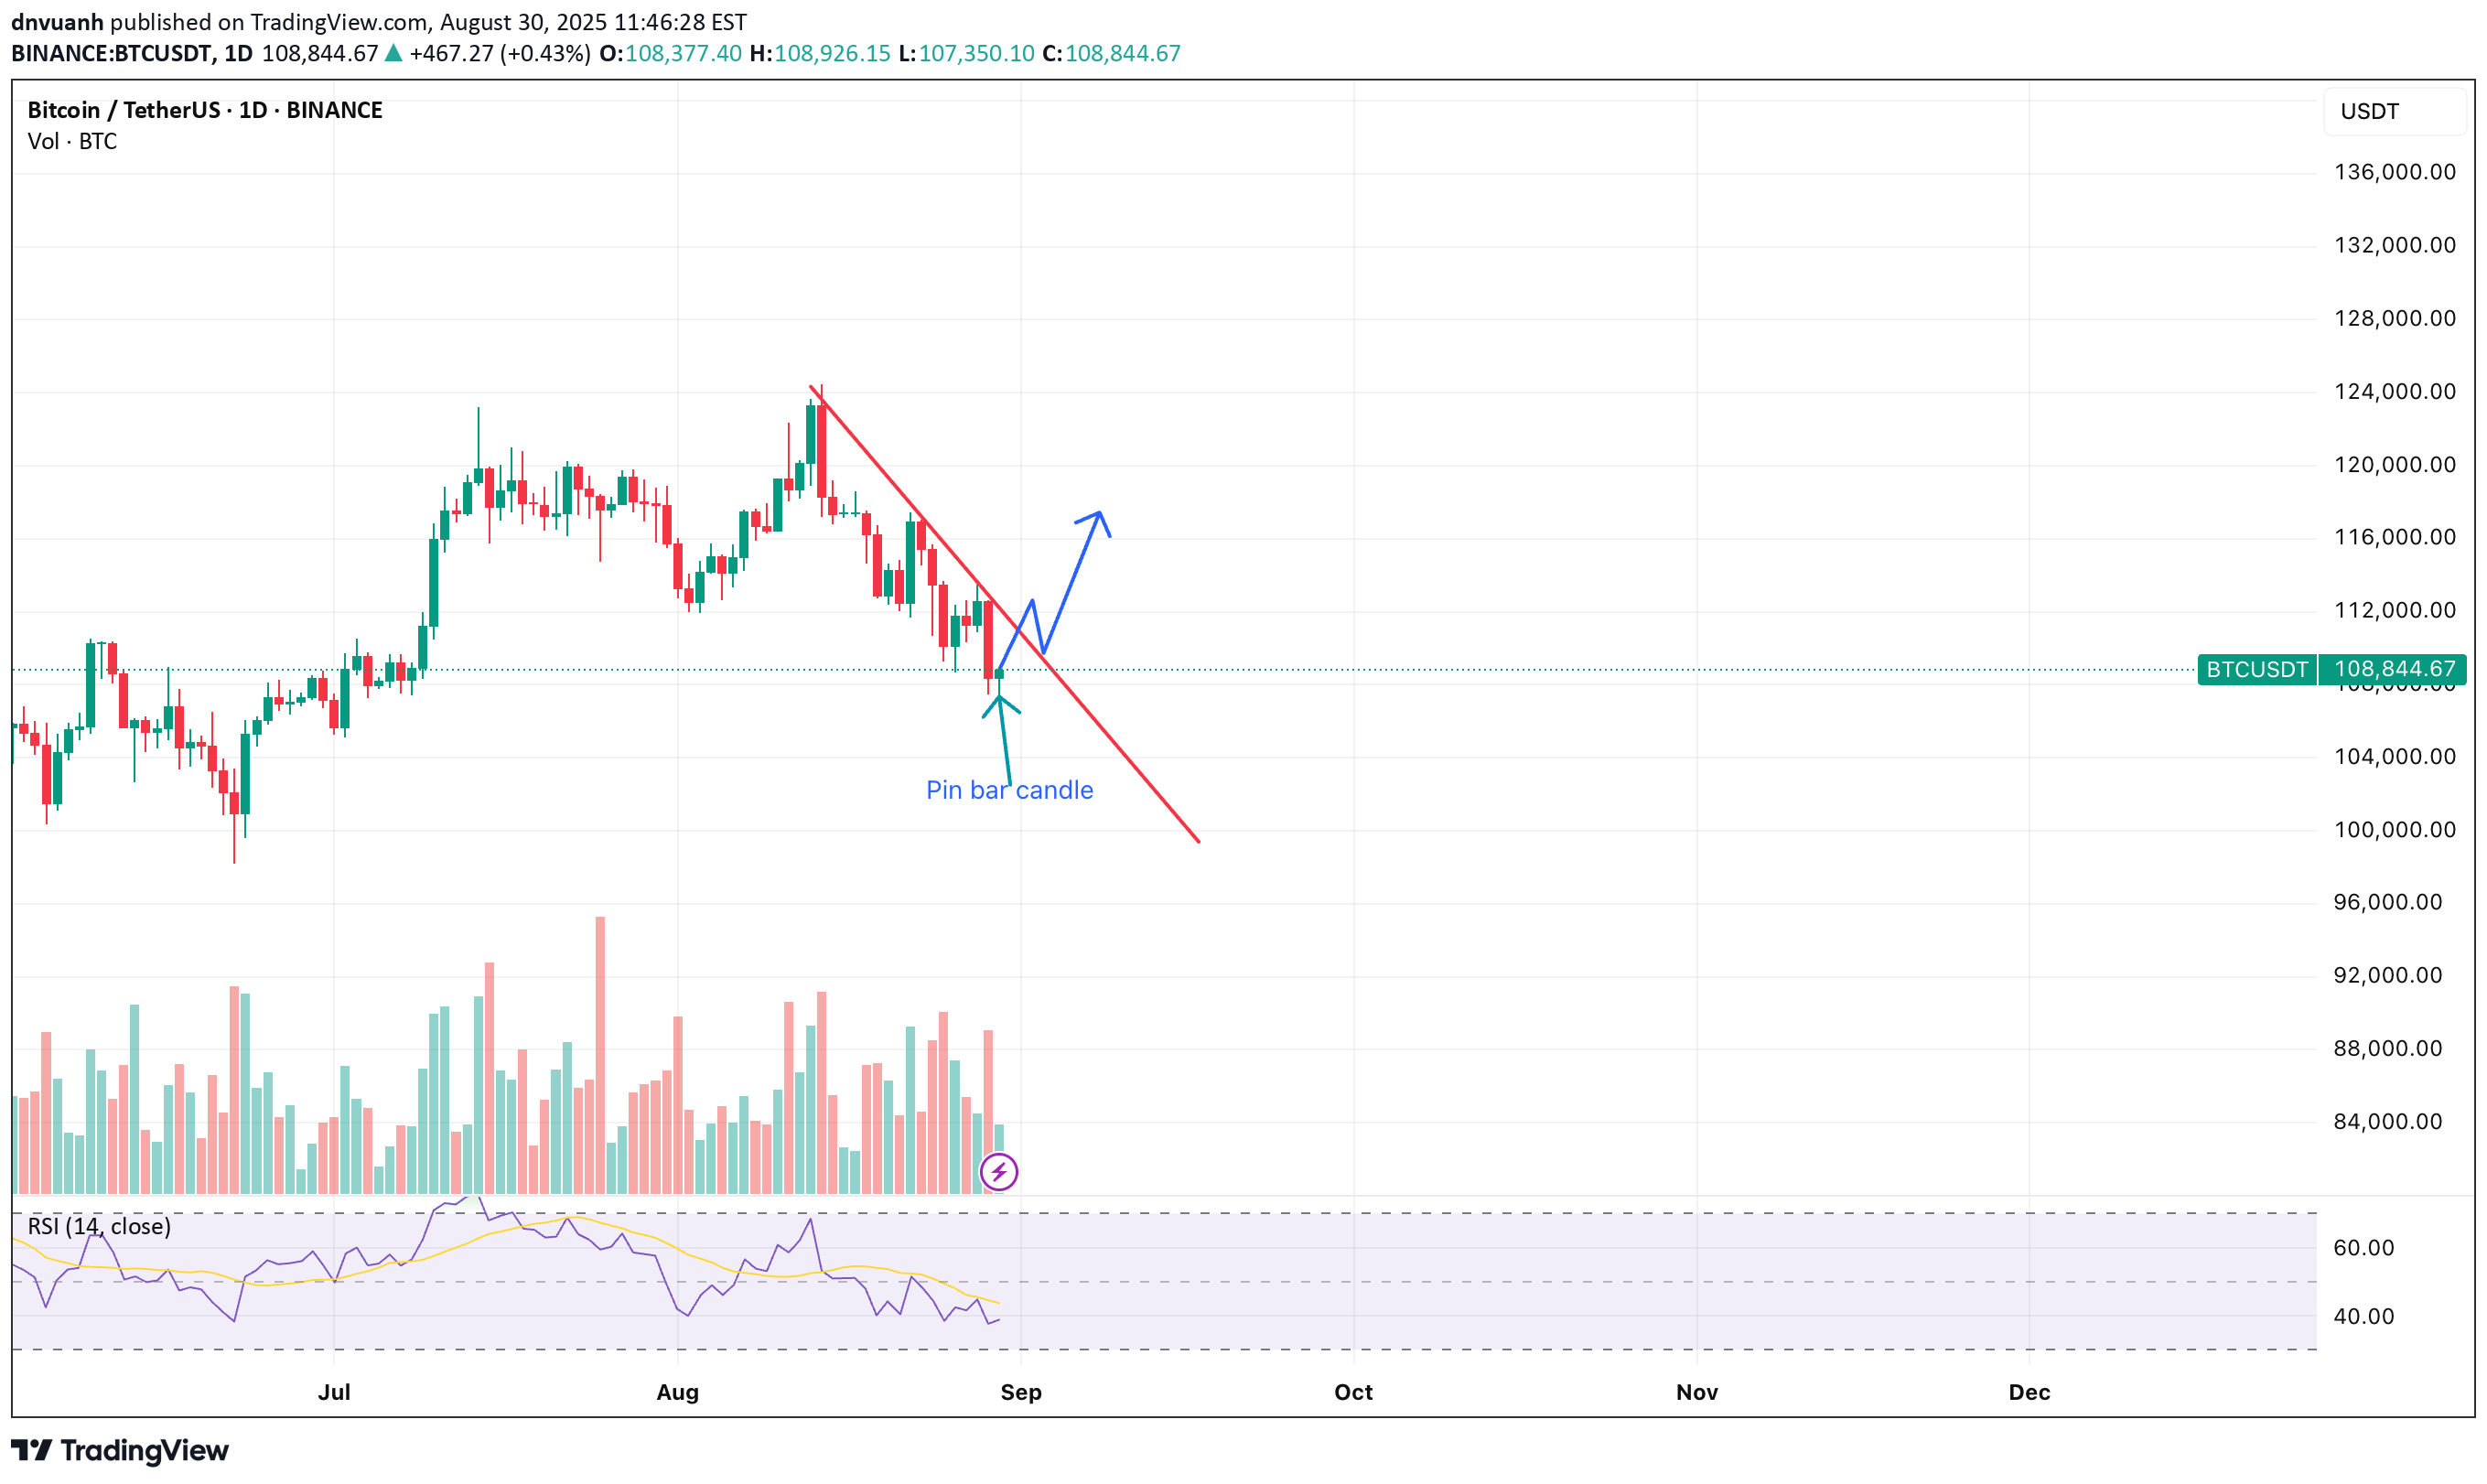
On the daily chart, BTC is currently forming a pin bar candlestick, signaling the possibility of a trend reversal. If no new selling pressure emerges within the next 8 hours, I expect BTC to confirm the pin bar close and break above the downtrend line. In this scenario, the price could rebound toward the 117k area before establishing a new trend. Before the daily candle closes, investors should carefully observe whether fresh selling pressure appears. This analysis is for reference only and should not be considered as financial advice.Update 1: BTC has moved as expected, breaking out of the descending trendline. However, selling pressure emerged on September 30th, forming a red daily candle that caused a slight deviation in price action. I recommend exercising proper risk management to remain in a safe zone. I am currently watching for a potential long entry if BTC retests the descending trendline, which could occur in the $118,000–$118,200 area.Apologies for the confusion in my previous note — the intended support level was 108k–108.2k, not 118k–118.2k. With the upcoming Fed interest rate announcement, I decided to close 40% of my spot position at 116.4k. I will wait for the news before making a decision on the remaining position. Since my current entry is already showing a solid profit, I will stop updating here. Wishing you all good health and success!
MeeCoin
[LONG][XRPUSDT] prepare for next bull run ?
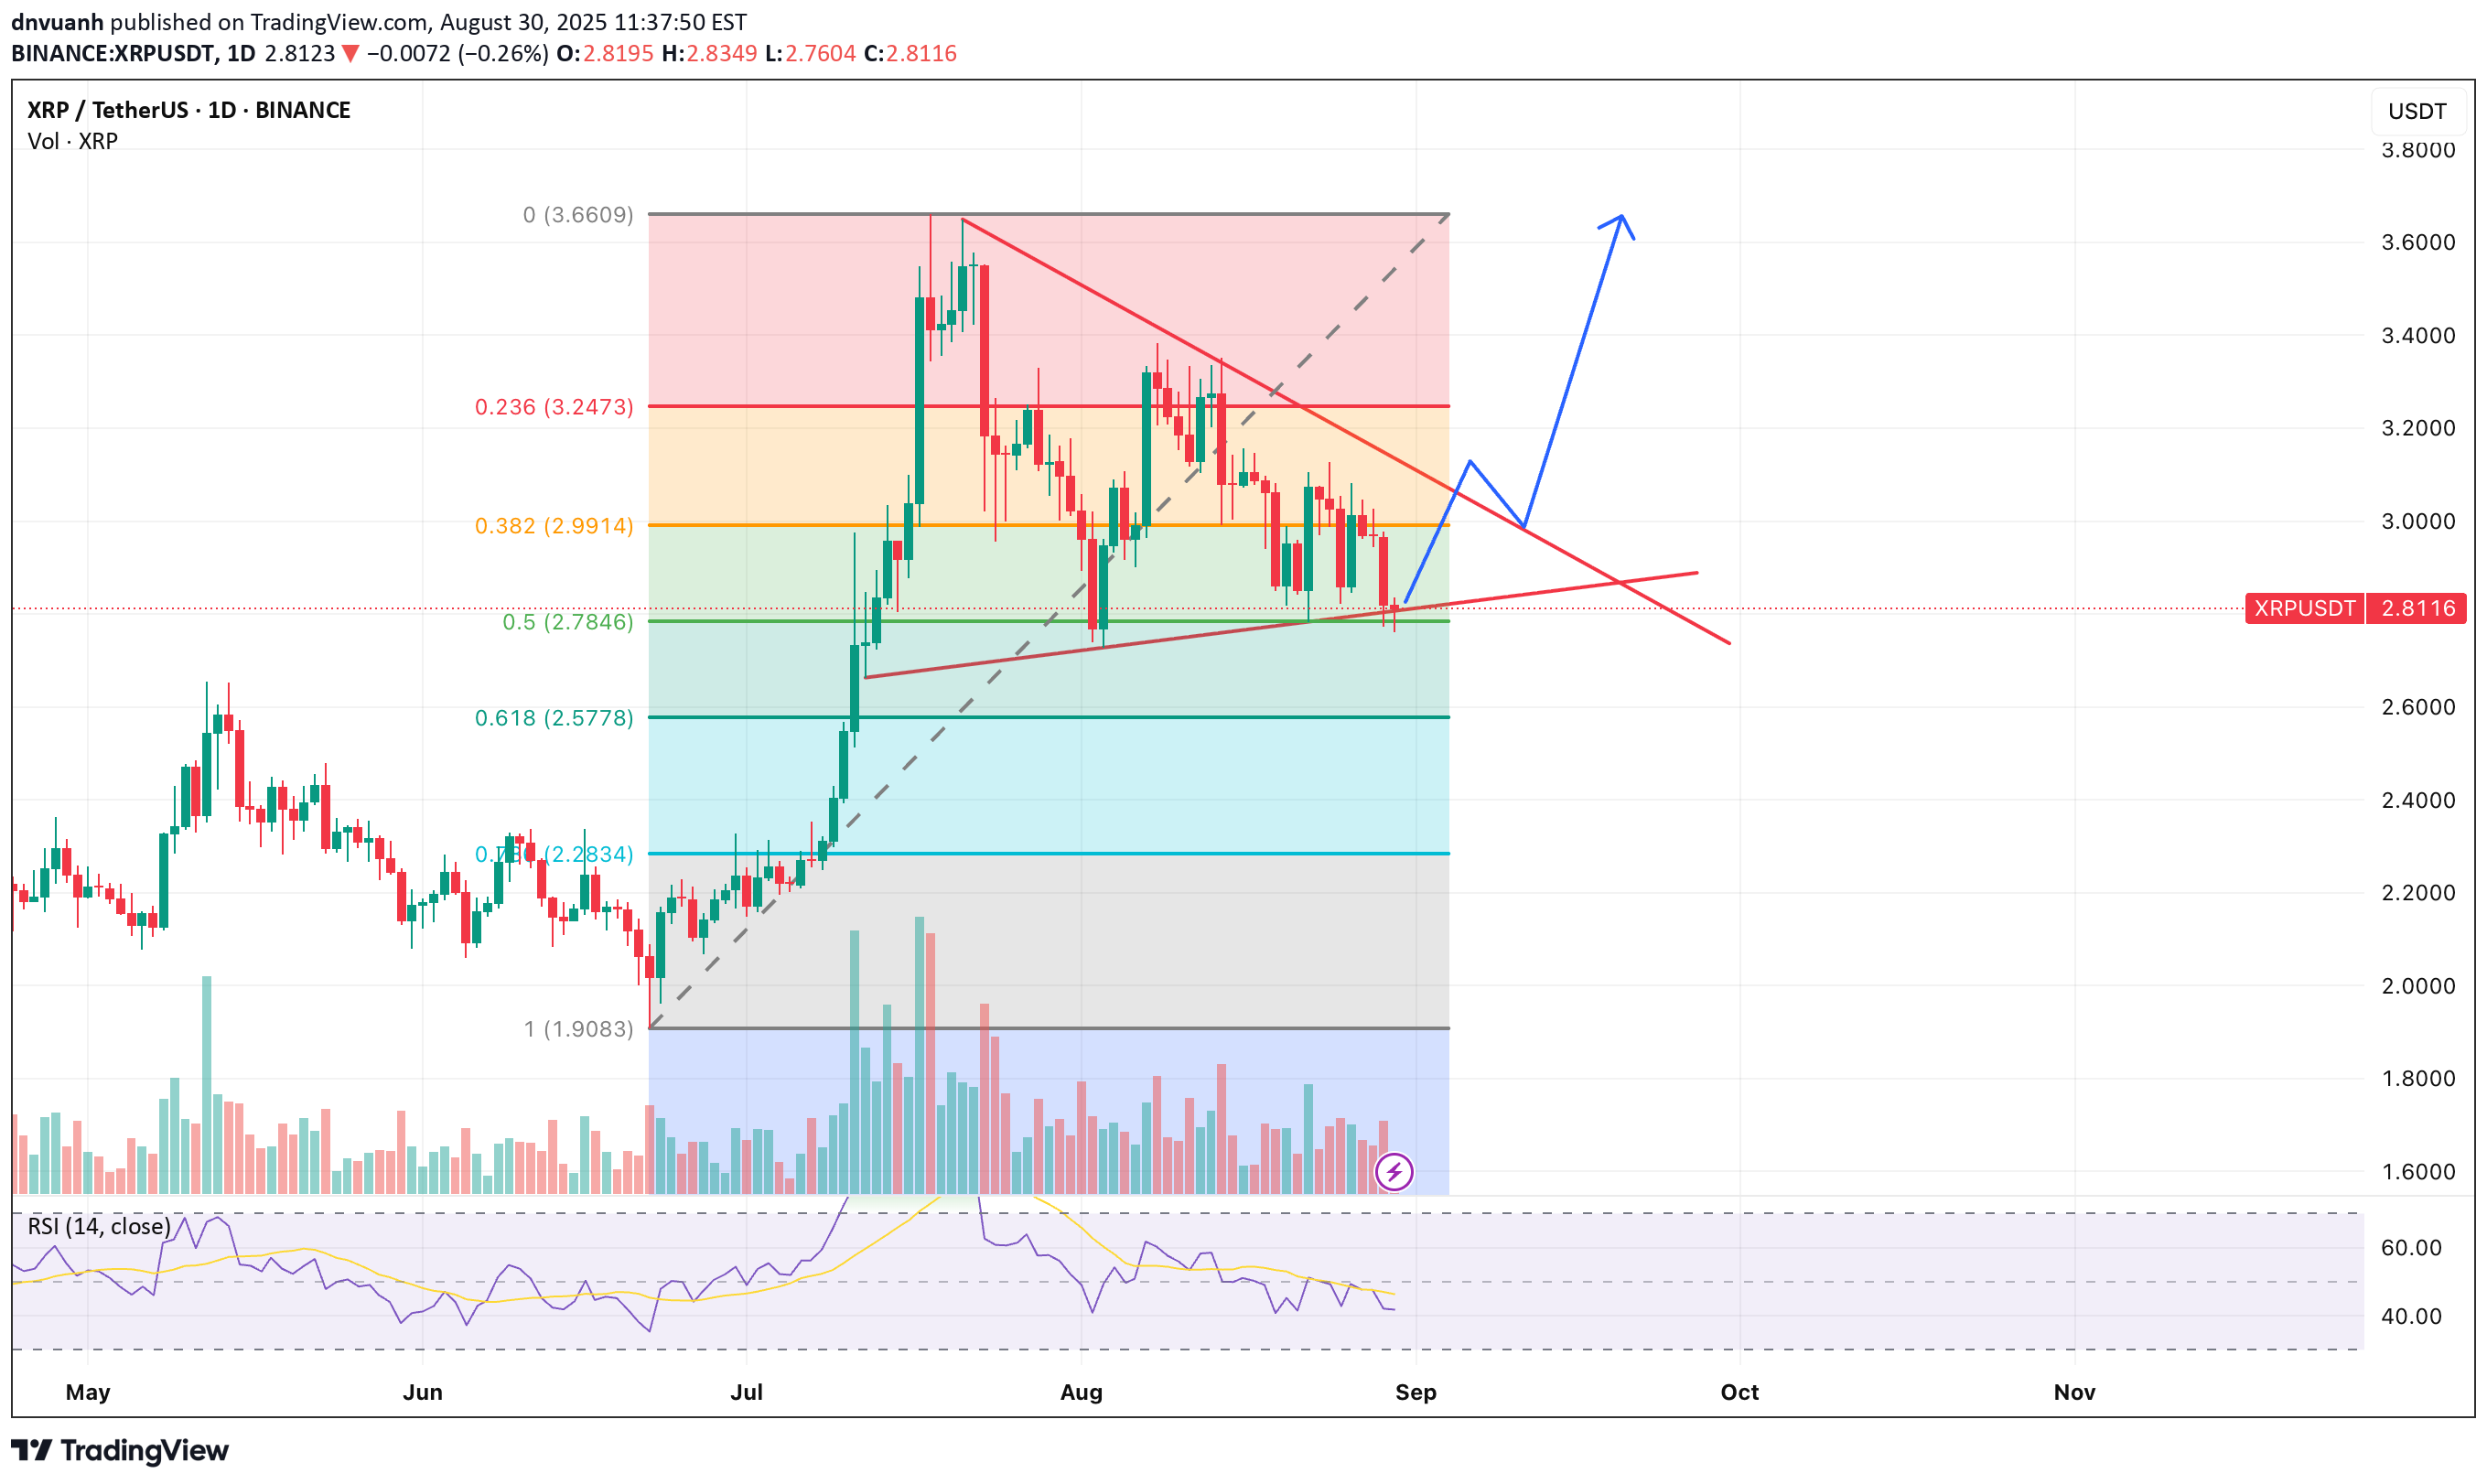
XRP has likely completed its corrective phase following the recent upward movement. The price is currently supported by the 0.5 Fibonacci retracement level and the lower boundary of the triangle pattern, indicating potential momentum for a breakout above the upper boundary and a continuation into the next bullish phase. Note: Investors should closely monitor the BTCUSDT pair. A reversal candlestick pattern is emerging, and in the absence of significant new selling pressure, BTC may confirm a trend reversal, which could trigger renewed bullish momentum across altcoins.Update 1: XRPUSDT XRP has rallied to the $3 level and is currently testing resistance at the descending trendline. Trading volume remains weak, and price has yet to break through the trendline. I will wait for 1–2 more candles before making a decision. If price fails to break the trendline, I will cut my position and wait for another breakout attempt. Sometimes you have to accept smaller profits in order to manage risk effectively.
Disclaimer
Any content and materials included in Sahmeto's website and official communication channels are a compilation of personal opinions and analyses and are not binding. They do not constitute any recommendation for buying, selling, entering or exiting the stock market and cryptocurrency market. Also, all news and analyses included in the website and channels are merely republished information from official and unofficial domestic and foreign sources, and it is obvious that users of the said content are responsible for following up and ensuring the authenticity and accuracy of the materials. Therefore, while disclaiming responsibility, it is declared that the responsibility for any decision-making, action, and potential profit and loss in the capital market and cryptocurrency market lies with the trader.