
MR_gold2
@t_MR_gold2

What symbols does the trader recommend buying?
Purchase History
پیام های تریدر
Filter
MR_gold2
تحديث الذهب
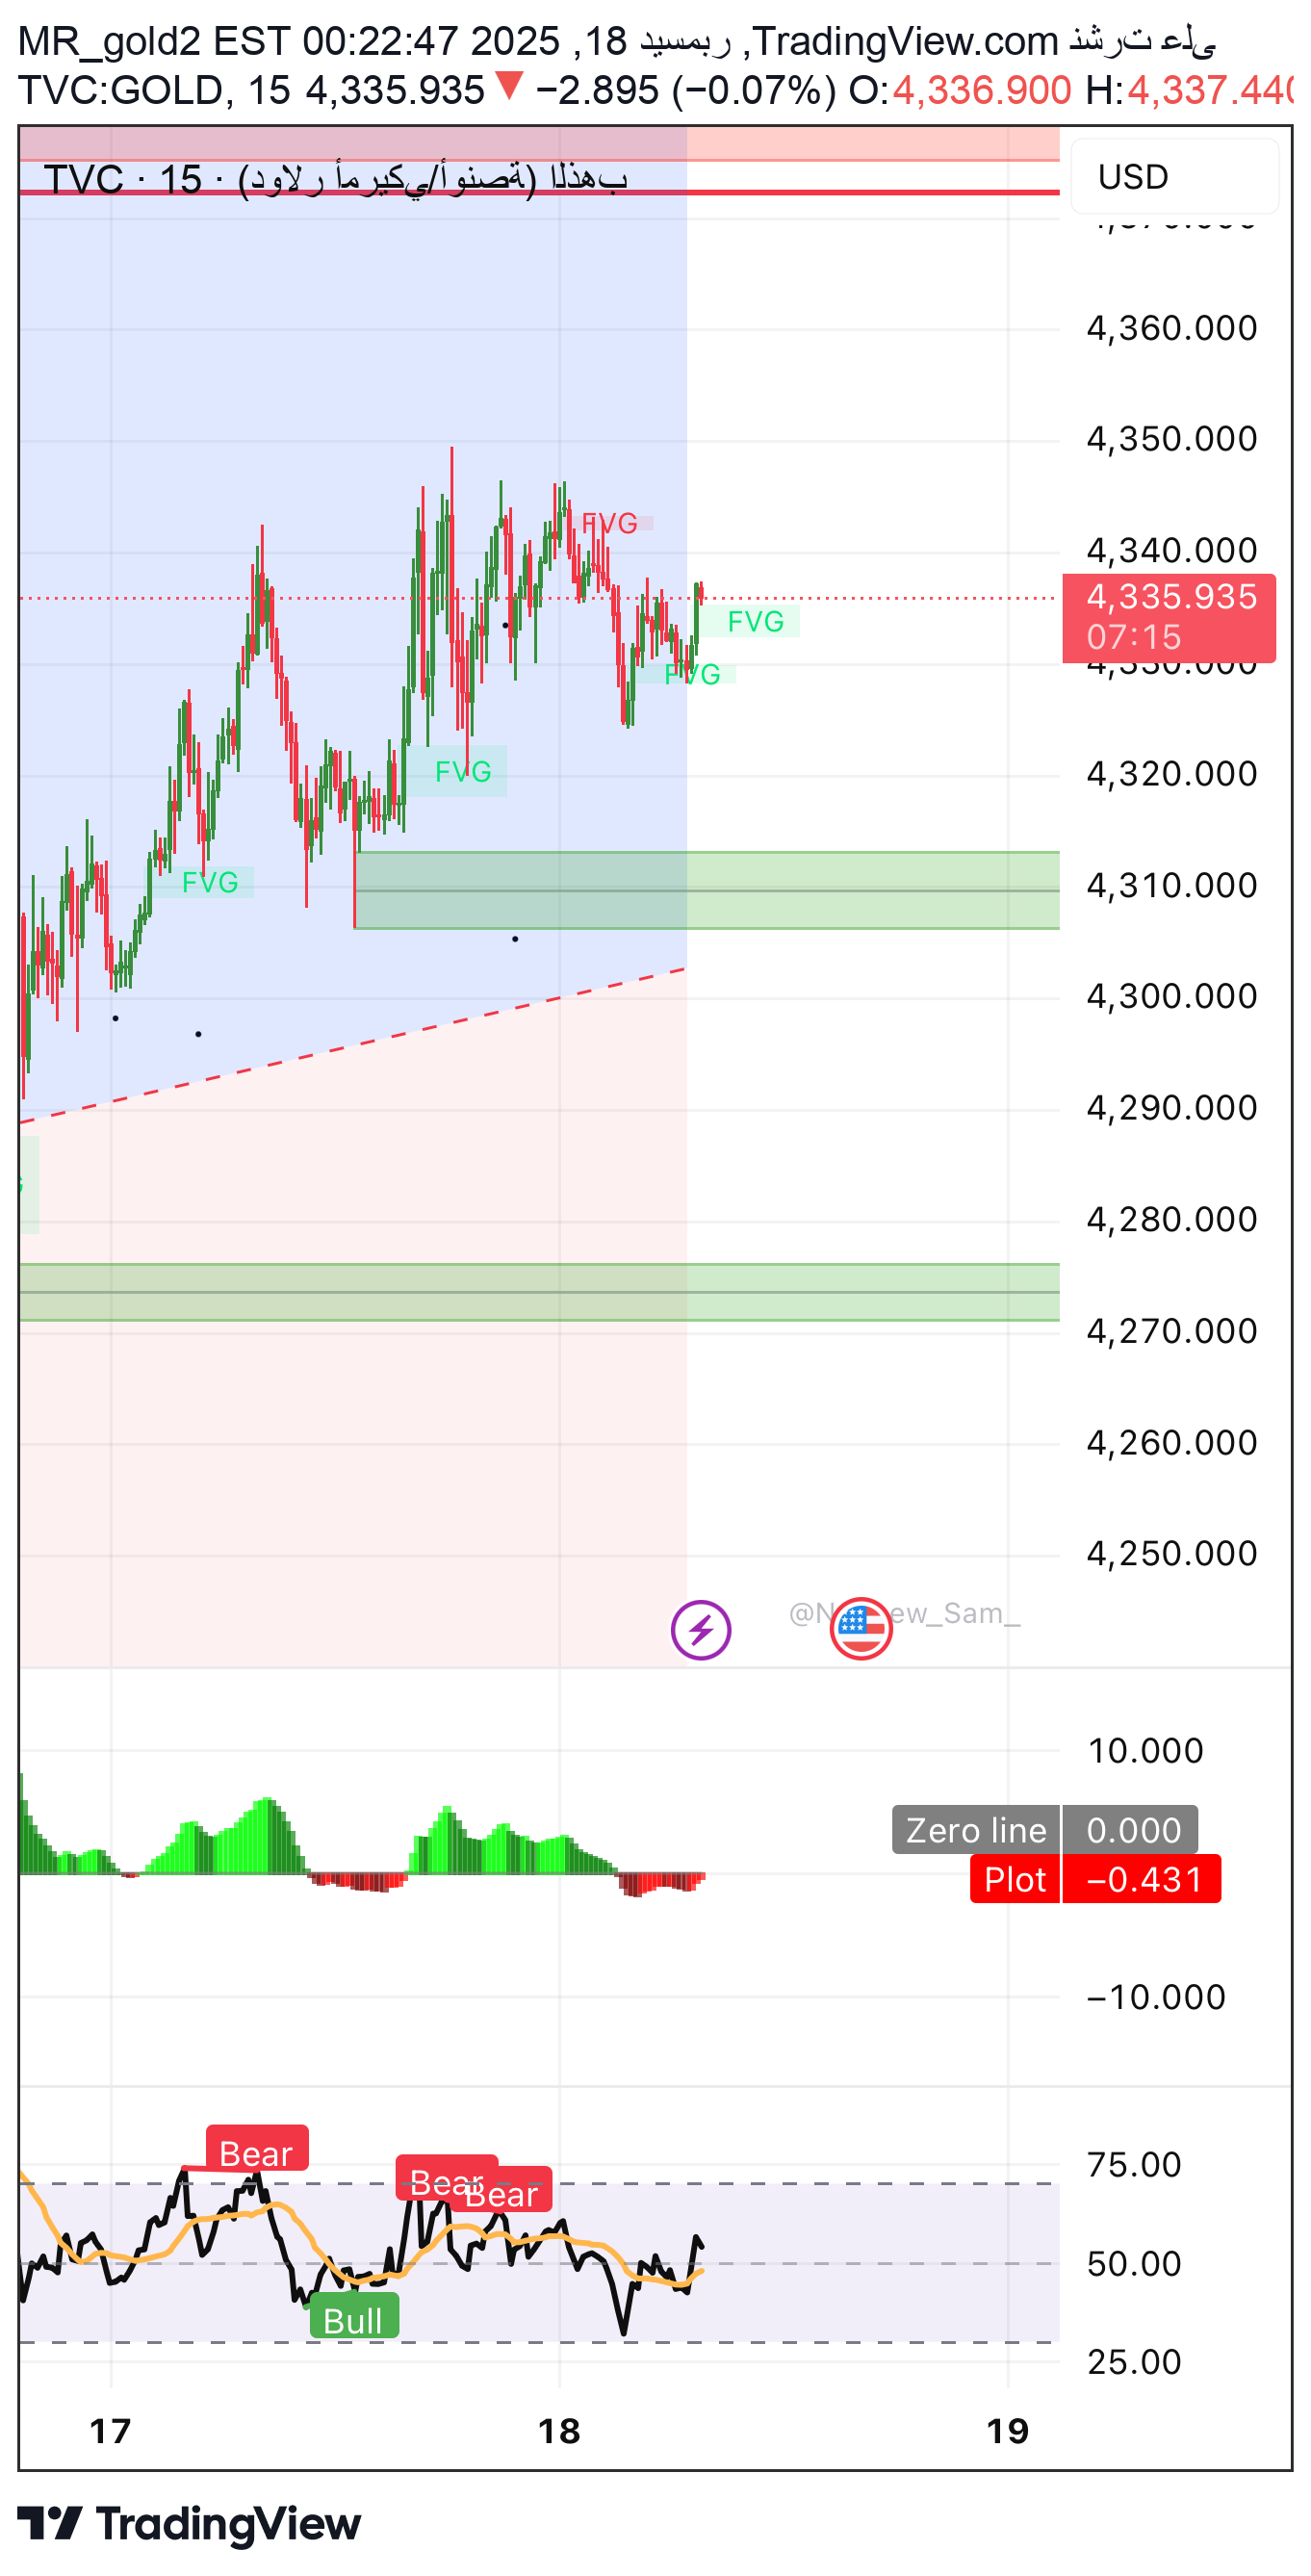
⸻ 1) General situation and trend •Larger trend (4h): Bullish within an ascending channel but the price is currently in a downward correction within the channel (distribution/profit taking area near the top). •Near term (1h-15m): fluctuation/accumulation with attempts to rise met with strong offers near 4335-4345. ⸻ 2) Technical analysis •The price moves between: Upper resistors: 4335–4345 then 4355–4372 •Intermediate support: 4310–4300 •Deeper support: 4285 then 4265–4255 (clear demand area on the chart) •The presence of an upper supply area (red rectangle) makes the rise “conditional” on a clear break and stability. ⸻ 3) Price Action Nearby display areas show: Hesitation + upper tails (price rejection) •Short rises then rapid declines = buy/disposal absorption •As long as the price does not remain above 4345–4355, the possibility of it returning to supports is stronger. ⸻ 4) Supports and Resistances (S/R) Resistors: •4335–4345 (resolution area) •4355–4372 (higher resistance/top + channel ceiling) Support: •4310–4300 (first support + near FVG/focus areas) •4285 (second support) •4265–4255 (potential buy/demand area) •4240 then 4200 (in case of a clear break) ⸻ 5) Supply & Demand areas •Supply (width): 4335–4372 Suitable area for corrective selling provided a rejection/confirmation candle appears. •Demand: 4265–4255 then 4285 Areas that are likely to rebound if the price reaches them with downward momentum and begins to weaken. ⸻ 6) FVG / Fair Value Gaps •Clearly there is an upper FVG near 4335–4345 that is partially “filled” with oscillation. •The presence of FVG/lower gaps closer to support 4300 then 4285/4265 (Usually the price likes to return before the trend completes). ⸻ 7) Digital analysis (Digital / Quant) •Current behavior “digitally” is closer to: •Range/Mean Reversion within a (accumulation) range instead of a direct trend. •Entry priority is from the edges: •Sell from the edge of the offer •Buy from the edge of demand Not in the middle of the range. ⸻ 8) Wave analysis (Elliott/Wave) •Closest reading (at 1h-4h): •Previous strong rise (impulse wave) •Then composite correction (A–B–C or WXY) within the channel •Currently, we appear to be inside wave C/or a corrective bearish wave targeting demand areas before a new upward attempt. ⸻ 9) Time analysis •The current movement suggests a cycle: Impulse → Oscillation → False break/test → Strong movement •Temporally: It is best to wait for the hourly candle to close at the decision areas: •Above 4355 = bullish confirmation •Below 4300 = bearish confirmation ⸻ 10) Indicators (RSI/MACD as shown) •RSI: It moved from areas of strength to decline, which supports the idea of a correction. •MACD: Weak momentum/negative breakout with the previous decline, then an inconclusive recovery attempt. •Conclusion: The indicators support two scenarios based on breaking the levels. ⸻ 11) Technical models (Chart Patterns) On small frames the behavior appears: •Rising channel + internal correction •Possibility of a short triangle/wedge (fluctuation before the explosion) ⸻ 12) Harmonic models •Near the area 4335–4372, an environment suitable for: •Bearish Gartley/Butterfly possible (if completed with your measurements on the chart) Harmonic confirmation can only be done when: •Strong rejection from PRZ + break of nearby support (eg 4310/4300) ⸻ 13) Fixation Points — How do you identify them quickly? fix point = a level that has proven itself 3 or more times across: 1.A clear top/bottom 2. Retest (Touch) 3. A candle closes near it or a strong bounce Your badge currently has candidate mounts: •4335–4345 (top mount) •4300–4310 (middle mount) •4255–4265 (bottom mount/order) ⸻ 14) Pivot Zone •Nearest daily/pivot price pivot: 4310–4330 Any stability above it tends to be positive, and breaking it activates negativity towards 4285 and then 4265. ⸻ 15) Recommendation (clear scenarios) This is educational analytical content and not financial advice. The decision and risk management is yours. ✅ Sell scenario (strongest if a reversal signal appears) •Sell: 4340–4345 •SL: 4355 (for “very close” or “safe” stop) •TP1: 4310–4300 •TP2: 4285 • ✅ Purchase scenario (only on condition) • Buy from 4265–4255 or after a breakout and stability above 4355 • Its targets are towards 4335 then 4372.
MR_gold2
تحديث ذهب
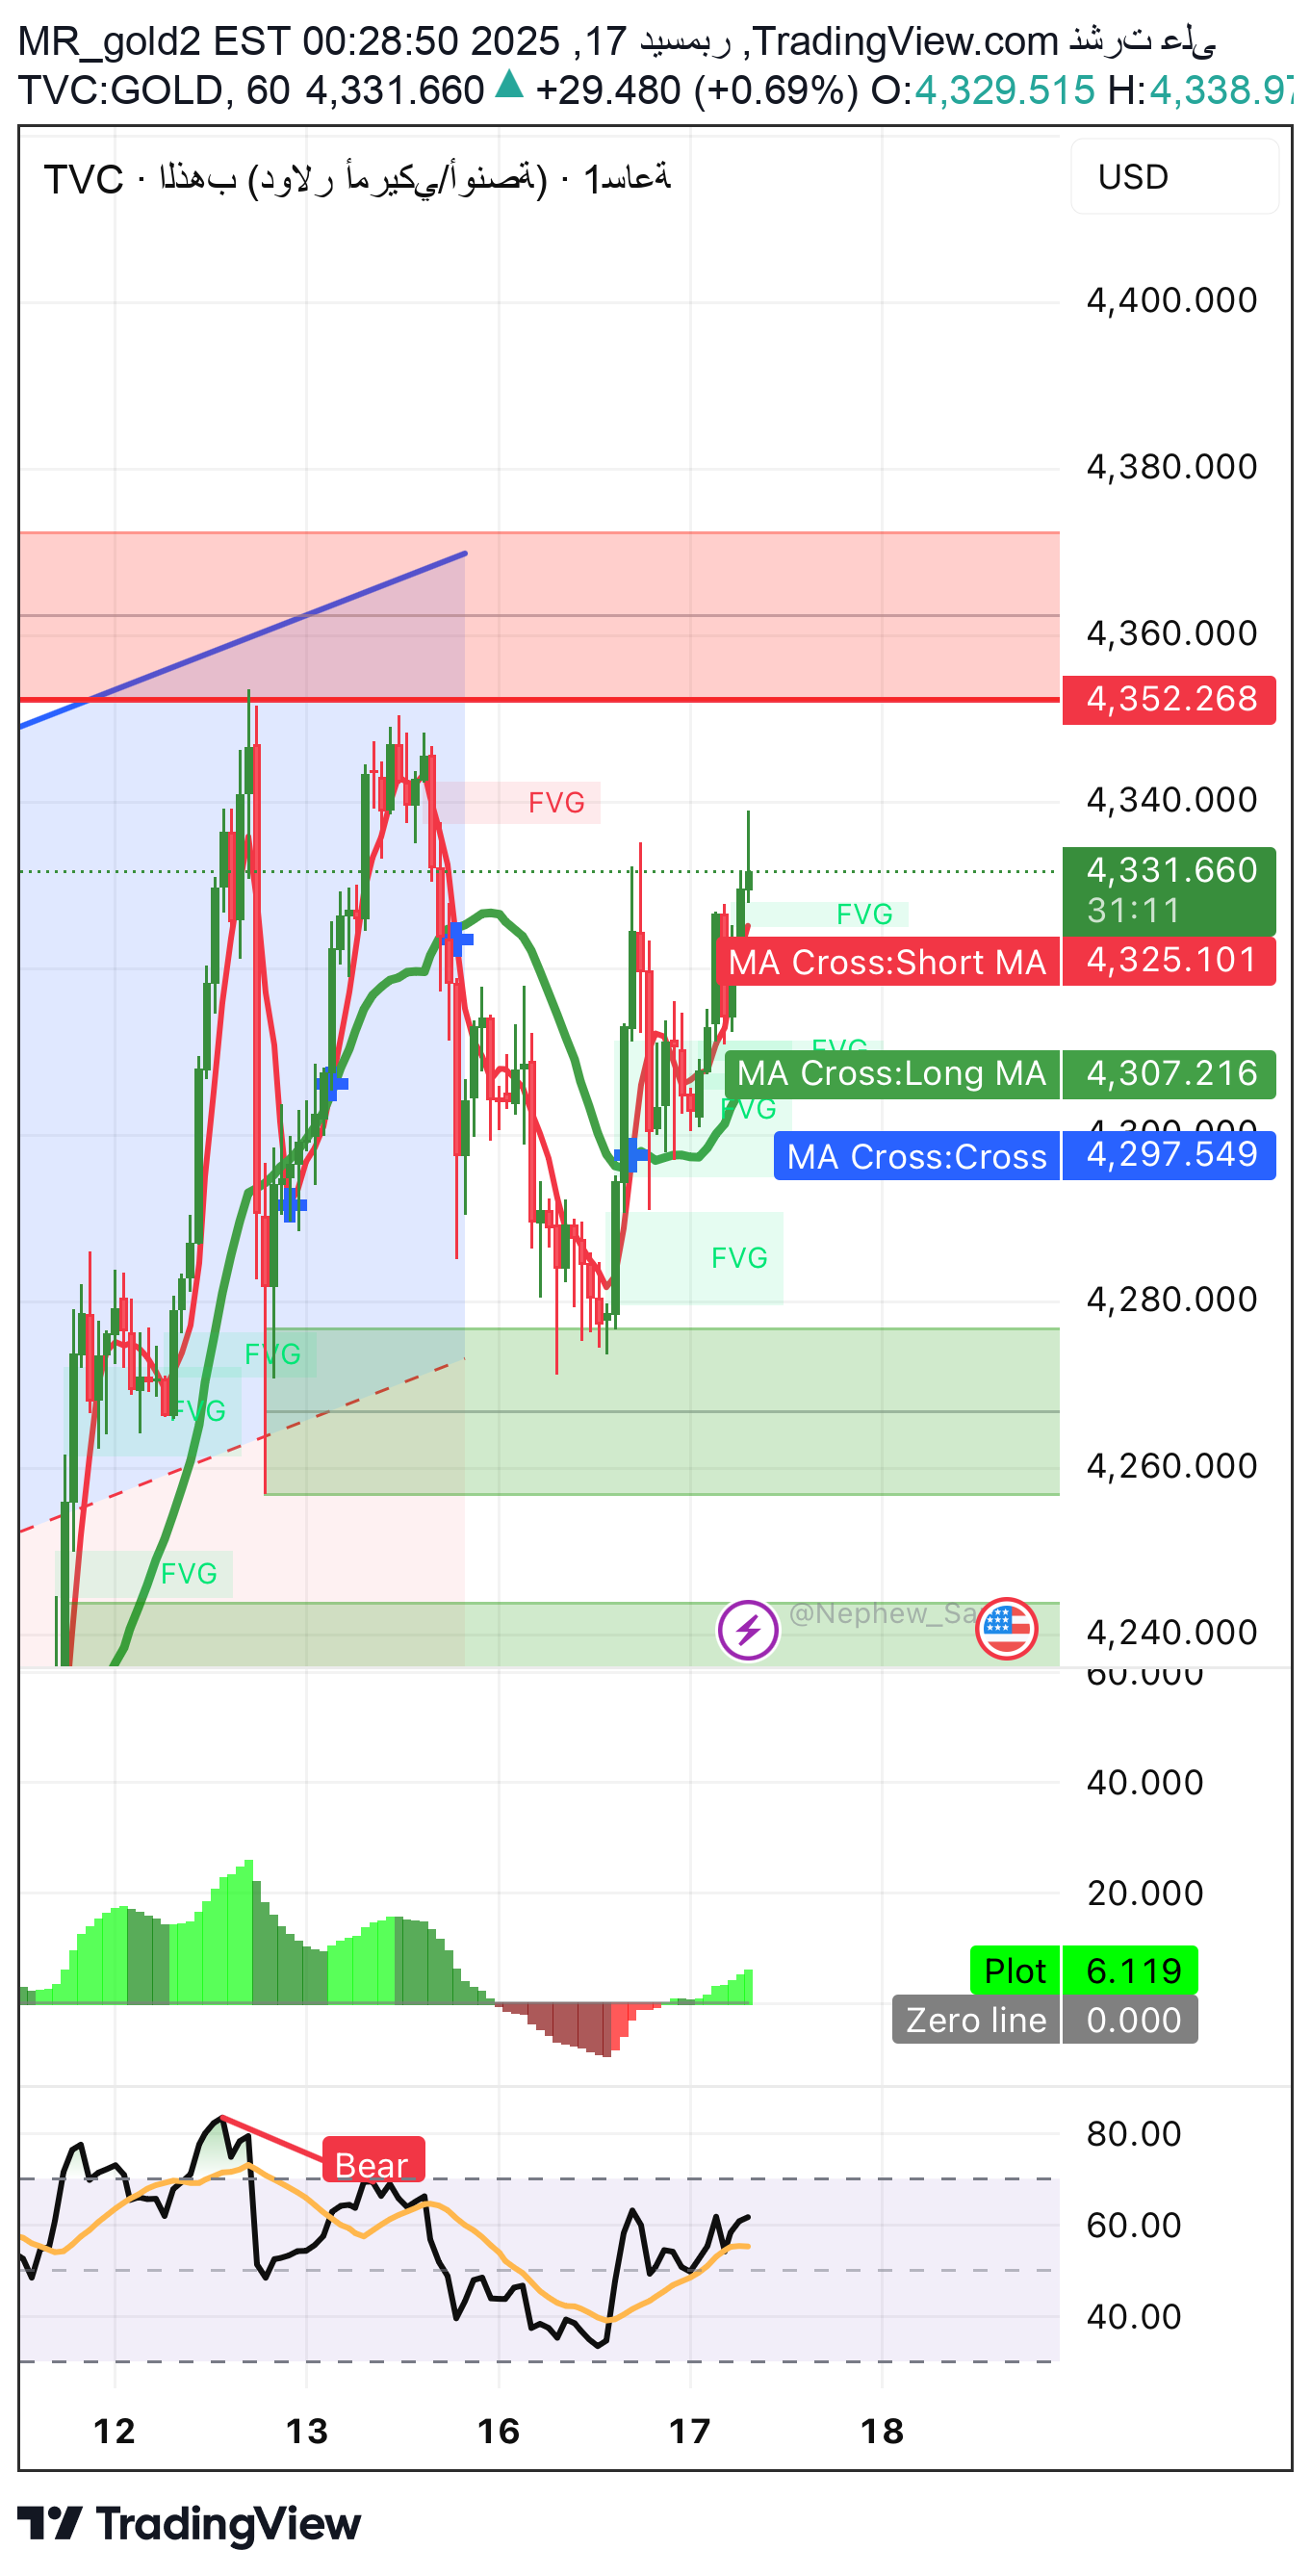
I sent you a video of Gold's analysis yesterday, before the news I told you that the news will be positive and gold will rise in regions 4275 towards 4350 I hope everyone bought First: Technical Analysis •The general trend on the 1-hour and 4-hour frames is still bullish within a price channel. •The price is currently below strong resistance and within the FVG + supply area. •A clear failure to close above 4328 – 4335. •Moving averages: ◦Price is above the long MA → the general trend is up ◦But weak momentum after a rapid rise (possible correction) • 🔹 Elliott Wave Analysis •The recent rise is likely to be: ◦Complete impulse wave (Wave 5) ◦Or the C end of the ABC model • Current movement = corrective wave (A or 1 down) 📌 This supports the idea of corrective selling and not reversing the general trend. 🔹 Time Analysis •The current time is near: ◦Short-term reversal point in time • •We often see: ◦Correction of 30 to 60 points before any upward continuation • 🔹 Digital Analysis (Digital / Momentum) •The positive momentum is starting to weaken •MACD: ◦Decrease in green columns • •RSI: ◦It broke from overbought saturation and fluctuates below 60➡️, a sign of weak buying • 🔹Fundamental analysis •There is no strong news supporting the breakthrough currently •Any calm in the news = an opportunity for a natural technical correction •The general trend for gold is still positive, but the correction is healthy 🔹 Price Action Clear bottom rejection candles: ◦Display area ◦FVG upper • •There is no strong close above the resistance➡️ Negative short-term price behavior 🔹 Supports and resistances 🔴 Resistors: •4330 – 4345 (strong supply area) •4370 (channel top) 🟢Supports: •4290 – 4280 (momentary support) •4265 (important installation area) •4240 – 4225 (strong demand) 🔹 Supply and demand areas •Very strong display: 4320 – 4350 •Active order: 4260 – 4240 🔹 Fixation Points •4320: Ascension failure point •4265: Decision point (breaking it = downward acceleration) 🔹 Pivot Zone Current pivotal area: ◦4295 – 4305 • •Trading below it = selling advantage 🔹 Technical models •Rising wedge broken down (small frame) •Failed to retest 🔹 Harmonic patterns (possible) Bearish Gartley probability / Bat •D area within 4330 – 4350 ✅ Recommendation (Sell – Close Stop Loss) 🔻Short term sale deal: •Sell entry: 4340-4350 if a signal appears, please •Stop loss: 4355 ❌ (close and safe stop) Objectives: ◦🎯 First goal: 4330 ◦🎯 Second goal: 4325 ◦🎯 Third goal: 4300 Far goal 4245• 📌 If the hour close is above 4355, do not think about selling at all
MR_gold2
تحديث الذهب
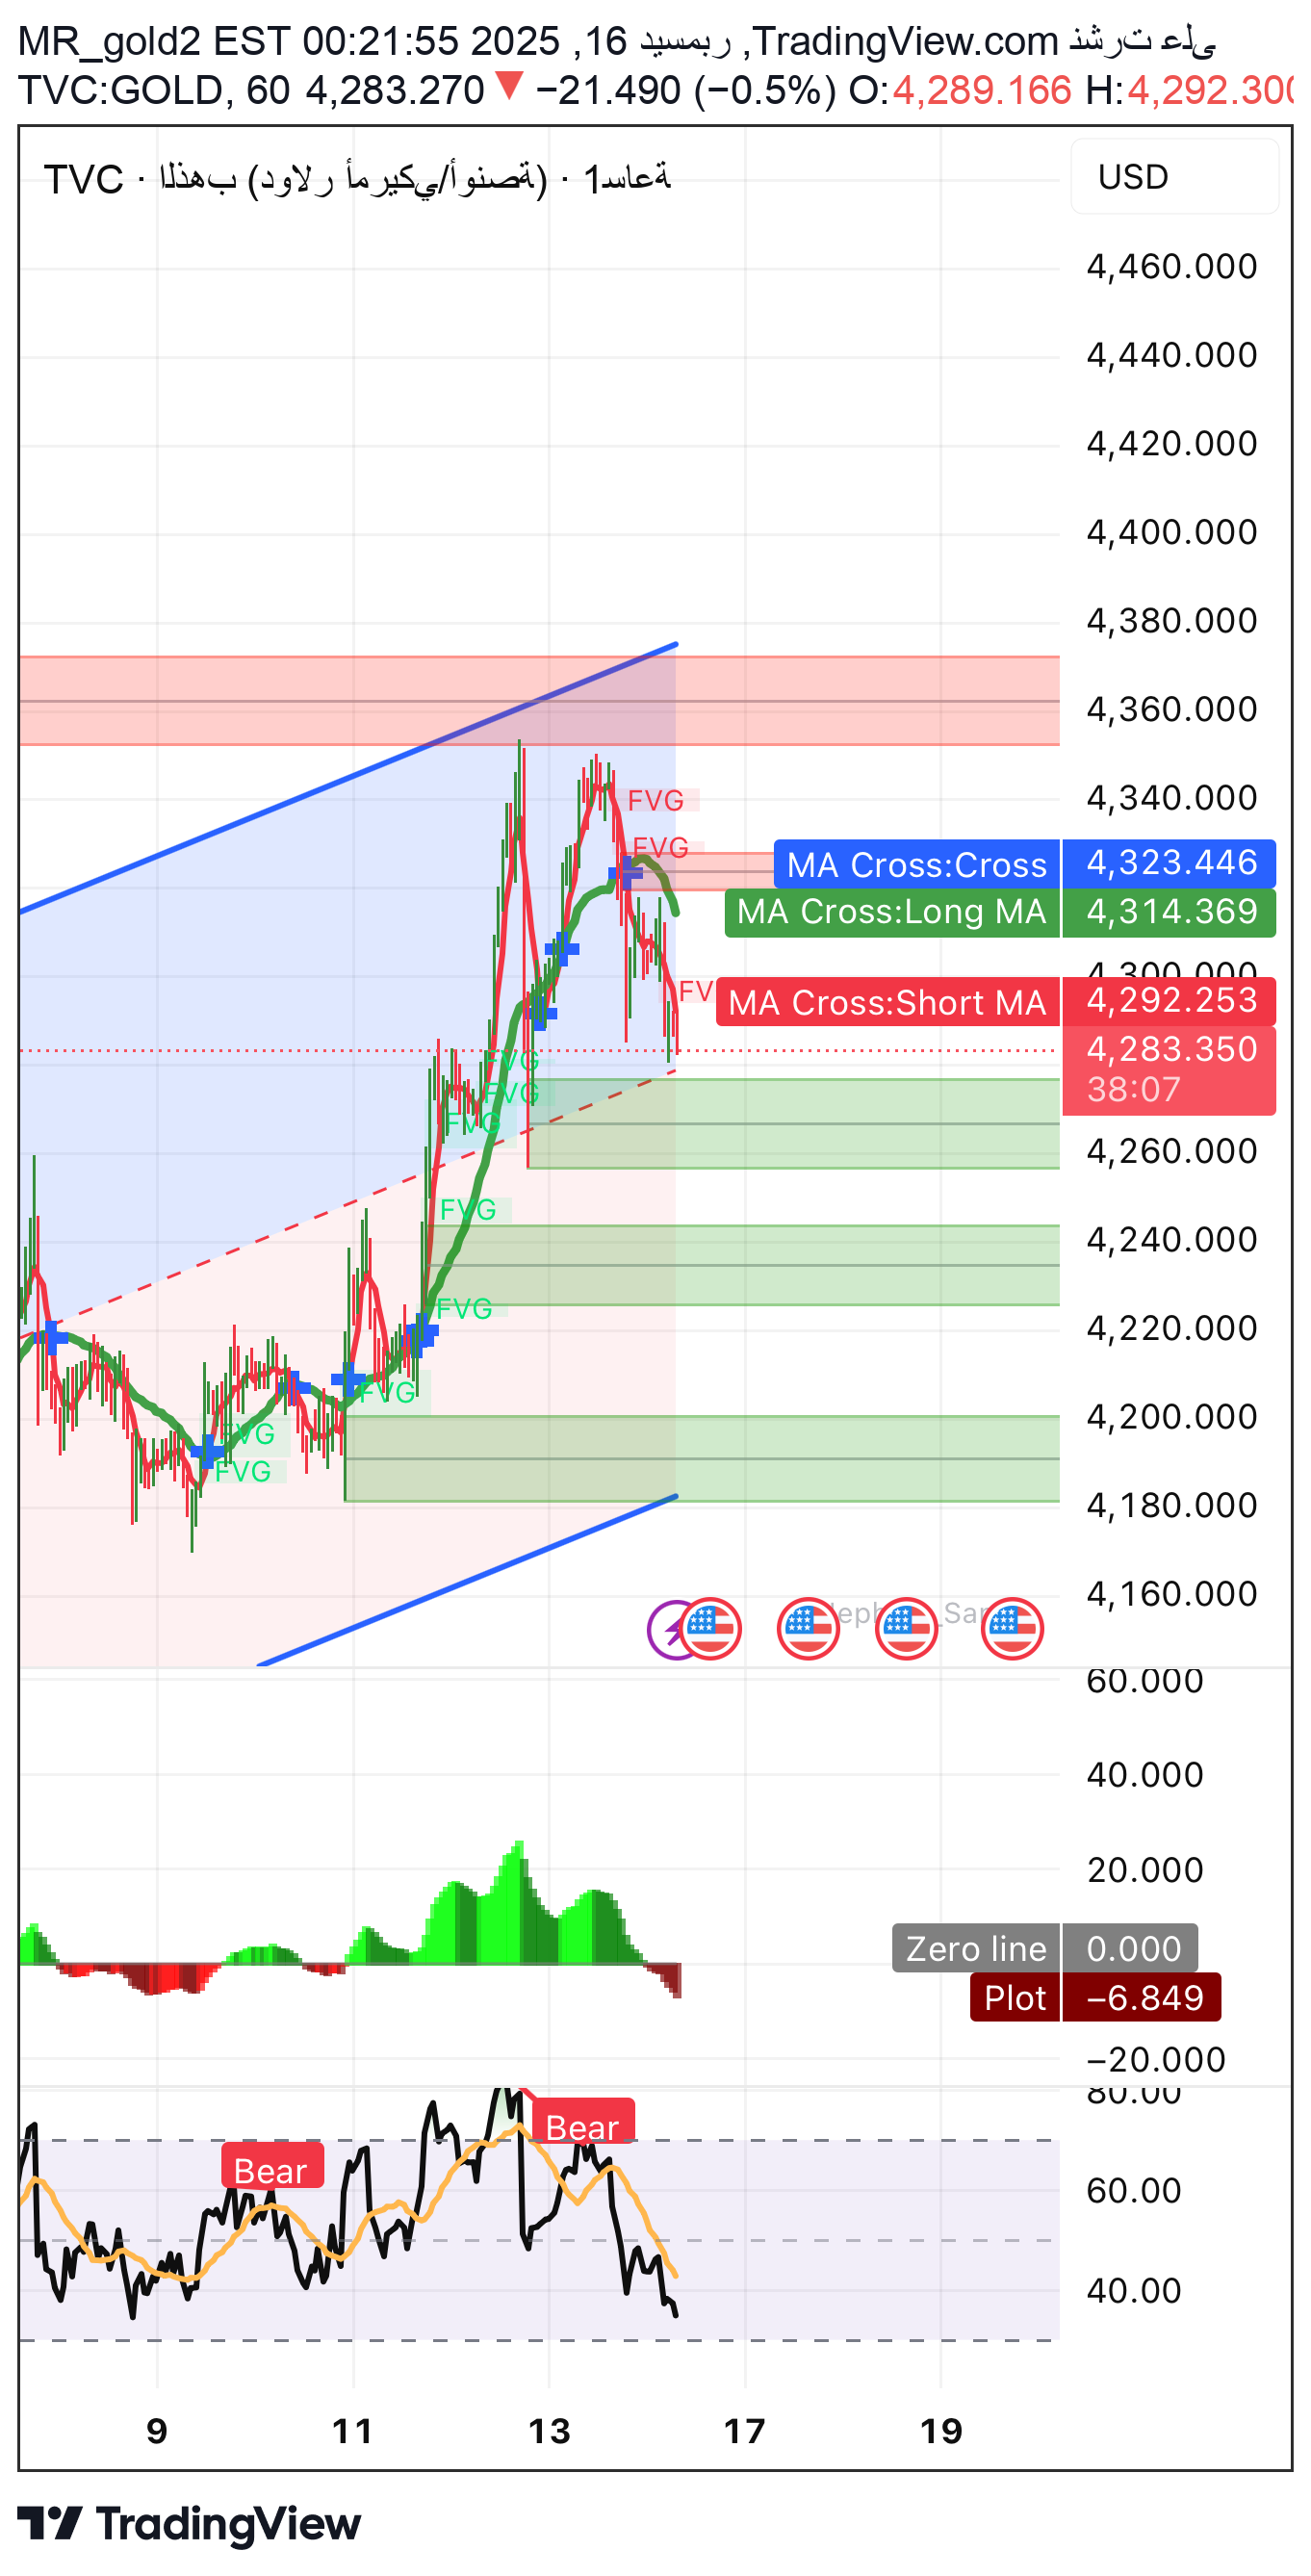
Okay, this is a comprehensive and updated analysis of gold (XAUUSD) based on the last image and the hourly frame (H1), and in the same copyable text format: ⸻ 📊 Technical Analysis •The price is still within an ascending channel on the larger frame, but is currently moving in a downward correction from the upper border. •MA Cross Negative: short average below long → instantaneous selling pressure. •Trading below the average congestion area (±4300) confirms weak upward momentum. ⸻ 🌊 Elliott Wave Analysis •The recent rise is likely to be a completed fifth wave within the uptrend. •The current decline = corrective wave (ABC): •A primary landing •B Weak bounce •C running landing •Breaking the bottom of C opens the way for a deeper correction before completing the general trend. ⸻ ⏱️ Time Analysis •The price is in a time reversal window after the top is completed. •The coming hours are crucial: •Stability above support = slowing down •Breaking support = corrective acceleration ⸻ 🔢 Digital Analysis (Digital / Fibonacci) The current correction targets: •38.2% then 50% Fibonacci of the ascending wave. •Digital convergence between Fibo + demand areas increases the possibility of a temporary bounce. ⸻ 📰 Fundamental Analysis •There is no news supporting the intraday rise now. •A state of anticipation and pressure from the dollar supports a temporary correction. •The average outlook for gold remains positive, but after completing the correction. ⸻ 🕯️ Price Action •Lower Highs. •Successive rejection candles from upper FVG areas. •The absence of a strong close above 4300 confirms sellers’ control intraday. ⸻ 🧱 Support & Resistance 🔻 Supports: •4280 – 4265 (first support + anchor point) •4245 – 4230 (strong demand area) •4200 (axial support) 🔺 Resistors: •4300 – 4320 •4350 – 4375 (display area + channel border) ⸻ 📐 Chart Patterns •Correction within an ascending channel (Pullback). •Failure of previous upper penetration (False Break). ⸻ 🔣 Digital models •Numerical weakness in rising versus falling waves. •Repeated closing failure over the same resistances. ⸻ 🦋 Harmonic models •Bearish Gartley/Butterfly completion likely near: •4320 – 4370 •The model supports the continuation of the current correction. ⸻ 🟩 Supply and demand areas •🟥Width area: 4320 – 4375 •🟩 First order area: 4245 – 4265 •🟩 Second demand area: 4200 – 4180 ⸻ 📍 Fixation Points •Top mount: 4320 •Medium fixation: 4280 •Bottom mount: 4245 Breaking any level determines the next acceleration. ⸻ 🎯 Pivot Zone •4275 – 4290 •Inside = oscillation • Below = downward continuation •Close the top = calm the correction ⸻ 🟢Trading Recommendation 🔴 Corrective selling (if signs of a reversal appear) •Sale from: 4295 – 4300 •Stop loss: above 4300 near Objectives: •🎯 4280 •🎯 4265 •🎯 4245 🟢Search for purchase (from order only): •Buy from: 4255 – 4225 •Stop loss: break 4180 Objectives: •🎯 4300 •🎯 4360 •🎯 New highs later ⸻ ✅ Conclusion •The general trend is up, but we are entering a healthy correction. •Selling is currently corrective from resistances. •Purchase only from confirmed demand areas.
MR_gold2
تحديث البتكوين

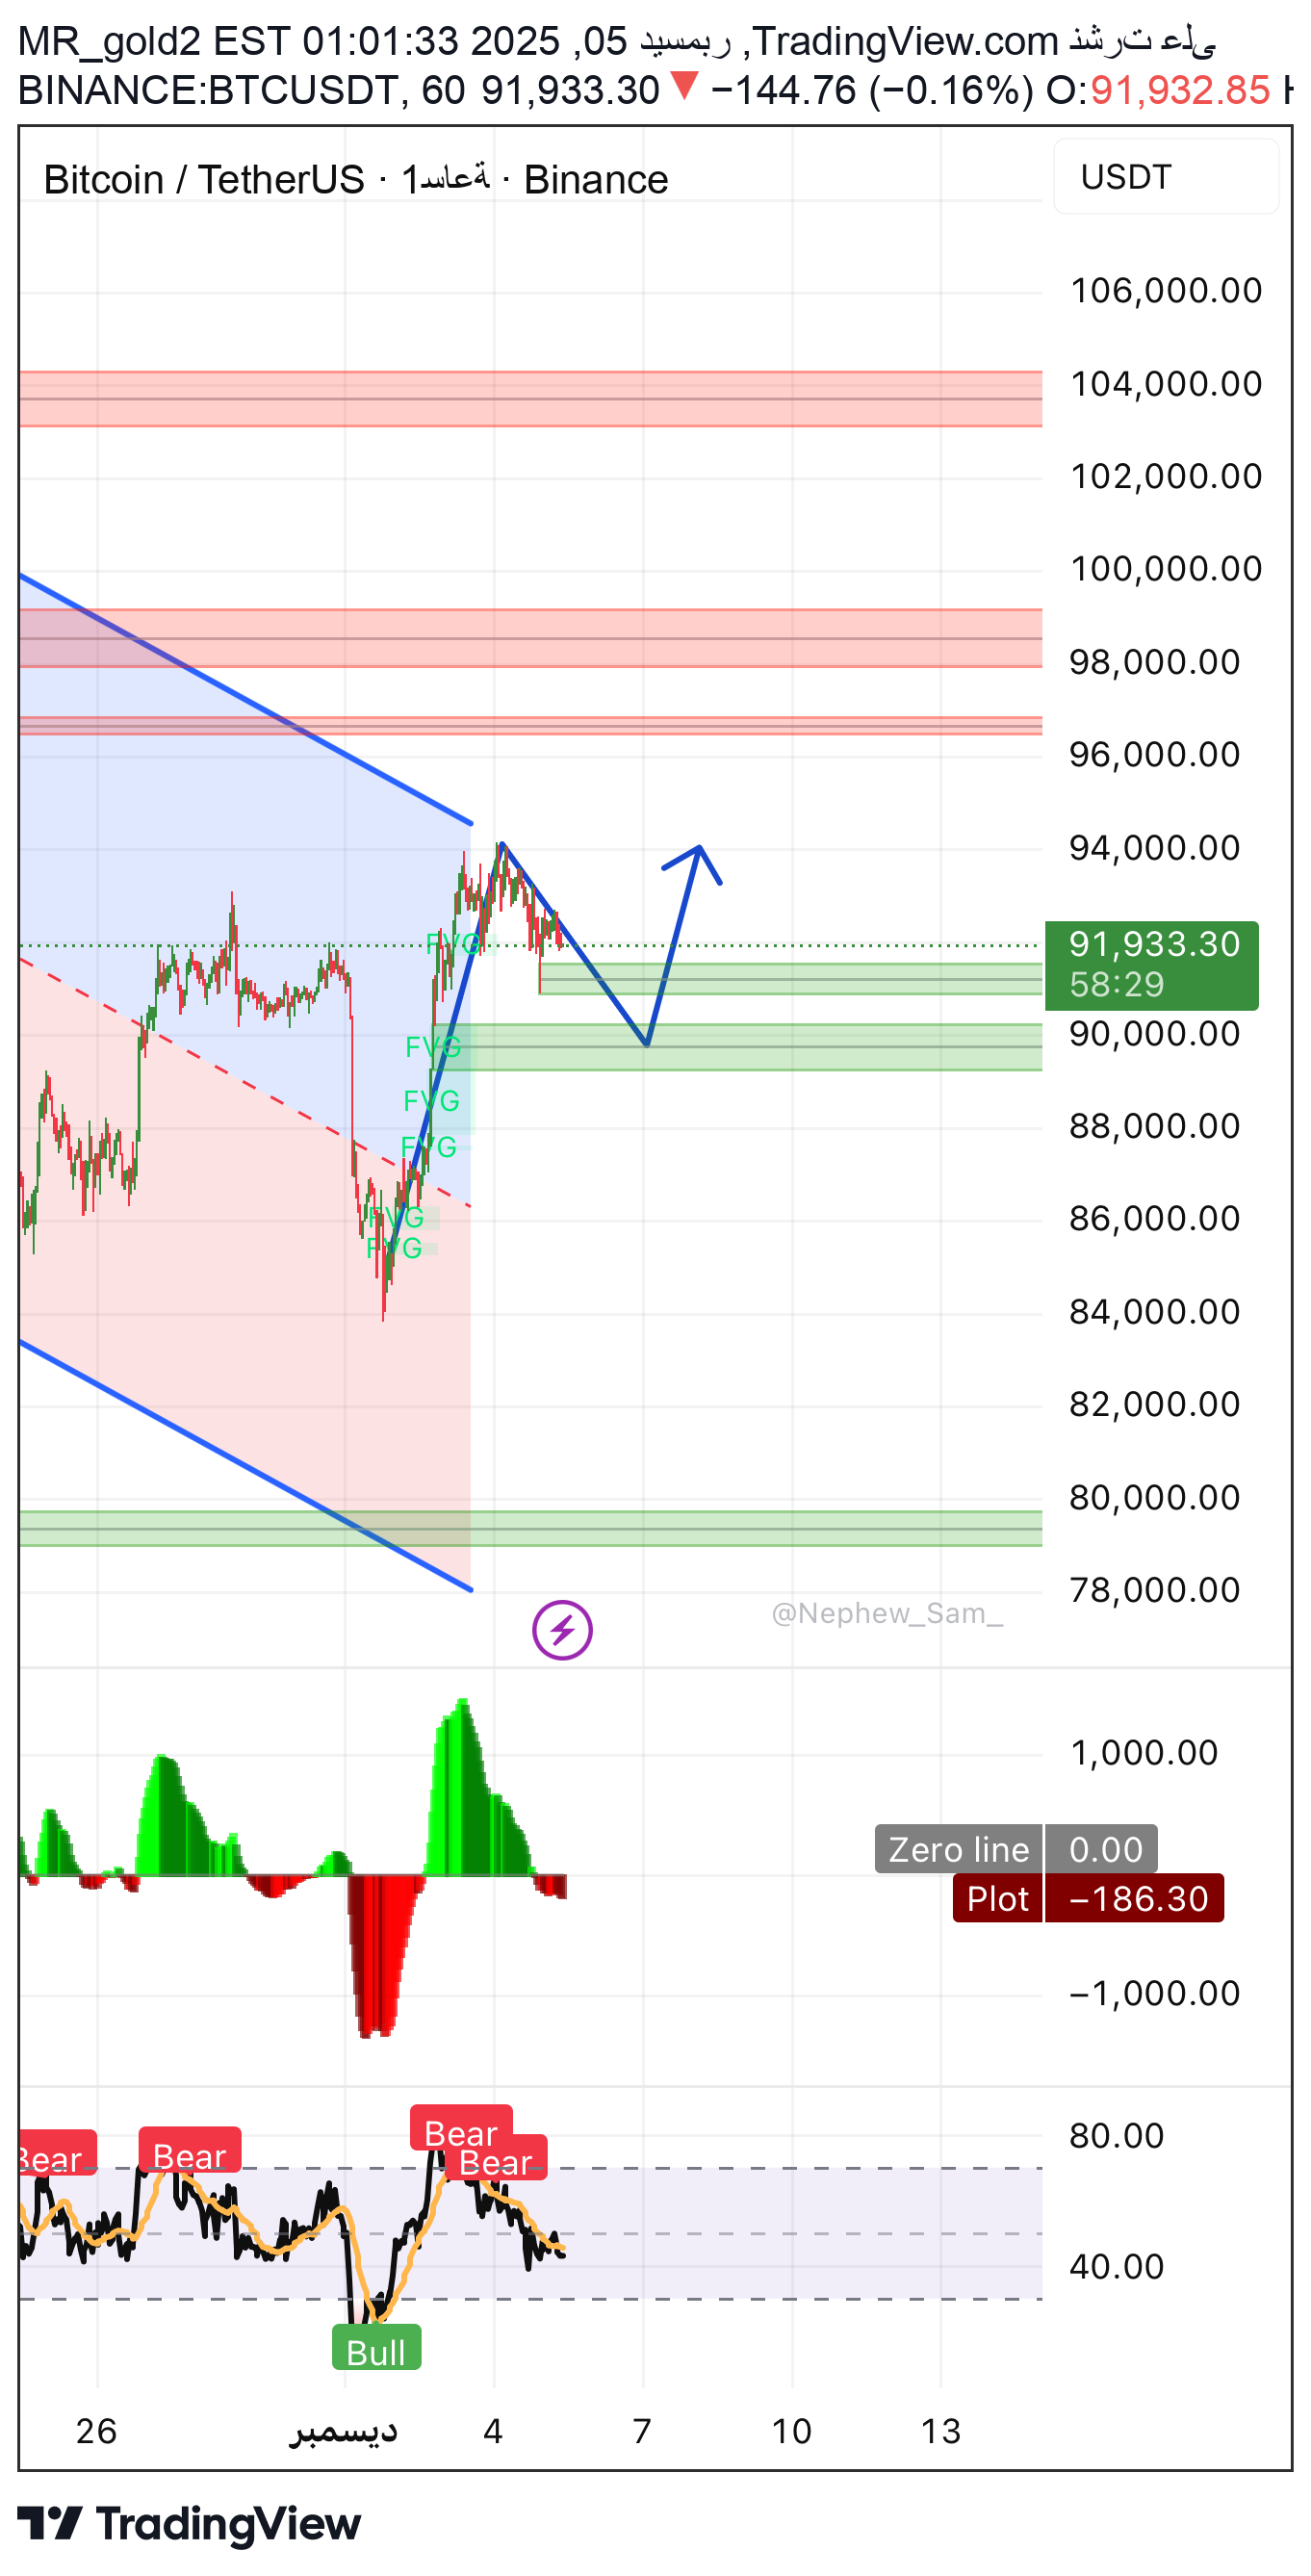
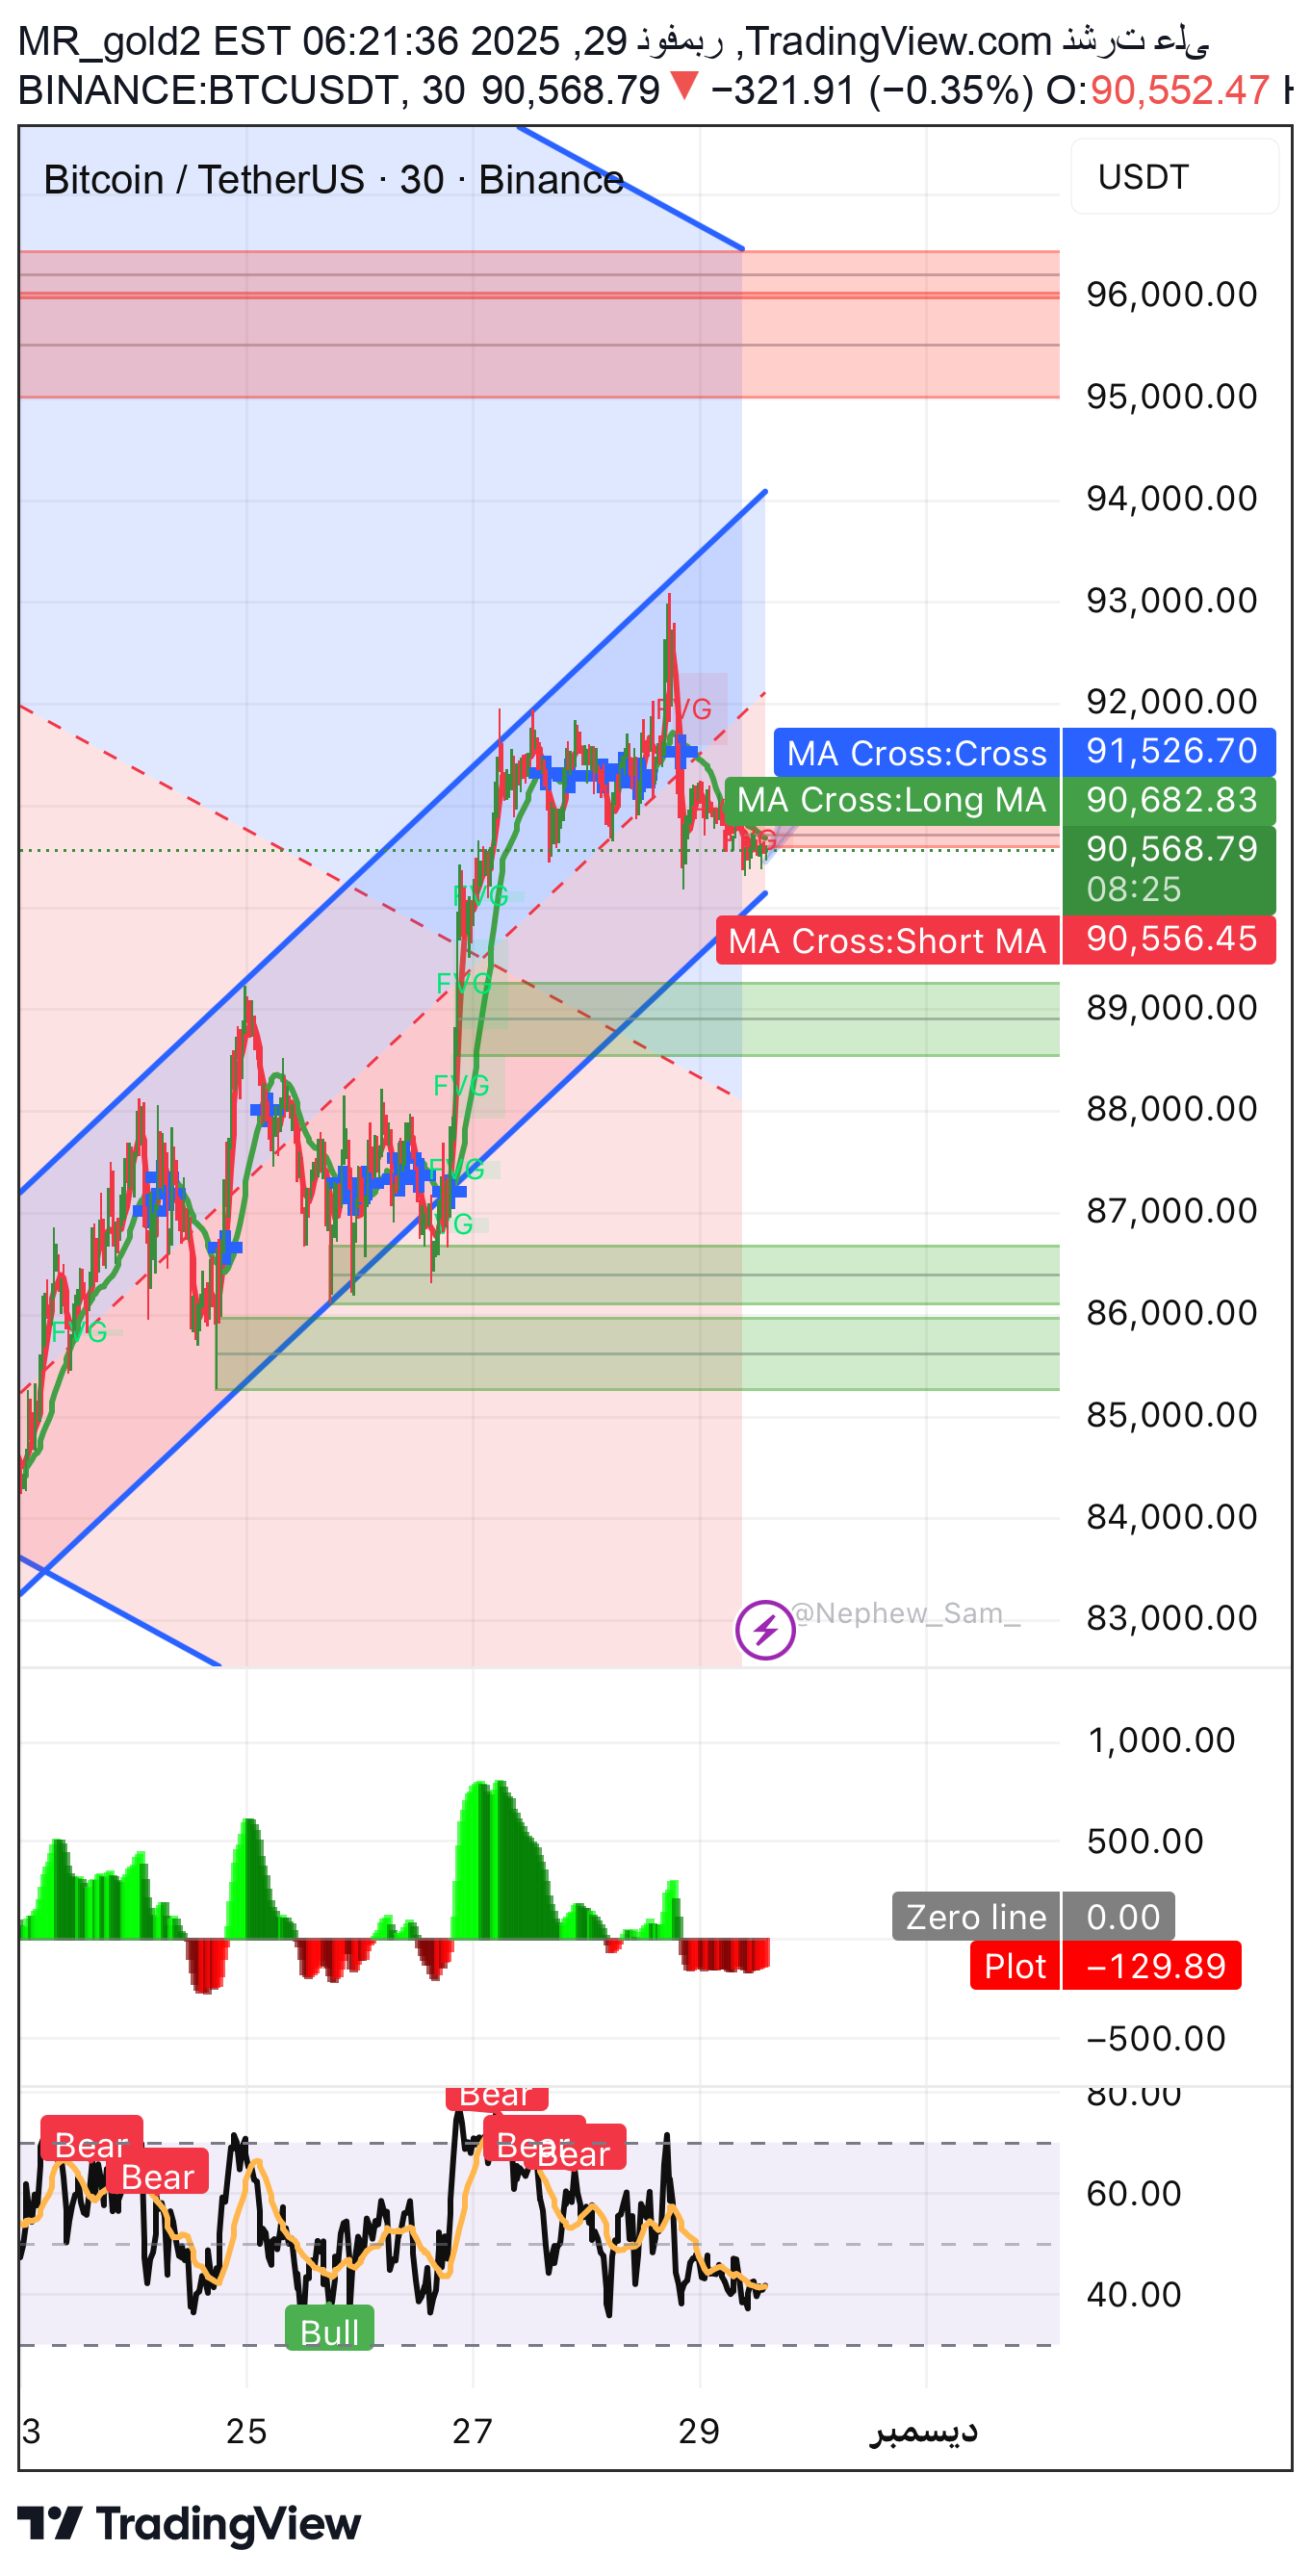
⸻ 🔹 Technical analysis •The price is moving within a bearish horizontal range. •A clear failure to penetrate the upper supply areas. •The presence of an unfilled upper FVG kit puts pressure on the price. •The sub-uptrend was previously broken and is now acting as resistance. ⸻ 🔹 Wave analysis •The current movement within a corrective wave within a larger structure. •The wave formation is likely: •Either a downward extension •Or retest the upper before landing ⸻ 🔹 Time analysis •The price is at a sensitive point in time. •It is often followed by strong movement during the next sessions. ⸻ 🔹Digital Analysis (Momentum) •Momentum is weak and fluctuating. •Lack of clear purchasing power. •Any current rise is considered corrective so far. ⸻ 🔹Fundamental Analysis (brief) •There is no strong news supporting the rise. •Liquidity tends to drain near resistances. ⸻ 🔹 Price action •Equal Highs. •Repeated price rejection from the same areas. •Top-band discharge signals. ⸻ 🔹 Supports and resistances 🟢 Supports •88,500 – 87,800 •85,000 – 84,000 •Strong support: 82,000 🔴 Resistors •90,800 – 91,500 •92,800 – 94,000 •Strong resistance: 100,000 – 105,000 ⸻ 🔹 Supply and demand areas •Powerful display area: 92,000 – 94,000 •Medium demand area: 87,500 – 88,500 •Strong demand zone: 82,000 – 84,000 ⸻ 🔹 Axial area •Pivot Zone: 89,000 – 90,000 Price is currently within → Market decision is near ⸻ 📌 SELL transaction Entry (sell): •From the region: 90,000 – 91,000 •Or after a clear break of the 88,500 level Stop loss: •Near stop: above 91,500 •Safe stop: above 94,000 Objectives: •First goal: 88,500 •Second goal: 85,000 •Third goal: 82,000 Notes: •The trade is preferred when a rejection candle or weak momentum appears. •Managing the deal by moving the stop to par after the first goal. ⸻ 📌 BUY deal Entry (buy): •After a clear and stable close above 92,000 •With confirmation of momentum and breakout candle Stop loss: • Close stop: below 90,500 •Safe stop: below 89,000 Objectives: •First goal: 94,000 •Second goal: 98,000 •Third goal: 100,000 – 105,000 Notes: •Purchase only after confirmation and not within the range. •Failure to hold above 92,000 will cancel the deal ️ Important note We do not provide financial or investment advice; Rather, we provide scientific and educational content based on technical and fundamental analysis. You are the only person responsible for a decision Click on the buy or sell button, It bears full responsibility for capital and risk management. Analyst: ✍️ Engineer Ihab Channel: 📊 Sayed Al-Dhahab channel - Telegram
MR_gold2
تحلیل تکنیکال بیت کوین: فرصتهای خرید زیر ۹۰ هزار دلار و پیشبینی موج صعودی تا ۱۰۰ هزار!
1) The general trend •The current trend is a corrective rise within a major descending channel. •The previous channel hack was a false hack and was retested. •The price is retesting important support and demand areas. 2) Elliott Wave analysis •Bitcoin is moving within a corrective ABC pattern. •We are at the end of wave B. •The ascending wave C needs a drop to 87,500 – 86,500 to start the real takeoff. 3) Time Cycles analysis •A time cycle repeats every 7–9 days between lows. •The last low was 6 days ago → The market is very close to a time reversal zone. 4) Digital analysis •Important psychological support: 90,000 •Main wave support: 87,500 •Strong firewall: 86,500 – 86,000 5) Fundamental analysis •Markets await US inflation data. •The dollar is volatile, and liquidity is low. •The general trend of Bitcoin is sideways, waiting for a major event. •Any decline towards demand areas is considered a buying opportunity, not a selling opportunity. 6) Price Action •Strong rejection candles appear at 90,500. •Small double top at 93,000 → short resistance. •Sellers' momentum is weak, which suggests an upward rebound after visiting a buying zone. 7) Supports and resistances Supports •90,500 requests + FVG •89,700 structural support •87,800 – 86,500 major support + wave end Resistors •93,500 – 94,200 main show •98,000 – 100,000 major reversal zones 8) Supply and demand zones Demand areas •90,500 – 89,700 •88,000 – 86,500 (strongest) Display areas •93,500 – 94,200 •98,000 – 100,000 9) Harmonic models •There is a possibility of a bullish BUTTERFLY pattern forming •His goal reaches: 97,000 – 100,000 •It requires touching the area 86,500 – 87,500 to complete point D. 10) Pivot point 91,900 – 92,200 •Above it → rise • Below it → decline towards good buying areas 🎯 Approved recommendations Note: We are still inside a bearish buy channel with a stop and caution 🔸 First purchase deal (safe and close to the price) •Entry: 90,500 •Stop loss: 89,300 •Target 1: 92,800 •Goal 2: 94,200 •Goal 3: 98,000 🔸Strong Buy (Best Area) •Entry: 88,000 – 86,500 •Stop loss: 85,500 •Goal: 97,000 – 100,000 Important note We do not provide you with financial and investment advice Rather, we provide you with scientific and educational content You are the only person responsible for pressing the buy and sell button Analyst Engineer Ihab Sayed Al-Dhahab Telegram channel
MR_gold2
تحليل شامل لتوقع سعر البيتكوين: هل حان وقت الشراء الآن؟
⸻ 🎯 First - the general trend •Short-term: corrective bearish trend within a broken ascending channel. •Medium-term trend: It is still bullish as long as it maintains the 88,000–87,000 strong demand zone. •Macro trend: Very bullish due to fundamentals (Halving + ETF liquidity + lack of supply). ⸻ 📉 Second - Technical analysis 1. Rising channel •The lower border of the ascending channel has been broken → a signal of weakness. •The price is now retesting at 91,000 – 90,800. •Failure to close above 91,200 means a continuation of the decline. ⸻ 2. Supply and demand zones Strong display (red): •92,300 – 93,000 •95,000 – 96,000 •99,000 – 100,000 Strong demand (green): •90,300 – 89,700 (current area) •88,200 – 87,400 (strongest) •86,000 – 85,000 (last before collapse) ⸻ 3. Key supports and resistances •Resistance now: •91,200 •91,800 •92,600 •Support now: •90,300 •89,700 •88,300 ⸻ 🔺 Third - Wave analysis •The current wave is a correction (wave B or 4) within a large uptrend. •The price ended a strong bullish wave, and is now in a bearish correction wave. •The next wave expected after the correction ends: •Rising to 93K → 96K → 100K in stages. But before that, we need a small drop to complete the correction. ⸻ ⏳ Fourth - Time analysis •The 89,700–88,300 area shows strong temporal coherence (aggregation is clear). •Time forecast: •Today – Tomorrow: slight downward pressure. •After 36 hours: Possibility of starting a rising wave. ⸻ 🔢 Fifth - Digital analysis •RSI on 1H and 4H: •In the 35–40 area → near saturation. •MACD: •Bearish, but close to a positive crossover. This means that the bottom is very close. ⸻ 🔥 Sixth - Price action From the picture: •Candles with long tails from below → clear sell rejection. •The price consolidates above the demand area → a positive indicator. •Failing to break 89,700 = a strong bullish signal. ⸻ 🌀 Seventh - Harmonic models The model is now composed: Bullish ABCD or Shark The first expected goal: •92,000 – 92,600 ⸻ 🎯 Eighth – fixation points and the pivotal area Pivot Zone: 90,500 The price is above it → rising Price is below it → short decline ⸻ 📌 Finally - the clear recommendation (according to the current photos) ✅ A ready deal with a close stop loss as requested 🎯 Buy entry Login: 90,500 – 90,300 (current area is excellent) 🛑 Very close stop loss (SL): 89,700 only 🎯 Objectives: •Target 1: 91,600 •Goal 2: 92,300 •Goal 3: 93,000 Target 4 (if it increases and explodes) Important note We do not provide you with financial and investment advice Rather, we provide you with scientific and educational content You are the only person responsible for pressing the buy and sell button Analyst Engineer Ihab Sayed Al-Dhahab Telegram channel
MR_gold2
تحليل الذهب: 10 راز صعود الذهب نحو 4250 | هل يستمر الزخم الصاعد؟
I mentioned to you yesterday that gold will bounce from the 4000-3980 areas towards 4100 because it is a very important area, the bottom of a trend, as you can see in the picture. Congratulations on your big profits. This is our difference with the rest of the channels. We hit distant targets with strong accuracy every day. 500-1000 profit points for gold and with little risk. First: the general trend The hourly trend after the bounce from 3970 became: ✔️ Short-term uptrend ✔️ An upward corrective movement within a partially broken downward channel ✔️ The price is now trying to break through the 4085–4100 area 📉 Second: Technical Analysis From the drawing it appears: •Strong entry from buyers from the 3970–4020 area •Gradual and healthy ascent (Stair Step Pattern) •Most of the lower FVG is filled •The presence of cross gaps (FVG) at 4100 and 4140 •The averages are gradually turning upward (Long MA above Short MA soon) 🌊 Third: Wave analysis - Elliott Waves The sequence is very clear: 🔹 Wave A is falling from 4250 → 3970 🔹 Wave B is a weak rise to 4140 🔹 Wave C completed at 3970 ✔️ Now we have started a new driving wave (1–2–3–4–5) ✔️ The price is now at the beginning of wave 3, which is the strongest wave on the rise ⏳ Fourth: Time Cycle The time cycle November 14–18 was the reversal point. ✔️ Very clear time bottom ✔️ The current cycle is up until November 22-24 ✔️ Expected peak at 4140 – 4170 🔢 Fifth: Digital analysis - Fibonacci Gold's rebound came in proportions: •0.886 •0.92 These are the end zones of large corrections. 🎯 First upside Fibo target: 4085–4100 🎯 Fibo second goal: 4170 🎯 Fibo third target: 4250 (in case wave 3 extends) 💱 Sixth: Fundamental Analysis - Fundamentals Basic data supports the rise: ✔️ Slowing US inflation ✔️ Possibility of interest stabilization ✔️ DXY dollar index falls ✔️ Central banks continue to buy gold ✔️ Markets fear of the coming recession 📌 There is no fundamental element that supports gold’s decline now. 📊 Seventh: Price Action Excellent price behavior: •Candles Rejection at 4000 Bullish Engulfing candles •Shift of Market Structure (SMS) above 4040 •Higher Lows successive • Breaking the descending channel diagonally (Break Out) 🟩 Eighth: Demand and supply areas - S&D 🟩 Demand areas (purchase): 1️⃣ 4040 – 4060 2️⃣ 4000 – 4020 3️⃣ 3970 – 3985 (major bottom) 🟥Display areas (sale): 1️⃣ 4100 – 4120 2️⃣ 4140 – 4170 (possible trend reversal area) 3️⃣ 4210 – 4250 🦋 Ninth: Harmonic models On the clock frame it consists of: 🔷Bullish Bat Pattern His target is 4120 🔷 Bullish Crab possible His target is 4170 Both models support the continuation of the rise. 📌 Tenth: Stabilization Points The area above which gold stabilizes and the strong rise begins: 📍 4060 – 4070 ⭐ Pivot Zone 📌 4040 – 4060 Price remaining above it = rising Breaking it = retesting 4000 and then a bigger rise 🎯 Final recommendation - Recommendation ✔️ Trading Strategy: Buying is the dominant trend Selling now is high risk. We are looking for promotion of purchasing from areas 4060 🎯 4040 – 4050 (very excellent) 🎯 3970 – 3990 (real gold) ✔️ Objectives: 🎯 Goal 1:4100 🎯 Goal 2: 4120 🎯 Goal 3: 4170 🎯 Goal 4: 4210 Purchase expiration In case ❌ Fraction of 3970 by an hour candle Important note We do not provide you with financial and investment advice Rather, we provide you with scientific and educational content You are the only person responsible for pressing the buy and sell button Analyst Engineer Ihab Sayed Al-Dhahab Telegram channel
MR_gold2
طلاء الذهب عند مفترق طرق: هل نهاية الهبوط وارتداد وشيك؟ (تحليل شامل)
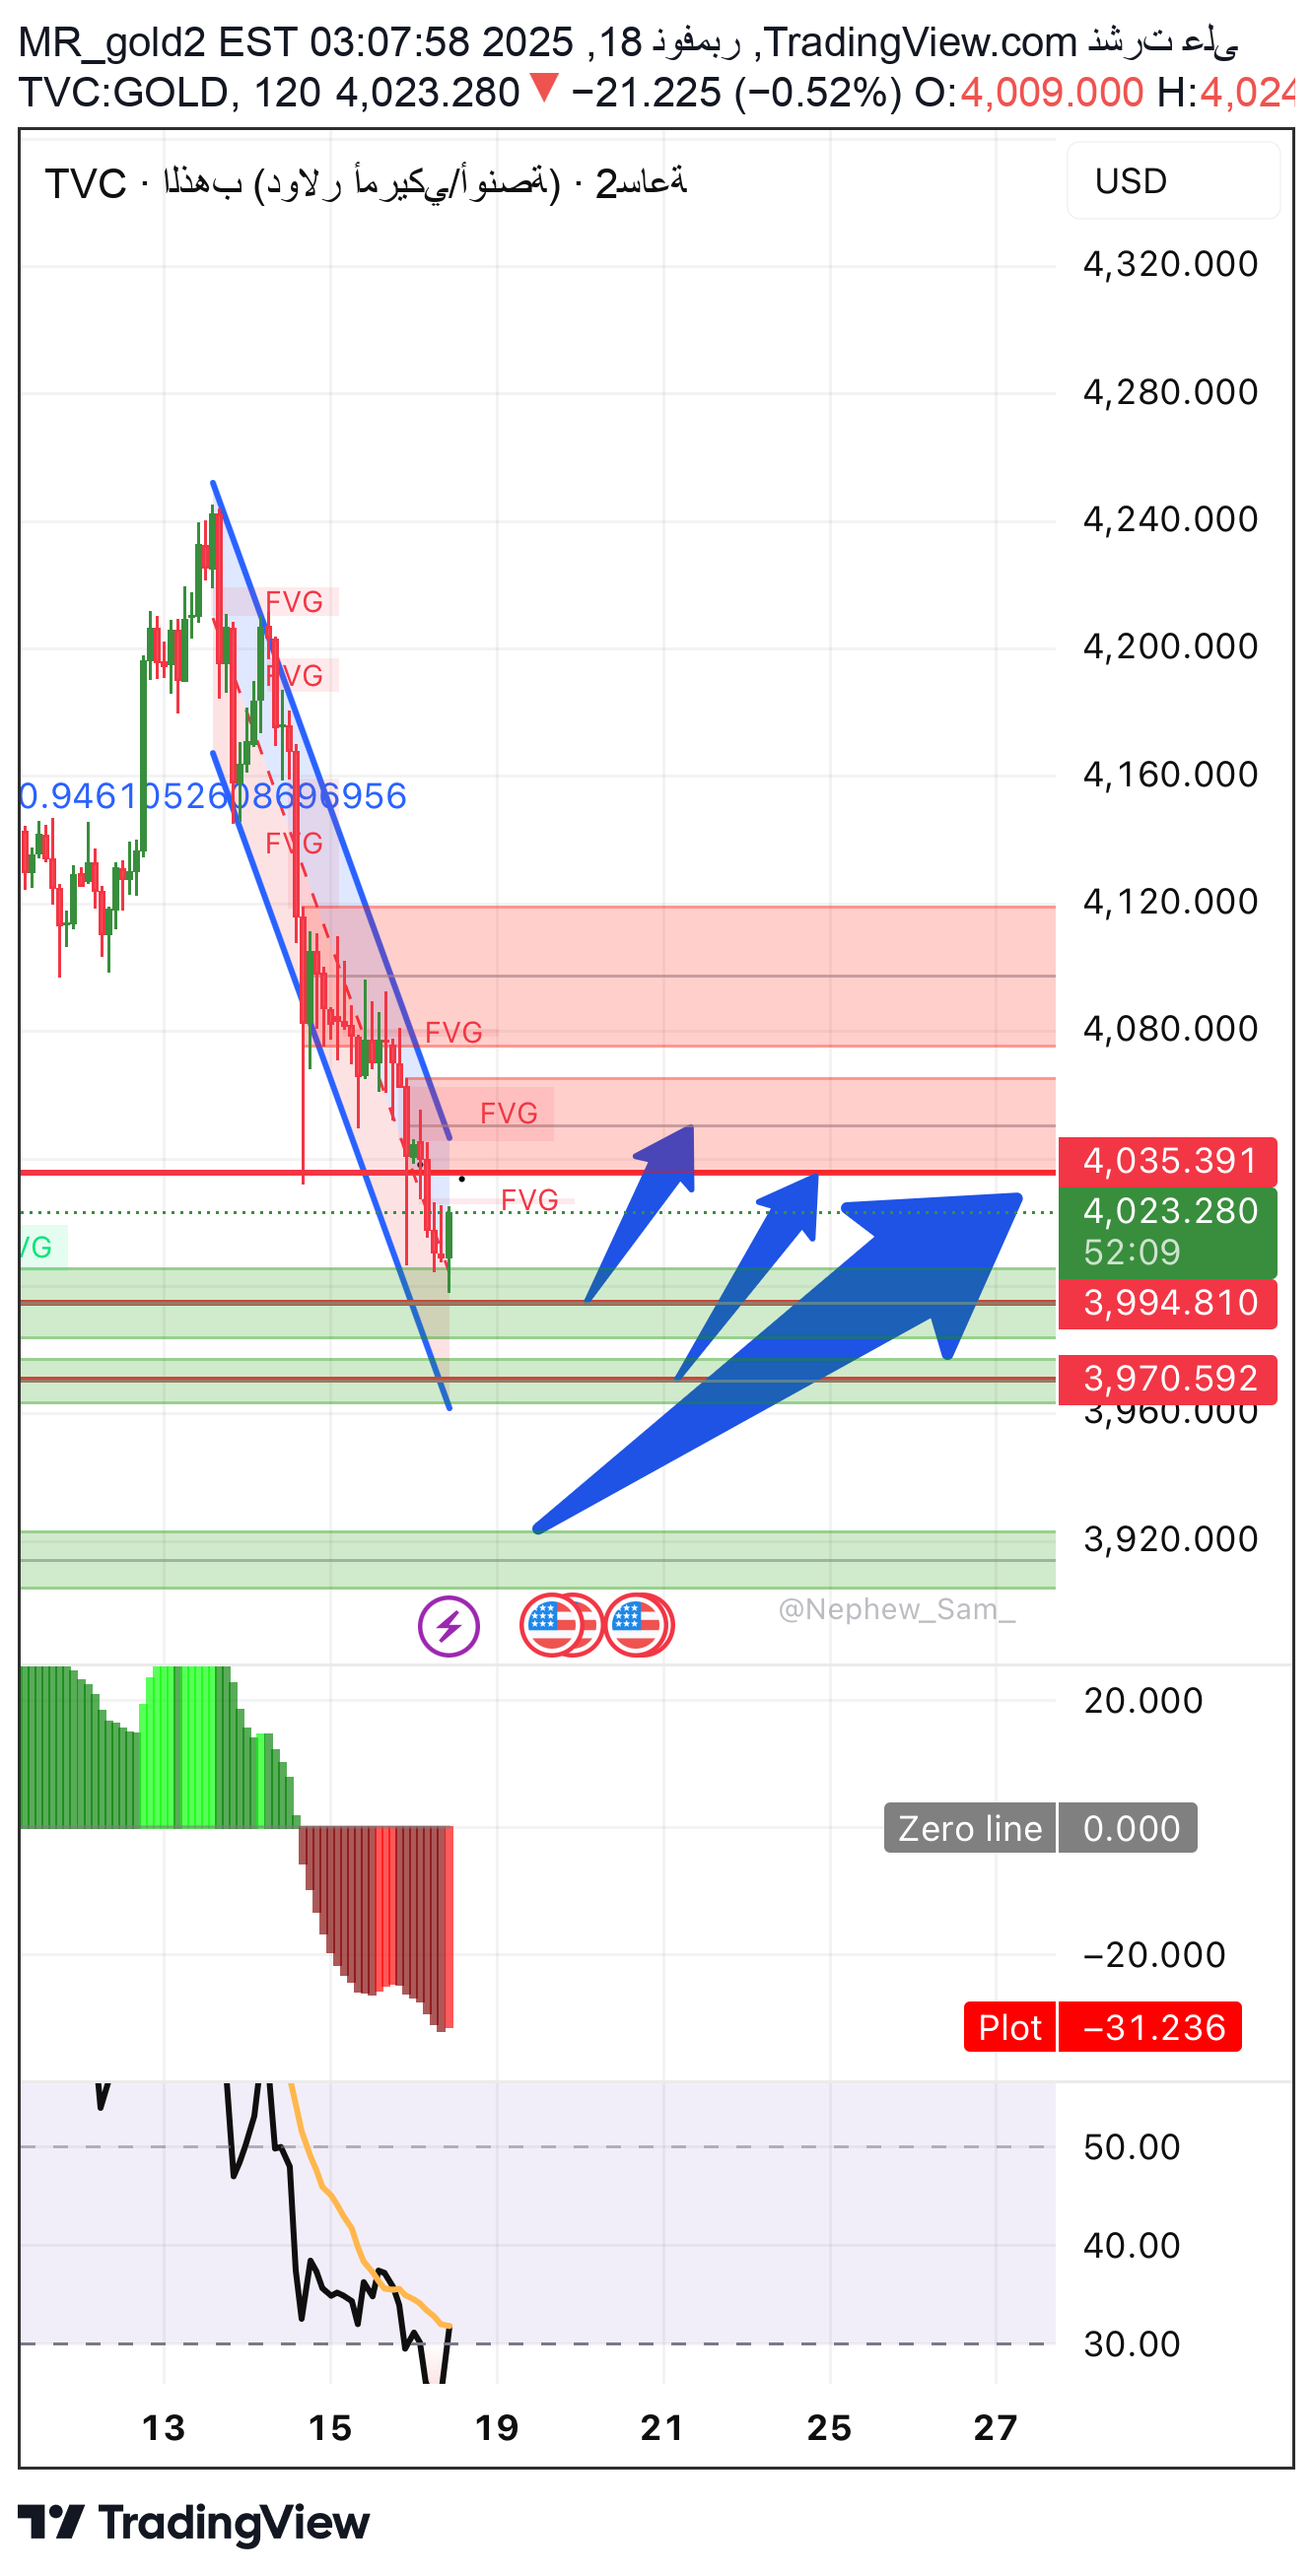
⚠️ The price has currently reached a very sensitive area... and there is a very high probability that the current decline will end. ⸻ ■ First: Technical analysis ✔ General trend: •Down within a sharp downward channel shown by the two blue lines. •The price is now at the lower channel border = an area from which a strong rebound often occurs. ✔ Important Note: The first retracement candle has now appeared above the demand zone → the first bearish exit signal. ⸻ ■ Second: Elliott wave analysis Waves The situation indicates: ✔ Wave C is falling from the ABC pattern. C extension levels: •0.946 = current potential bottom (4010–4000) •1.272 = 3965 •1.618 = 3910 🟢 The area 4000–3965 is the 70% end zone of wave C. ⸻ ■ Third: Time Cycles analysis The current down cycle ends between: ⏳ November 16 - 20 And you are now within this range = Perfect timing for the reversal. ⸻ ■ Fourth: Fibonacci numerical analysis The most important Fibo levels: •0.618 = 4060 (break it) •0.786 = 4005 (reached it and bounced back from it today) •1.0 = 3960 (numeric landing target) So: 🎯 4005–3960 is the golden zone for a bullish reversal. ⸻ ■ Fifth: Fundamental analysis Negative factors: •The strength of the dollar today. •Bond pressure on metals. •Absence of supportive news for gold. Positive factors: •The market is approaching an institutional buying zone. •There are no additional reasons for the continuation of the violent decline at this level. •Everyone sold… → Market makers are preparing for a reversal. ⸻ ■ Sixth: Price Action Important signals: •Long-tailed candles at the lower channel → liquidity absorption. •The beginning of a breakthrough between the highs and lows within the descending channel. •Bull candle appeared below RSI = reversal signal. ⸻ ■ Seventh: Supports and resistances 🟢Supports: 1.4000 2.3980 3.3960 (strongest) 🔴 Resistors: 1.4050 2.4100 3.4160 – 4200 (strong supply area) ⸻ ■ Eighth: Demand and supply area 🟢Demand areas: •4000–3980 •3980–3960 These are the two strongest buying areas currently on the frame. 🔴Display areas: •4100–4160 •4180–4200 ⸻ ■ Ninth: Harmonic Model consists of: ✔ Bullish Bat / Butterfly Point D is located at: 🎯 4000–3980 The model confirms that the current decline has ended or is about to happen. ⸻ ■ Tenth: POC installation points Point of Control The old volume is located at: 4058 Hacked = Confirmation of a change in trend to the upside. ⸻ ■ Eleventh: Pivot area Pivot today: 4045 Gold below = correction Gold above it = the beginning of a strong rise. ⸻ 🎯 Conclusion – look at the next trend ✔ Real-time trend: A final drop to 4000 - 3980 and then a rise. ✔ What's happening now? Price touches: •Lower descending channel border •Strong Fibo area •Strong demand area •C wave end zone •The end date of the cycle 👉 These are 5 factors that confirm the imminence of a reversal. ⸻ 💎 Recommendation (technical analysis only - not a trading invitation) ✔ We are looking for an entry signal from the best buying areas: 🎯 4000 🎯 3990 🎯 3980 (Shooting, not chasing). ✔ Objectives: •Goal 1: 4050 •Goal 2: 4100 •Goal 3: 4160 ✔ Determine the endowment yourself according to the lot, it must be close Important note We do not provide you with financial and investment advice Rather, we provide you with scientific and educational content You are the only person responsible for pressing the buy and sell button Analyst Engineer Ihab Sayed Al Thahab channel
MR_gold2
تحلیل جامع طلا: آیا سقوط به زیر 4010 حتمی است؟ (پیشبینی دقیق تا 17 آبان)
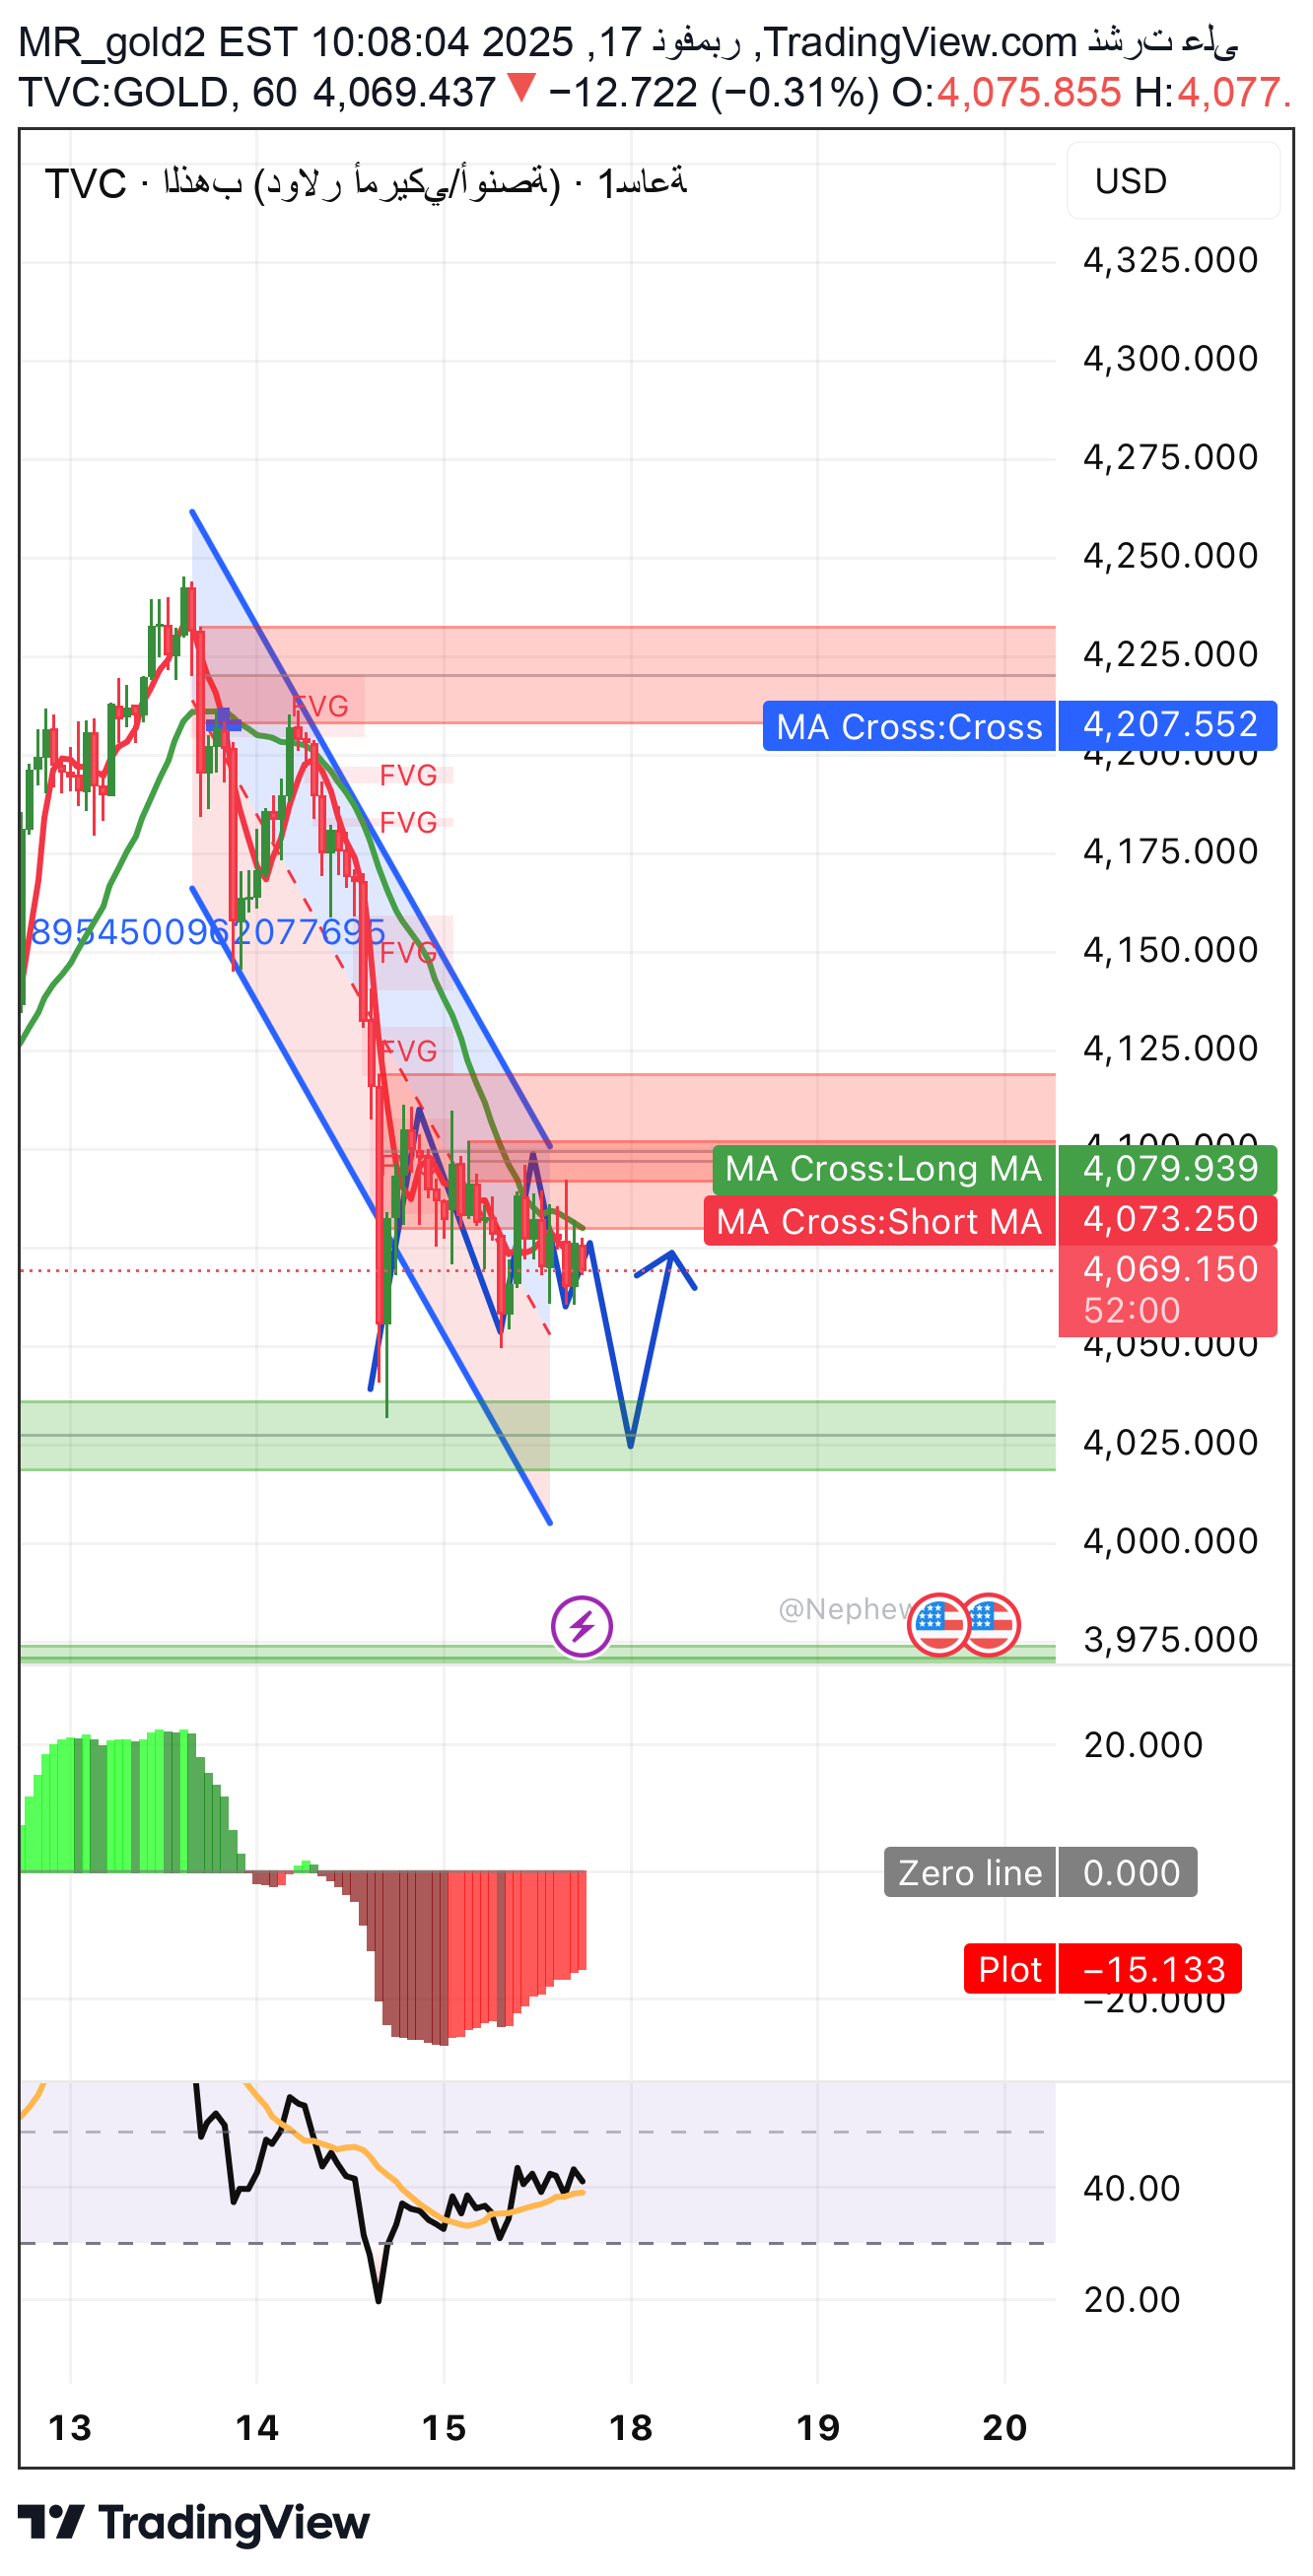
■ First: Technical analysis ✔ General trend: •Clearly falling on the hourly frame. •The price is fluctuating under a very strong resistance 4080–4085. •The downward channel is still in control and has not been broken. ✔ Important Note: •Every attempt to rise ends with a rapid decline → This means that the sellers are still in control. ⸻ ■ Second: Elliott wave analysis Waves Wave mode refers to: ✔ Gold inside a wave: C is falling From the ABC model. Wave C is not over yet, and its main target is within the areas: 🎯 4035 – 4010 Then a strong rebound wave begins (new wave 1). ⸻ ■ Third: Time Cycles analysis •The downward time cycle began on November 13th. •The end of the time cycle is expected between: ⏳ November 15 - 16 - 17 These are the same areas where a “mini weekly bottom” is expected to form. ⸻ ■ Fourth: Fibonacci numerical analysis •0.618 is located at: 4048 •0.786 is located at: 4015 → Very high retracement areas. ⸻ ■ Fifth: Fundamental analysis Current factors: •The dollar is strong. •The Federal Reserve tends to tighten. •There is no global fear currently driving gold. But: Gold is stable above 4000 = buyers are still in the picture. ⸻ ■ Sixth: Price Action •The last candles are narrow and show a consolidation inside the channel. •There is no trend break so far. •A small bounce...but without clear purchasing power. ⸻ ■ Seventh: Supports and resistances 🟢Supports: 1.4060 2.4045 3.4030 – 4010 (strongest support) 🔴 Resistors: 1.4085 2.4105 3.4140 – 4200 heavy display areas ⸻ ■ Eighth: Smart supply and demand zones 🟢 Request: •4045 – 4030 •4030 – 4010 (main retracement area) 🔴Offer: •4085 – 4100 •4140 – 4200 large sale block ⸻ ■ Ninth: Harmonic Model: ✔ Bullish BAT (in progress) Ideal reflection area: 🎯 4025 – 4010 ⸻ ■ Tenth: Digital models – FVG Higher price gaps still waiting to close: •4090 •4120 •4170 The price often returns to close after ending the decline. ⸻ ■ Eleventh: Pivot Zone Today's pivotal area: 4075 – 4085 If the price is below it = a fall Price being above it = bullish reversal Now the price is below it → means a downtrend. ⸻ 🎯 Final conclusion + recommendation ✔ Current trend: Bearish within a bearish channel There is no breakage yet. ✔ Expected scenario: 🔻 The strongest scenario: Falling towards: 4045 → 4030 → 4010 From 4010-4030 the rebound begins. 🔼 Alternative scenario: If 4085 is broken by an hour candle → the decline ends and the rise begins towards 4105 – 4120 ⸻ 💎 Technical recommendation (not financial advice) ❌ No purchase currently from 4070 Because the price is inside the channel and without confirmation. ✔ Best Buy: 4035 – 4010 First target: 4080 Second goal: 4120 ✔ Best Selling: 4085 – 4100 Goal: 4045 ⸻ Important note We do not provide you with financial and investment advice Rather, we provide you with scientific and educational content You are the only person responsible for pressing the buy and sell button Analyst Engineer Ihab Sayed Al Thahab channel
MR_gold2
پیشبینی طلای امروز: آیا قیمت به سوی 4230 صعود میکند؟
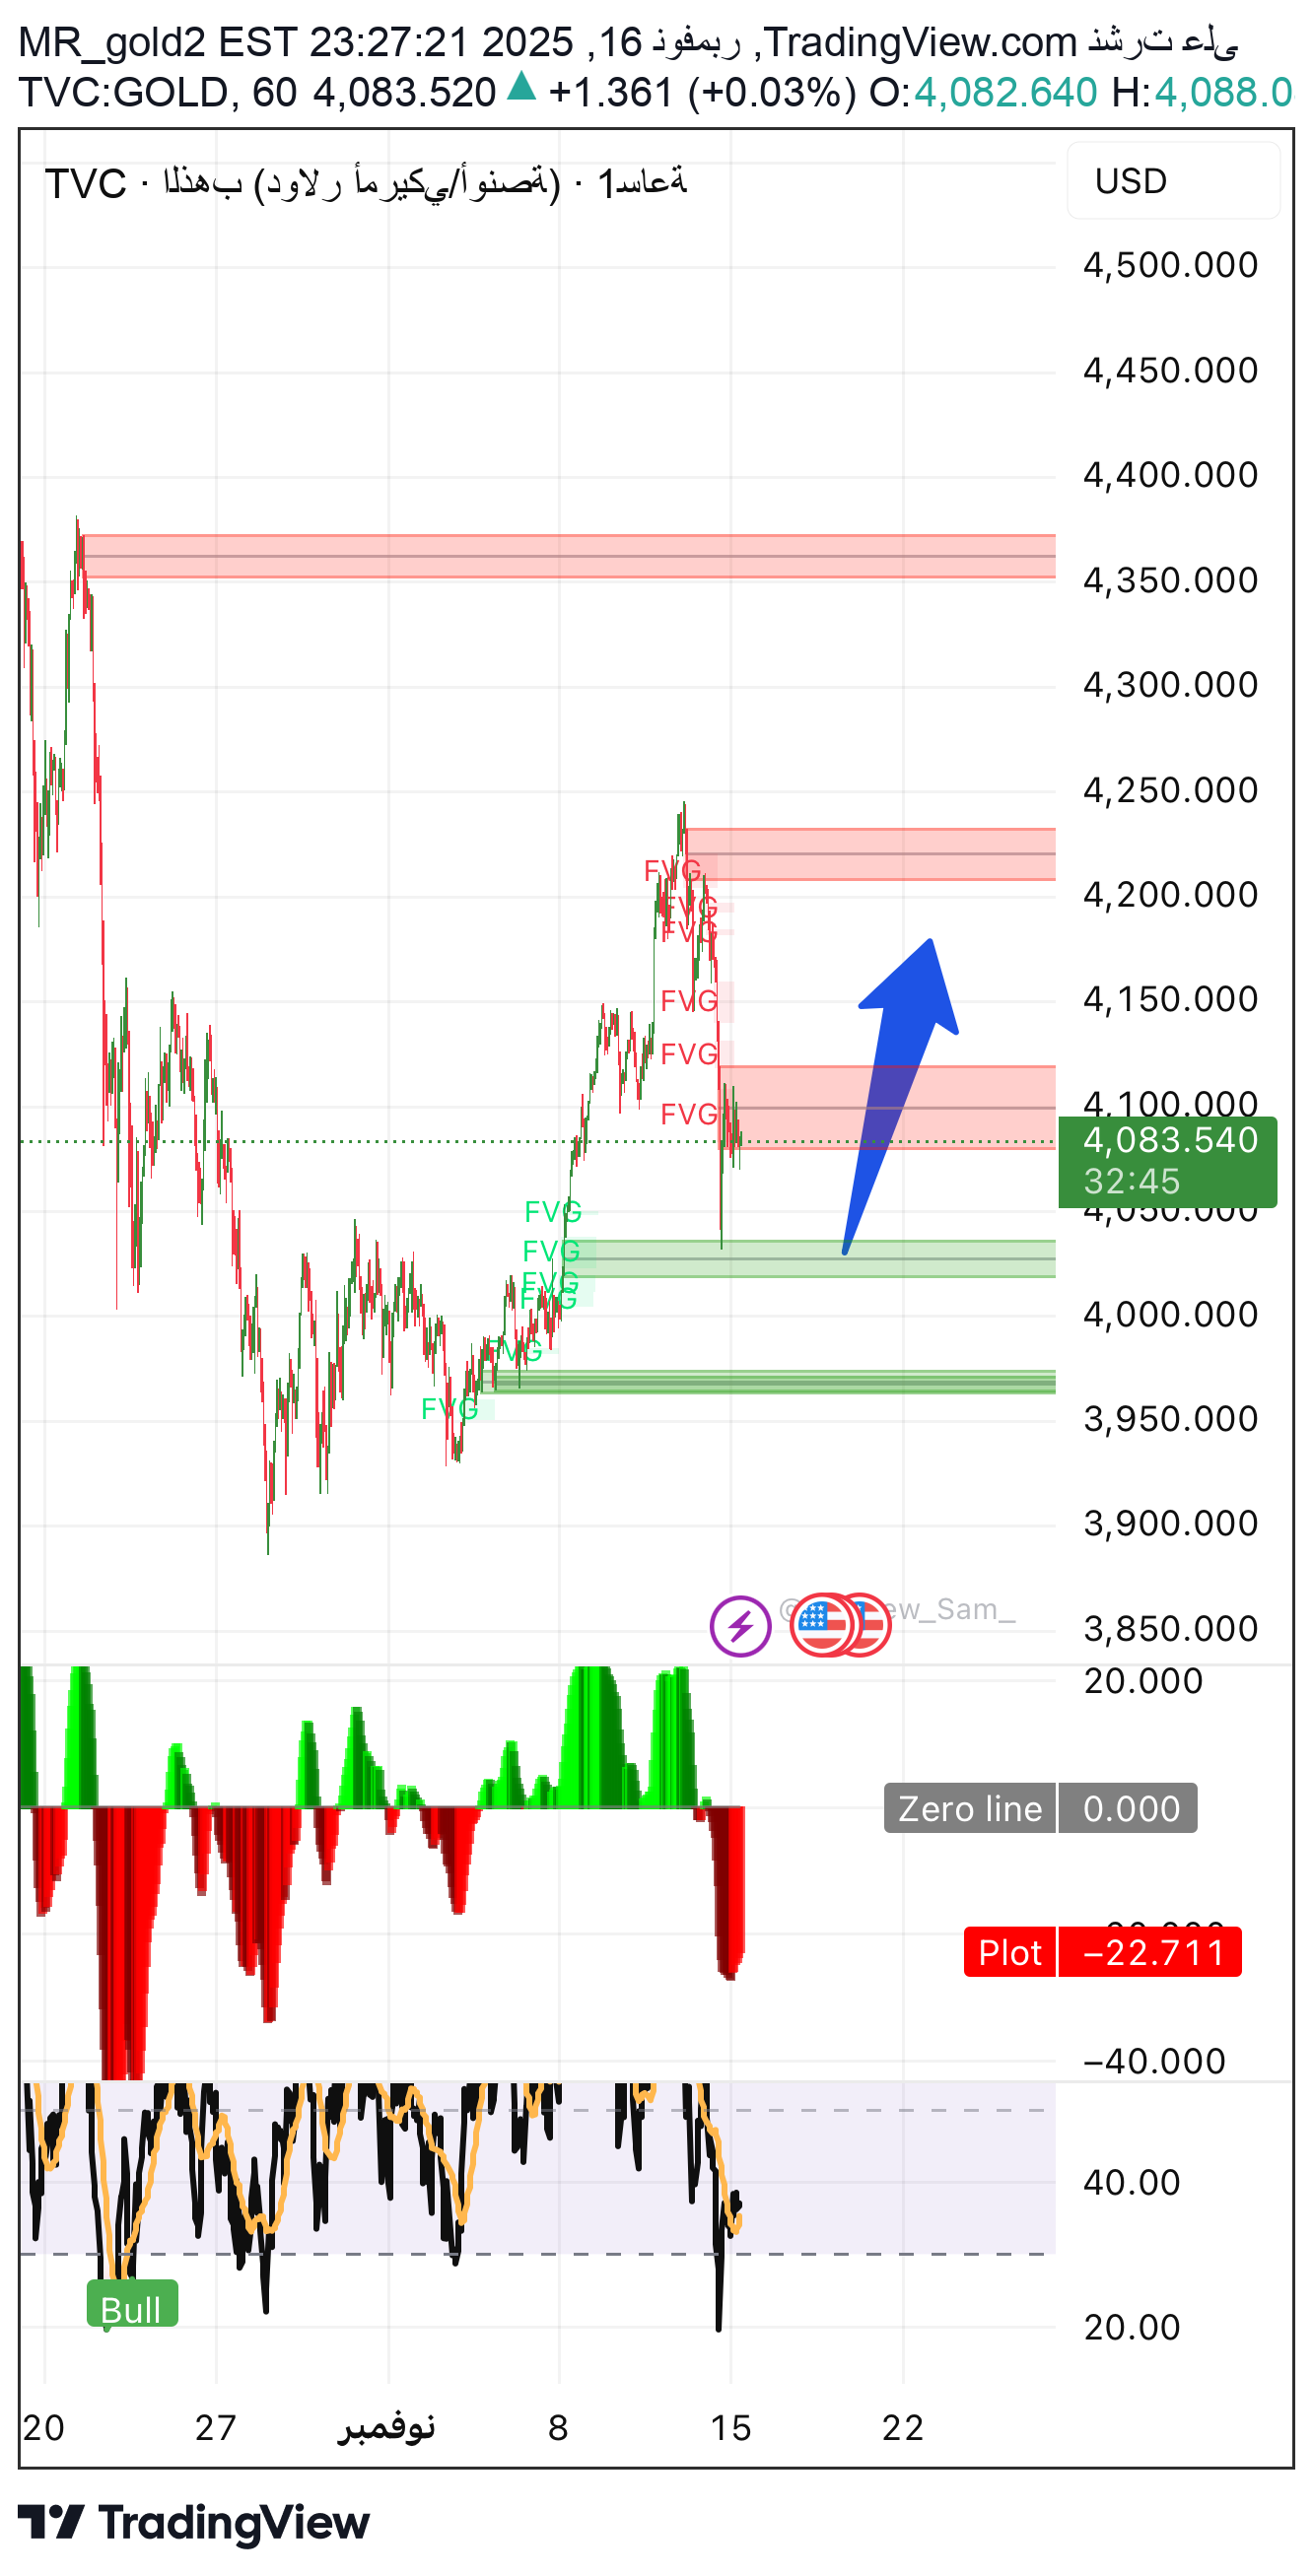
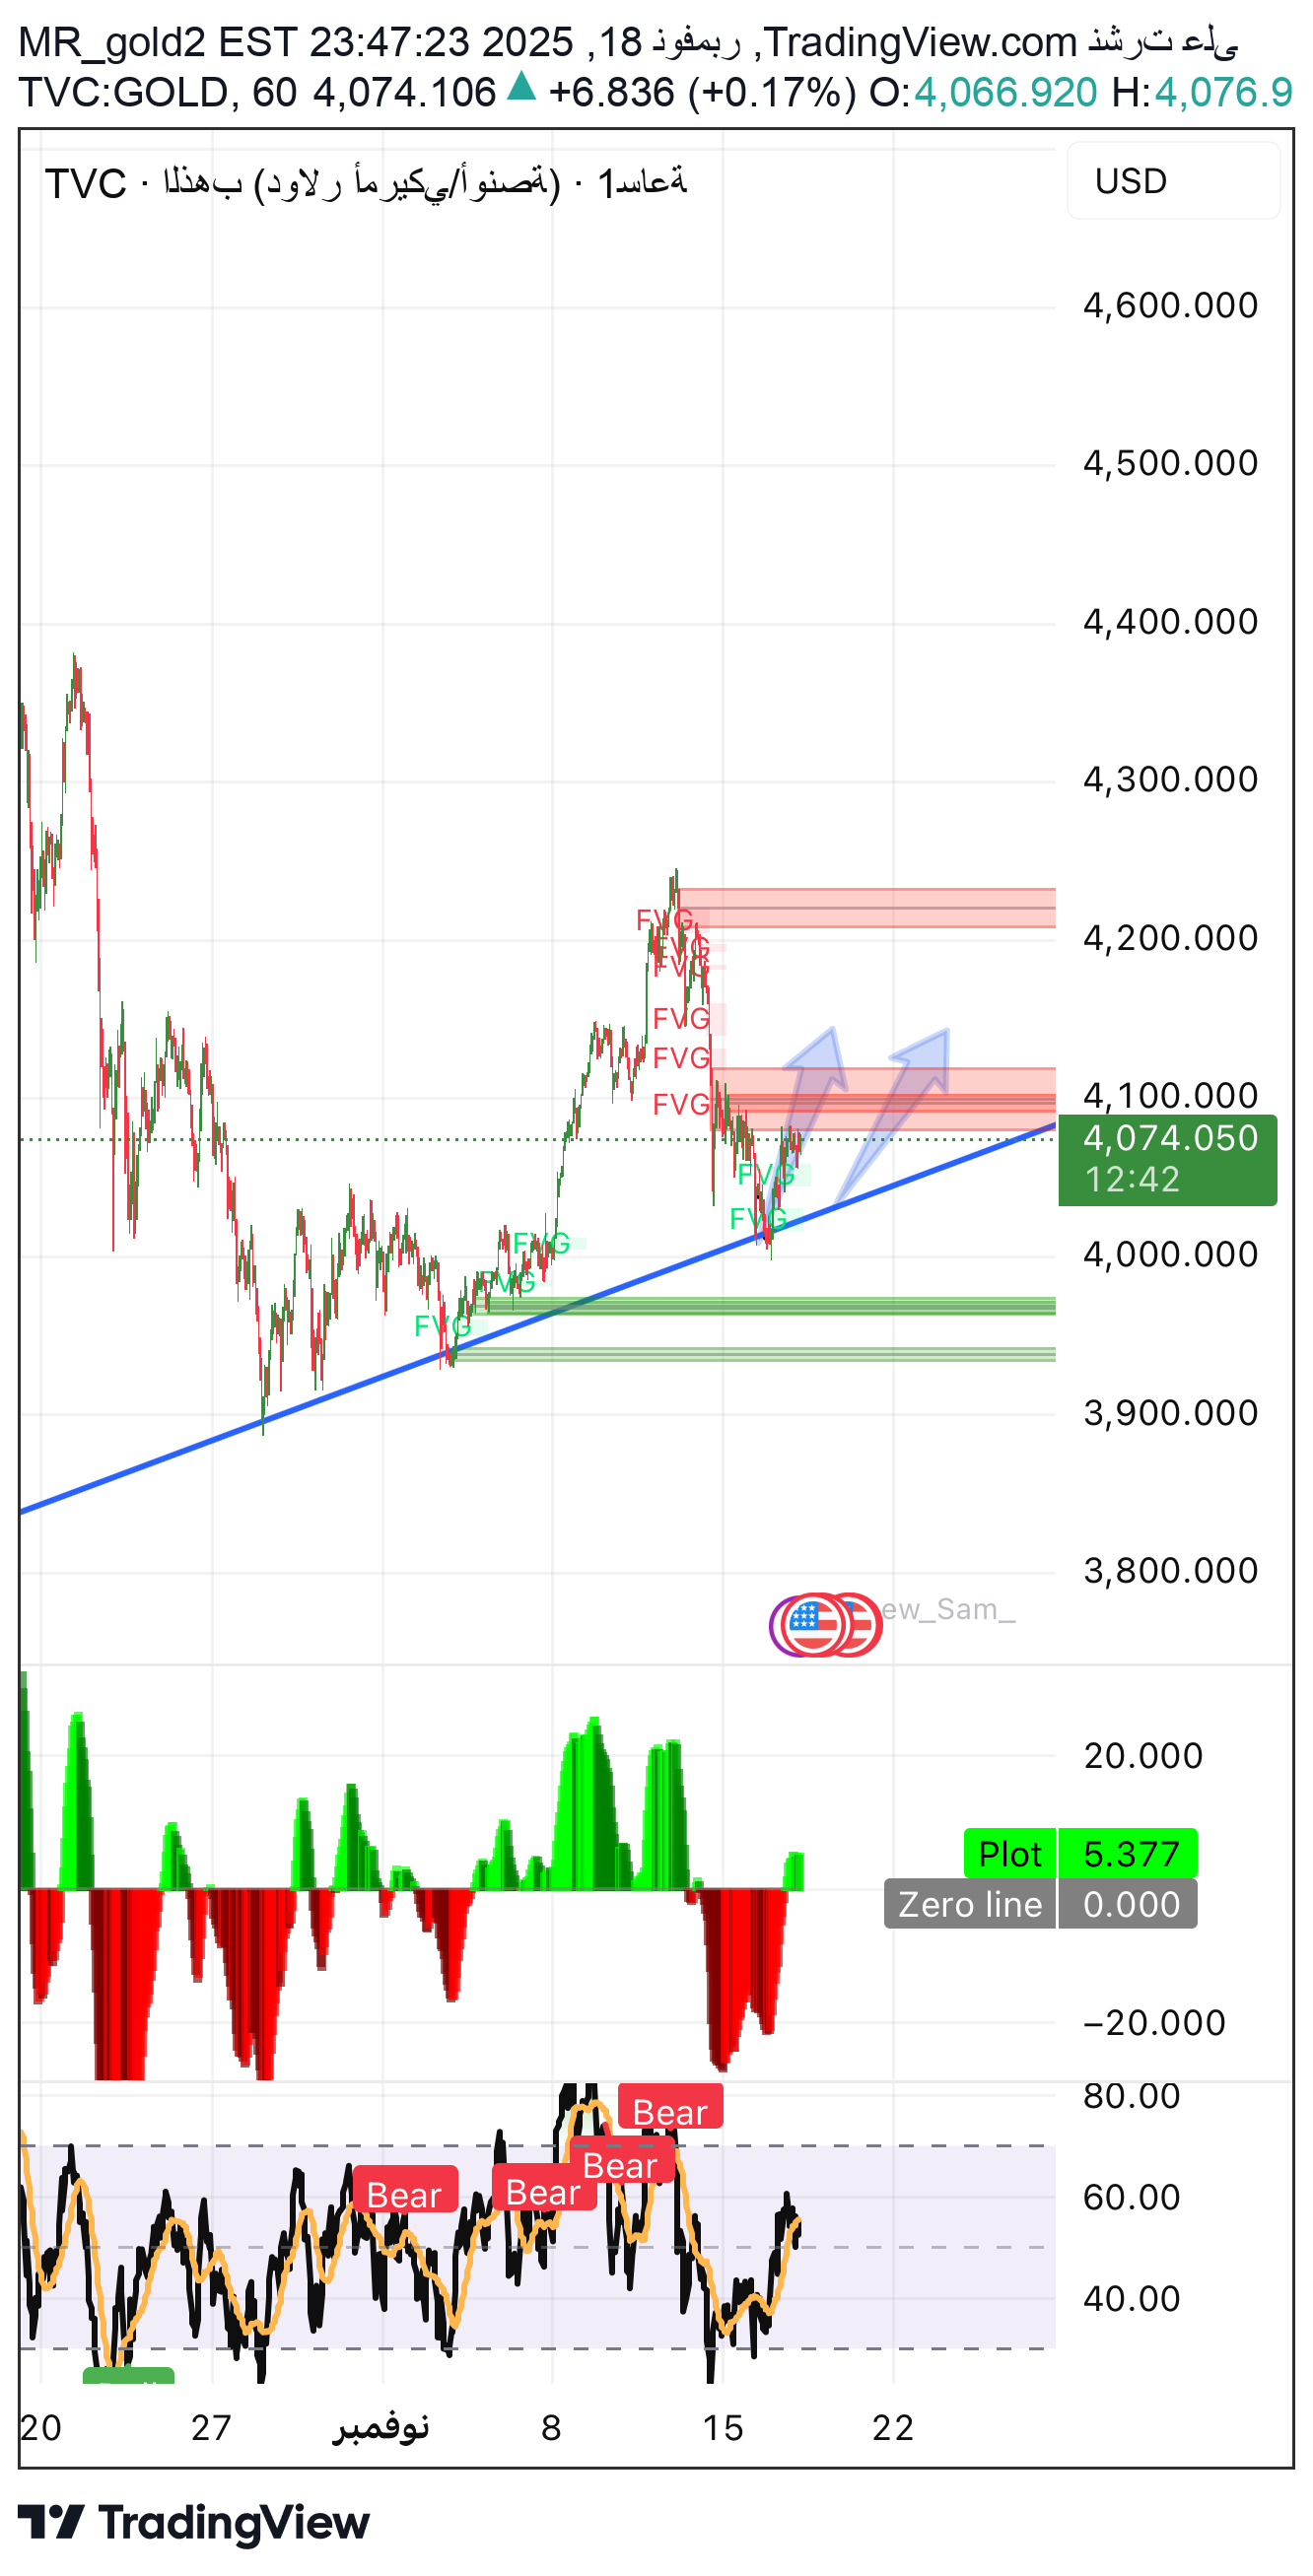
Gold is the beginning of a new week that begins with strong price fluctuation in critical areas Current price: 4080 – 4070 ■ First: Technical analysis ✔ Trend •The biggest trend: bullish •Intermediate trend: a downward correction that ended at 4020 – 4050 •Intraday trend: Bullish reversal attempts after forming a strong bottom ✔ Technical data on the chart •Cross between the averages appeared → indicates weak downward momentum. •The price is still above all areas of strong demand. •The recent decline has been completely absorbed → clear buying appetite. ■ Second: Elliott Wave analysis •The drop was Wave 4 Correction. •The price is currently at the beginning of a bullish Wave 5. 🎯 Wave 5 objectives: 14125 24170 34230 ■ Third: Time Cycle analysis •An upward time cycle that extends until November 22. •The current movement is consistent with the bullish time window. •There is no bearish peak before the 22nd, which supports the rise. ■ Fourth: Digital analysis 🟢 Digital supports •4070 •4050 •4020 •3970 (major bottom) 🔴Digital resistors •4100 •4125 •4140 •4170 •4230 •4310 ■ Fifth: Fundamental analysis •The dollar is under pressure. •The Fed’s statements tend to calm down. • Yields decline = direct support for gold. •Markets return to safe havens. 👉 Fundamentals = positive for gold at the moment. ■ Sixth: Price Action •Strong price rejection candles from 4050 – 4070. •Long Tail formation below the area → institutional entry. •The price returning above 4080 is a bullish confirmation candle signal. ■ Seventh: Support & Resistance 🟢 Supports •4070 •4050 •4020 🔴 Resistors •4100 •4125 •4140 •4170 ■ Eighth: Chart Patterns •Continuation of the ascending channel. •The last landing was inside the channel and did not break it. •A Bullish Reversal pattern is forming now. ■ Ninth: Digital models AB=CD •AB=CD pattern completed at 4050 → 100% upside support. ■ Tenth: Harmonic •Bullish Bat pattern bounced from the PRZ (4020–4050). •His goals are 4170 – 4230. ■ Eleventh: S&D demand and supply areas 🟢 Request •4070 – 4050 •4050 – 4020 •4020 – 3970 (main order) 🔴 The offer •4100 – 4125 •4140 – 4170 •4230 – 4310 ■ Twelfth: Pivot point Pivotal point for today: 4125 •Above 4125 → returns gold to the strong rise towards 4170 then 4230. •Underneath → a slow gradual rise. 🎯 Final recommendation – 🟢Looking for a reversal signal to buy •4070 (excellent) •4050 (ideal) •4020 (golden opportunity) 🎯 Goals 14100 24125 34140 44170 54230 Important note We do not provide you with financial and investment advice Rather, we provide you with scientific and educational content You are the only person responsible for pressing the buy and sell button Analyst Engineer Ihab Sayed Al Thahab channel
Disclaimer
Any content and materials included in Sahmeto's website and official communication channels are a compilation of personal opinions and analyses and are not binding. They do not constitute any recommendation for buying, selling, entering or exiting the stock market and cryptocurrency market. Also, all news and analyses included in the website and channels are merely republished information from official and unofficial domestic and foreign sources, and it is obvious that users of the said content are responsible for following up and ensuring the authenticity and accuracy of the materials. Therefore, while disclaiming responsibility, it is declared that the responsibility for any decision-making, action, and potential profit and loss in the capital market and cryptocurrency market lies with the trader.