Technical analysis by MR_gold2 about Symbol PAXG on 11/18/2025

MR_gold2
طلاء الذهب عند مفترق طرق: هل نهاية الهبوط وارتداد وشيك؟ (تحليل شامل)
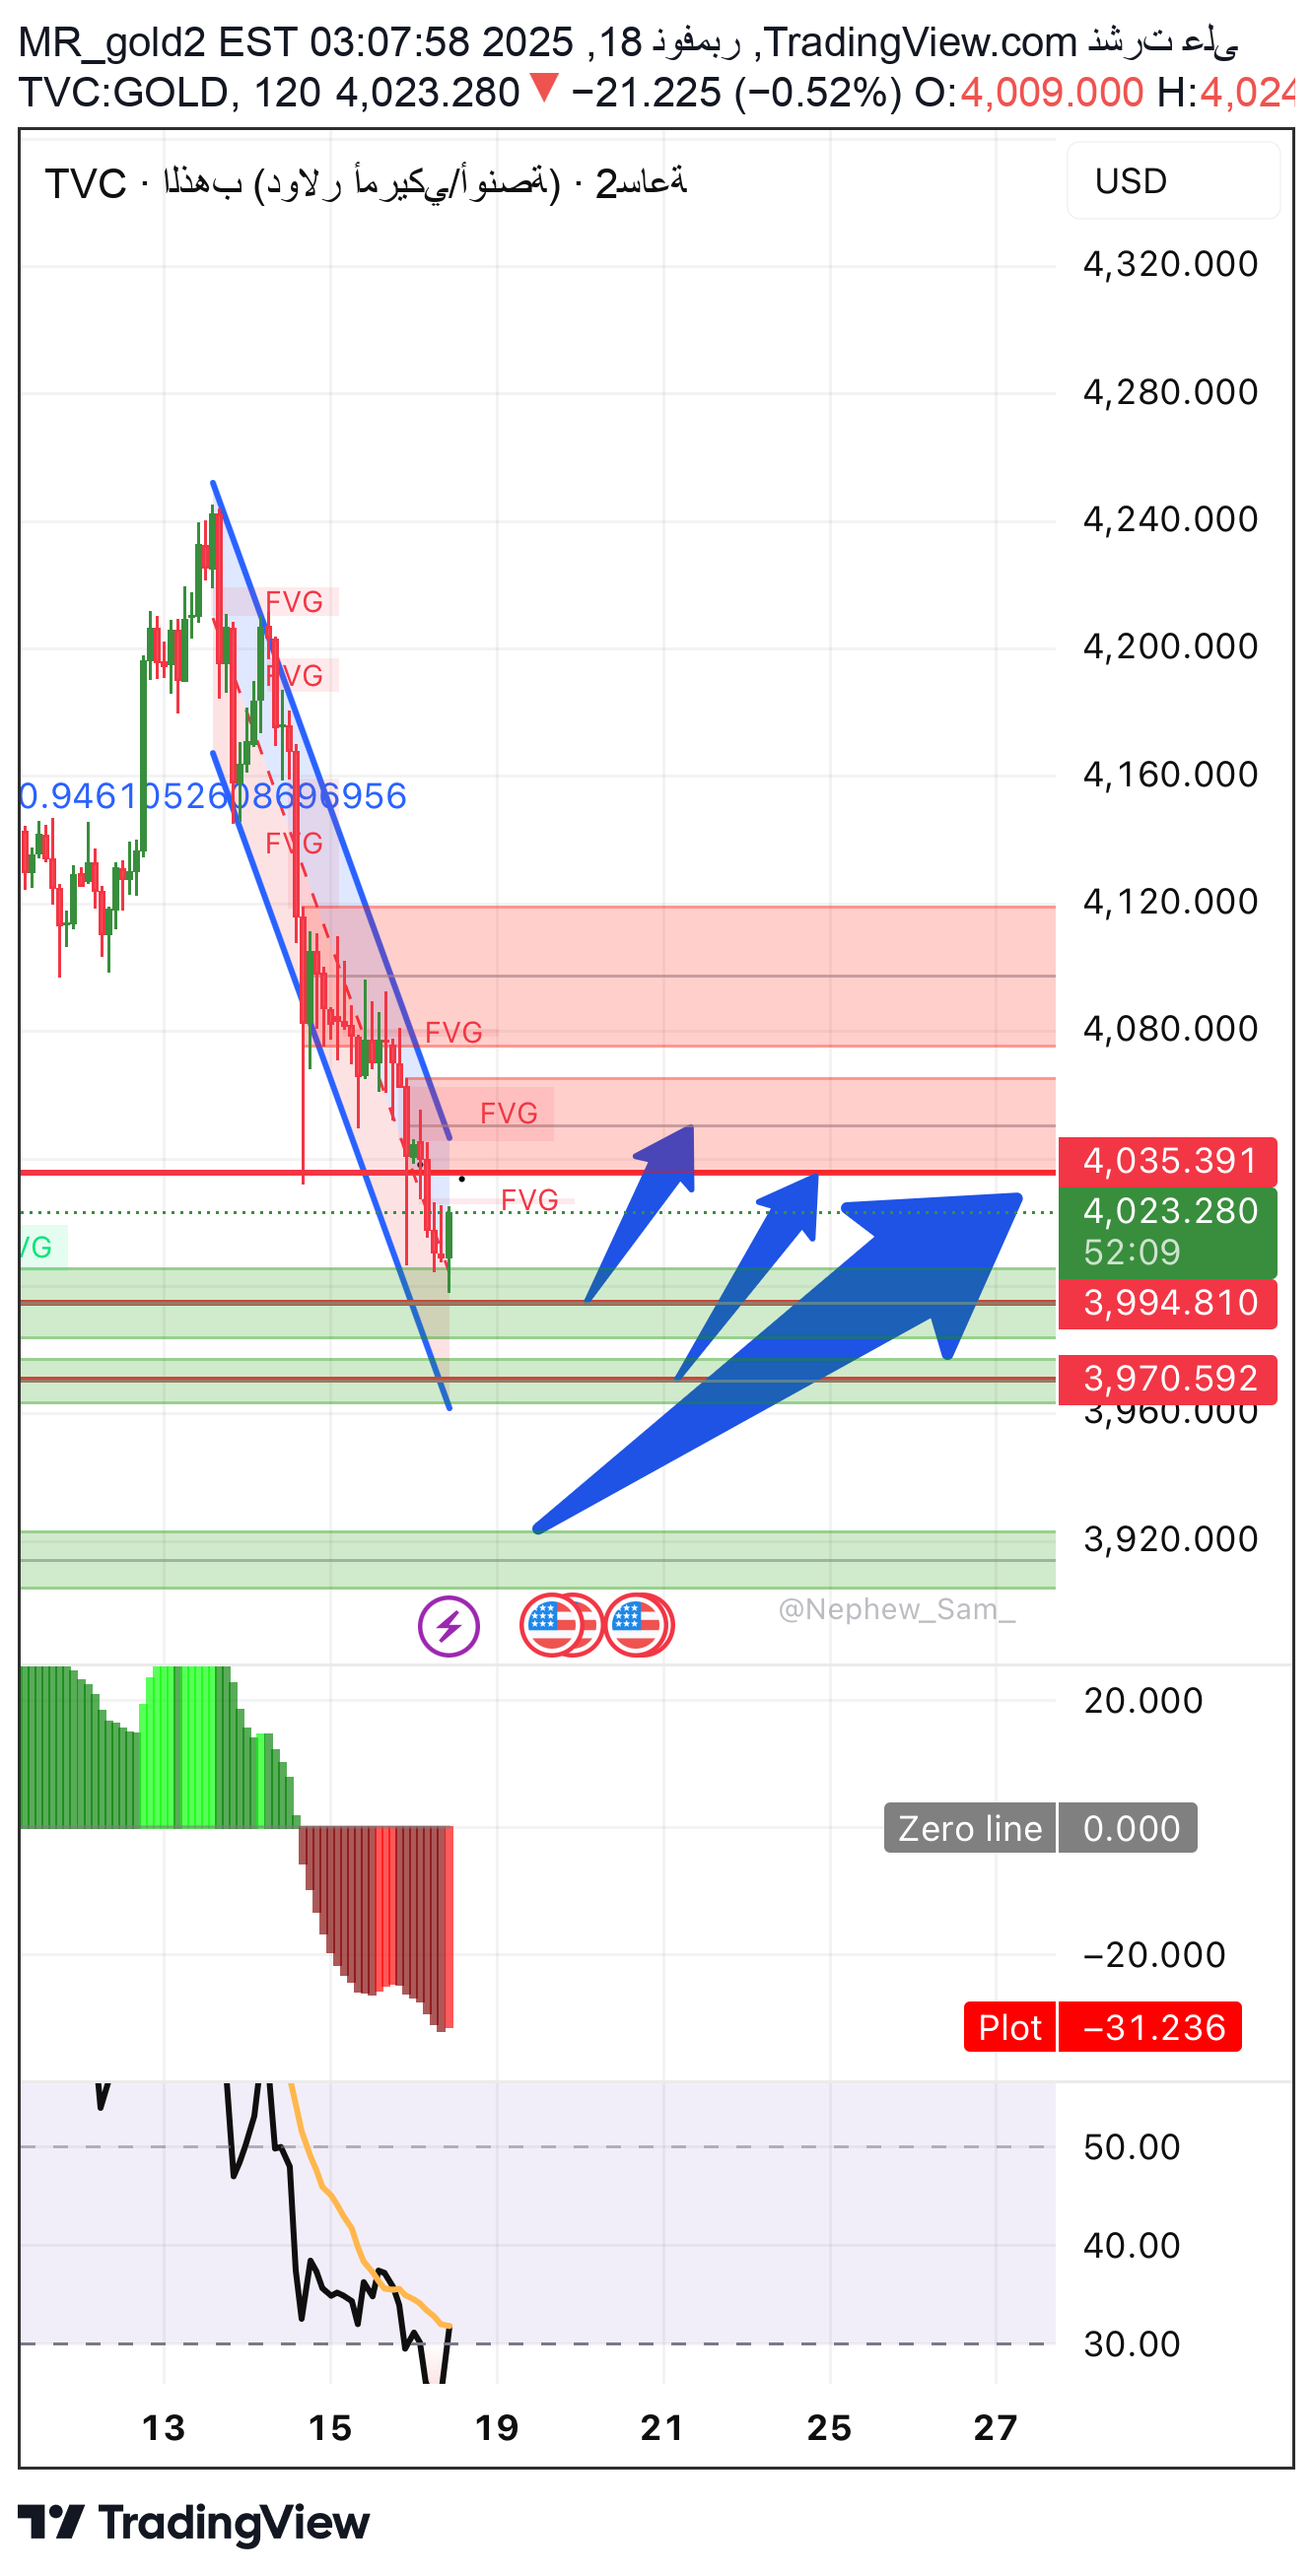
⚠️ The price has currently reached a very sensitive area... and there is a very high probability that the current decline will end. ⸻ ■ First: Technical analysis ✔ General trend: •Down within a sharp downward channel shown by the two blue lines. •The price is now at the lower channel border = an area from which a strong rebound often occurs. ✔ Important Note: The first retracement candle has now appeared above the demand zone → the first bearish exit signal. ⸻ ■ Second: Elliott wave analysis Waves The situation indicates: ✔ Wave C is falling from the ABC pattern. C extension levels: •0.946 = current potential bottom (4010–4000) •1.272 = 3965 •1.618 = 3910 🟢 The area 4000–3965 is the 70% end zone of wave C. ⸻ ■ Third: Time Cycles analysis The current down cycle ends between: ⏳ November 16 - 20 And you are now within this range = Perfect timing for the reversal. ⸻ ■ Fourth: Fibonacci numerical analysis The most important Fibo levels: •0.618 = 4060 (break it) •0.786 = 4005 (reached it and bounced back from it today) •1.0 = 3960 (numeric landing target) So: 🎯 4005–3960 is the golden zone for a bullish reversal. ⸻ ■ Fifth: Fundamental analysis Negative factors: •The strength of the dollar today. •Bond pressure on metals. •Absence of supportive news for gold. Positive factors: •The market is approaching an institutional buying zone. •There are no additional reasons for the continuation of the violent decline at this level. •Everyone sold… → Market makers are preparing for a reversal. ⸻ ■ Sixth: Price Action Important signals: •Long-tailed candles at the lower channel → liquidity absorption. •The beginning of a breakthrough between the highs and lows within the descending channel. •Bull candle appeared below RSI = reversal signal. ⸻ ■ Seventh: Supports and resistances 🟢Supports: 1.4000 2.3980 3.3960 (strongest) 🔴 Resistors: 1.4050 2.4100 3.4160 – 4200 (strong supply area) ⸻ ■ Eighth: Demand and supply area 🟢Demand areas: •4000–3980 •3980–3960 These are the two strongest buying areas currently on the frame. 🔴Display areas: •4100–4160 •4180–4200 ⸻ ■ Ninth: Harmonic Model consists of: ✔ Bullish Bat / Butterfly Point D is located at: 🎯 4000–3980 The model confirms that the current decline has ended or is about to happen. ⸻ ■ Tenth: POC installation points Point of Control The old volume is located at: 4058 Hacked = Confirmation of a change in trend to the upside. ⸻ ■ Eleventh: Pivot area Pivot today: 4045 Gold below = correction Gold above it = the beginning of a strong rise. ⸻ 🎯 Conclusion – look at the next trend ✔ Real-time trend: A final drop to 4000 - 3980 and then a rise. ✔ What's happening now? Price touches: •Lower descending channel border •Strong Fibo area •Strong demand area •C wave end zone •The end date of the cycle 👉 These are 5 factors that confirm the imminence of a reversal. ⸻ 💎 Recommendation (technical analysis only - not a trading invitation) ✔ We are looking for an entry signal from the best buying areas: 🎯 4000 🎯 3990 🎯 3980 (Shooting, not chasing). ✔ Objectives: •Goal 1: 4050 •Goal 2: 4100 •Goal 3: 4160 ✔ Determine the endowment yourself according to the lot, it must be close Important note We do not provide you with financial and investment advice Rather, we provide you with scientific and educational content You are the only person responsible for pressing the buy and sell button Analyst Engineer Ihab Sayed Al Thahab channel