Technical analysis by MR_gold2 about Symbol PAXG on 16 hour ago

MR_gold2
تحديث الذهب
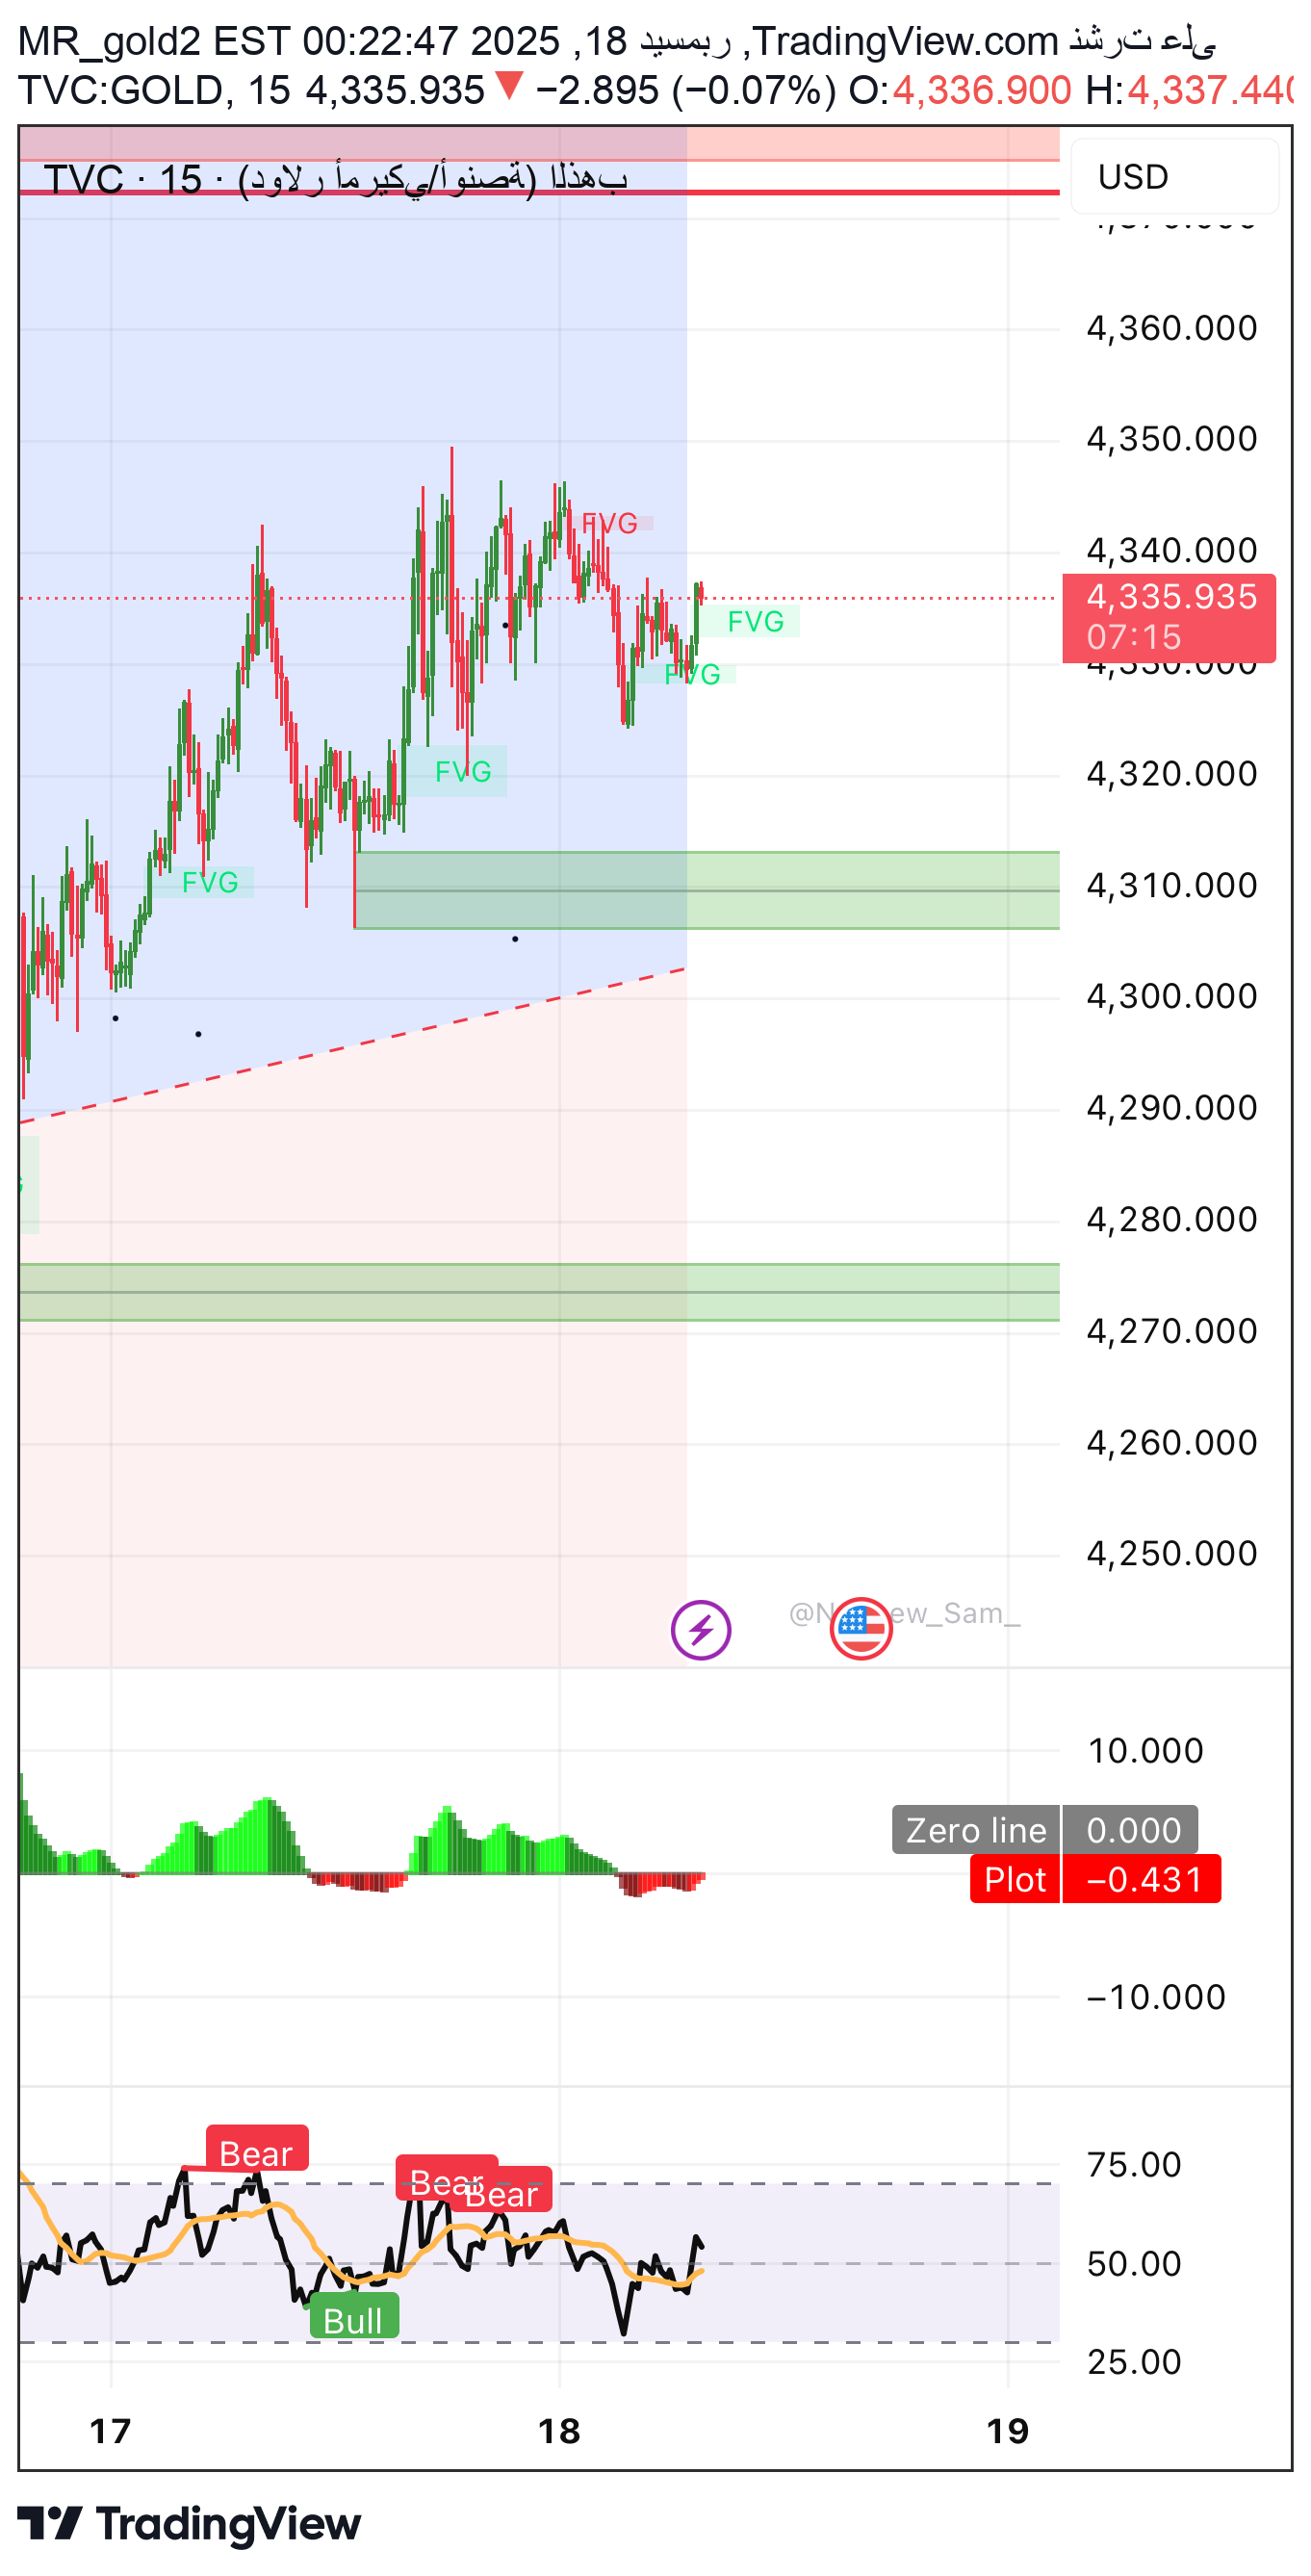
⸻ 1) General situation and trend •Larger trend (4h): Bullish within an ascending channel but the price is currently in a downward correction within the channel (distribution/profit taking area near the top). •Near term (1h-15m): fluctuation/accumulation with attempts to rise met with strong offers near 4335-4345. ⸻ 2) Technical analysis •The price moves between: Upper resistors: 4335–4345 then 4355–4372 •Intermediate support: 4310–4300 •Deeper support: 4285 then 4265–4255 (clear demand area on the chart) •The presence of an upper supply area (red rectangle) makes the rise “conditional” on a clear break and stability. ⸻ 3) Price Action Nearby display areas show: Hesitation + upper tails (price rejection) •Short rises then rapid declines = buy/disposal absorption •As long as the price does not remain above 4345–4355, the possibility of it returning to supports is stronger. ⸻ 4) Supports and Resistances (S/R) Resistors: •4335–4345 (resolution area) •4355–4372 (higher resistance/top + channel ceiling) Support: •4310–4300 (first support + near FVG/focus areas) •4285 (second support) •4265–4255 (potential buy/demand area) •4240 then 4200 (in case of a clear break) ⸻ 5) Supply & Demand areas •Supply (width): 4335–4372 Suitable area for corrective selling provided a rejection/confirmation candle appears. •Demand: 4265–4255 then 4285 Areas that are likely to rebound if the price reaches them with downward momentum and begins to weaken. ⸻ 6) FVG / Fair Value Gaps •Clearly there is an upper FVG near 4335–4345 that is partially “filled” with oscillation. •The presence of FVG/lower gaps closer to support 4300 then 4285/4265 (Usually the price likes to return before the trend completes). ⸻ 7) Digital analysis (Digital / Quant) •Current behavior “digitally” is closer to: •Range/Mean Reversion within a (accumulation) range instead of a direct trend. •Entry priority is from the edges: •Sell from the edge of the offer •Buy from the edge of demand Not in the middle of the range. ⸻ 8) Wave analysis (Elliott/Wave) •Closest reading (at 1h-4h): •Previous strong rise (impulse wave) •Then composite correction (A–B–C or WXY) within the channel •Currently, we appear to be inside wave C/or a corrective bearish wave targeting demand areas before a new upward attempt. ⸻ 9) Time analysis •The current movement suggests a cycle: Impulse → Oscillation → False break/test → Strong movement •Temporally: It is best to wait for the hourly candle to close at the decision areas: •Above 4355 = bullish confirmation •Below 4300 = bearish confirmation ⸻ 10) Indicators (RSI/MACD as shown) •RSI: It moved from areas of strength to decline, which supports the idea of a correction. •MACD: Weak momentum/negative breakout with the previous decline, then an inconclusive recovery attempt. •Conclusion: The indicators support two scenarios based on breaking the levels. ⸻ 11) Technical models (Chart Patterns) On small frames the behavior appears: •Rising channel + internal correction •Possibility of a short triangle/wedge (fluctuation before the explosion) ⸻ 12) Harmonic models •Near the area 4335–4372, an environment suitable for: •Bearish Gartley/Butterfly possible (if completed with your measurements on the chart) Harmonic confirmation can only be done when: •Strong rejection from PRZ + break of nearby support (eg 4310/4300) ⸻ 13) Fixation Points — How do you identify them quickly? fix point = a level that has proven itself 3 or more times across: 1.A clear top/bottom 2. Retest (Touch) 3. A candle closes near it or a strong bounce Your badge currently has candidate mounts: •4335–4345 (top mount) •4300–4310 (middle mount) •4255–4265 (bottom mount/order) ⸻ 14) Pivot Zone •Nearest daily/pivot price pivot: 4310–4330 Any stability above it tends to be positive, and breaking it activates negativity towards 4285 and then 4265. ⸻ 15) Recommendation (clear scenarios) This is educational analytical content and not financial advice. The decision and risk management is yours. ✅ Sell scenario (strongest if a reversal signal appears) •Sell: 4340–4345 •SL: 4355 (for “very close” or “safe” stop) •TP1: 4310–4300 •TP2: 4285 • ✅ Purchase scenario (only on condition) • Buy from 4265–4255 or after a breakout and stability above 4355 • Its targets are towards 4335 then 4372.