Technical analysis by MR_gold2 about Symbol PAXG on 12/16/2025

MR_gold2
تحديث الذهب
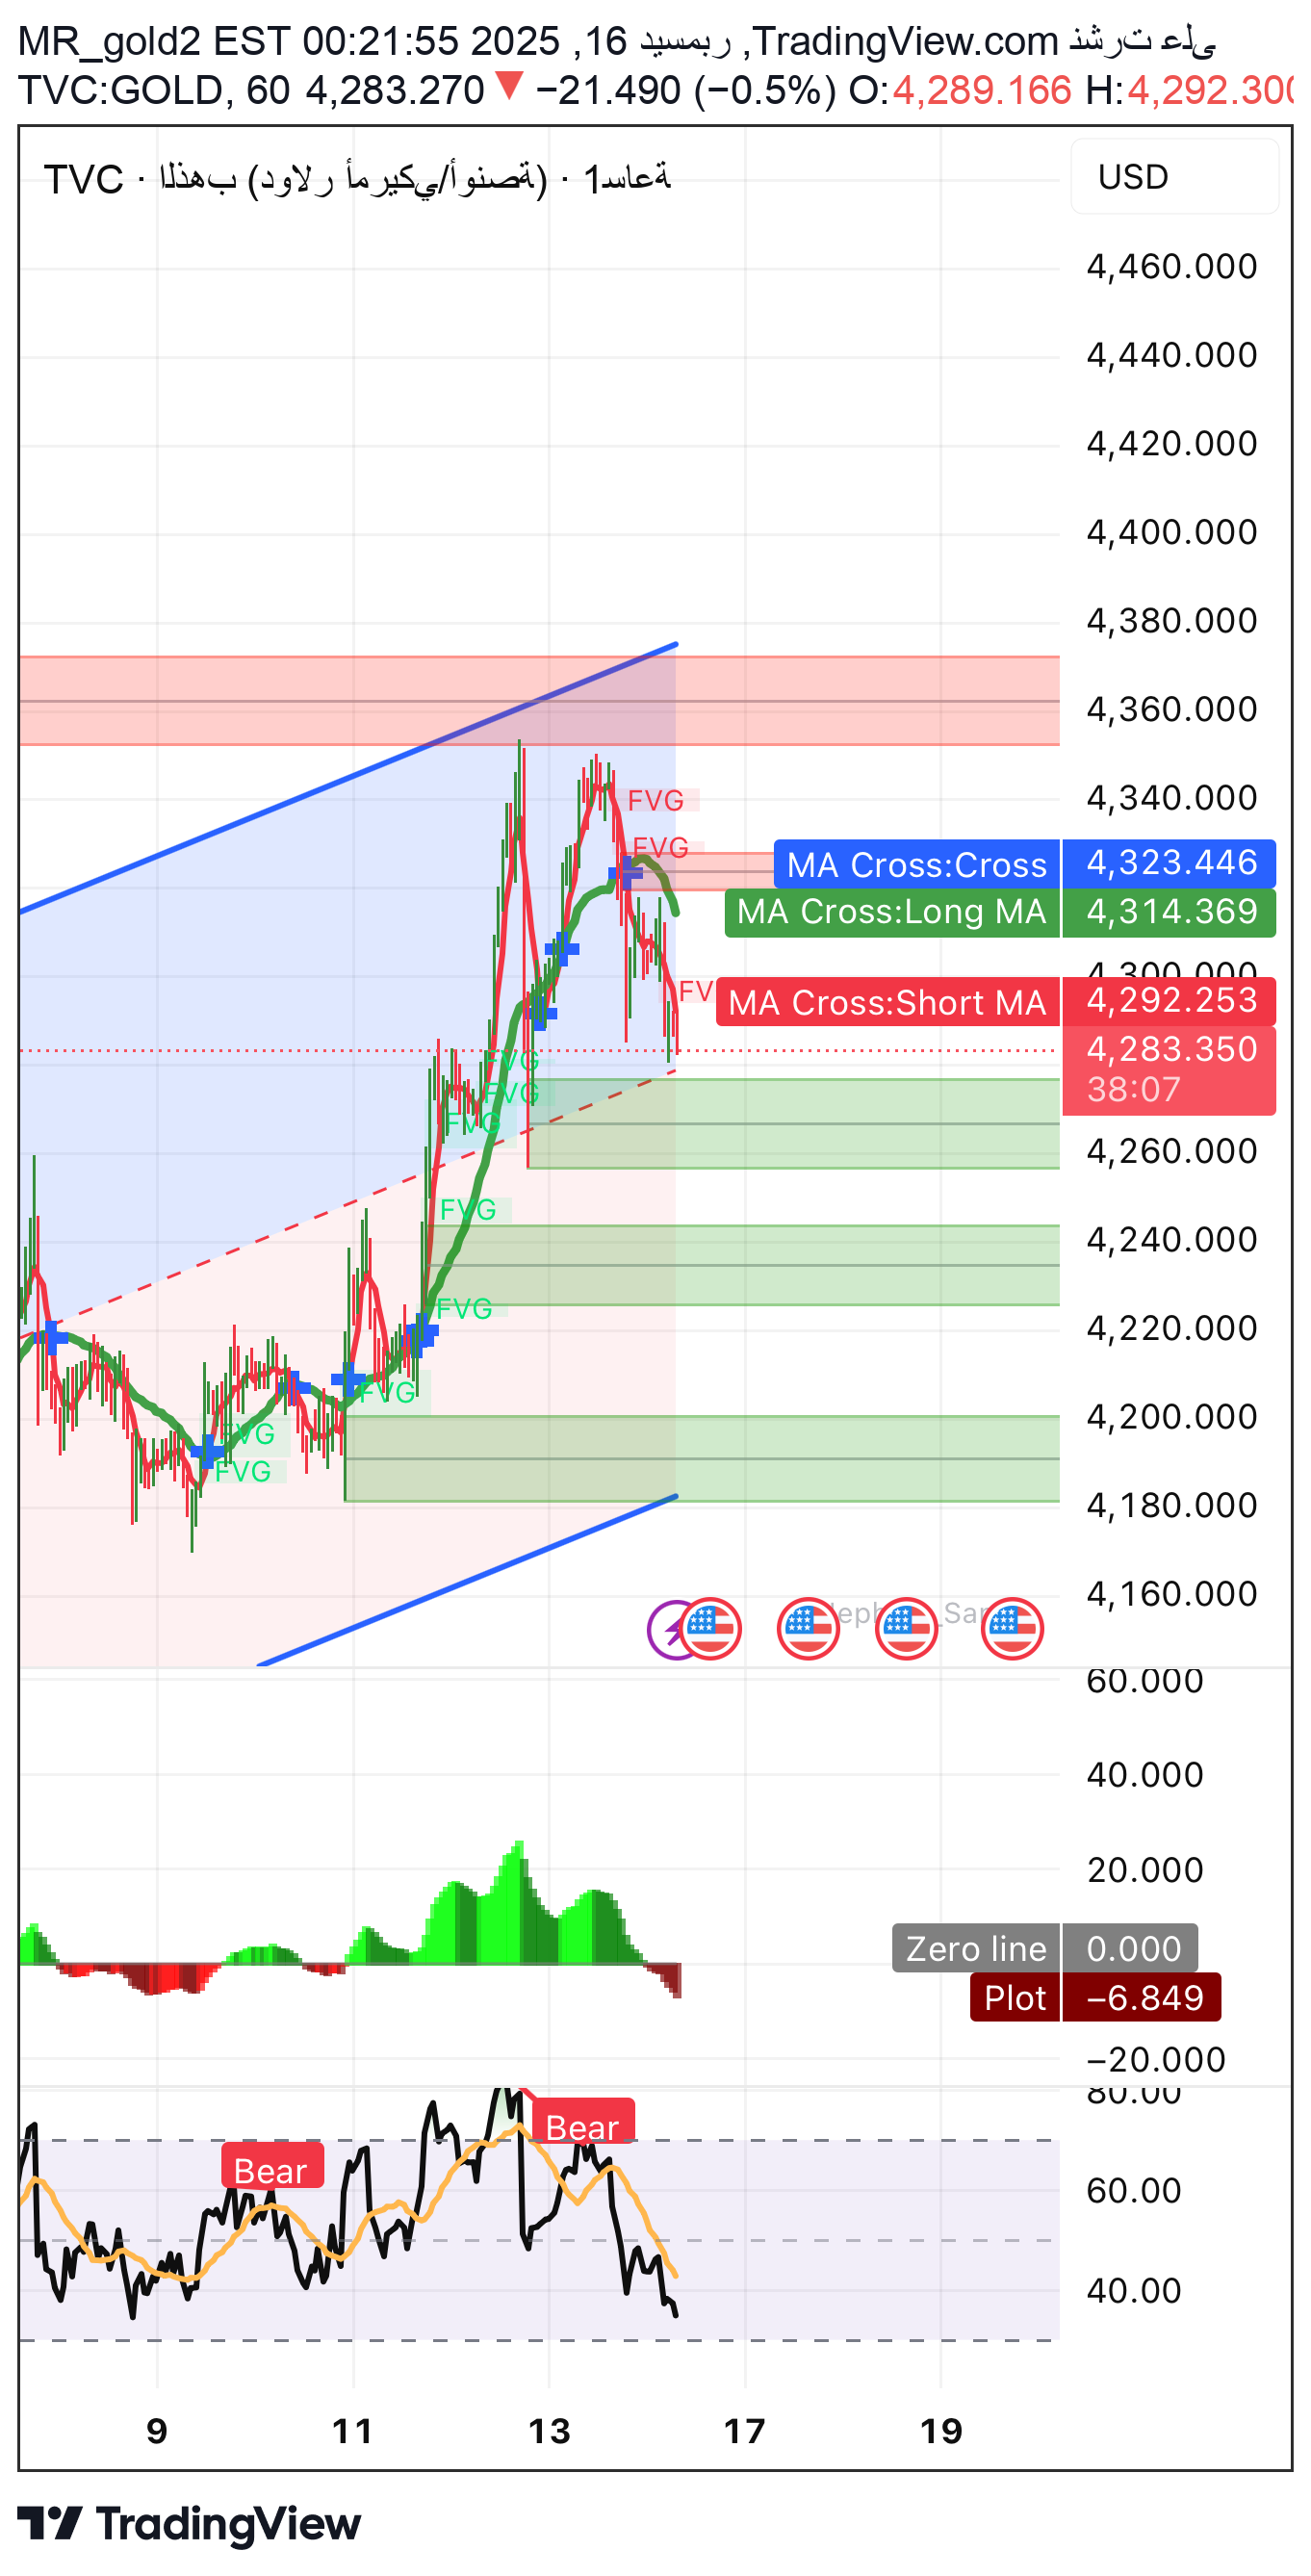
Okay, this is a comprehensive and updated analysis of gold (XAUUSD) based on the last image and the hourly frame (H1), and in the same copyable text format: ⸻ 📊 Technical Analysis •The price is still within an ascending channel on the larger frame, but is currently moving in a downward correction from the upper border. •MA Cross Negative: short average below long → instantaneous selling pressure. •Trading below the average congestion area (±4300) confirms weak upward momentum. ⸻ 🌊 Elliott Wave Analysis •The recent rise is likely to be a completed fifth wave within the uptrend. •The current decline = corrective wave (ABC): •A primary landing •B Weak bounce •C running landing •Breaking the bottom of C opens the way for a deeper correction before completing the general trend. ⸻ ⏱️ Time Analysis •The price is in a time reversal window after the top is completed. •The coming hours are crucial: •Stability above support = slowing down •Breaking support = corrective acceleration ⸻ 🔢 Digital Analysis (Digital / Fibonacci) The current correction targets: •38.2% then 50% Fibonacci of the ascending wave. •Digital convergence between Fibo + demand areas increases the possibility of a temporary bounce. ⸻ 📰 Fundamental Analysis •There is no news supporting the intraday rise now. •A state of anticipation and pressure from the dollar supports a temporary correction. •The average outlook for gold remains positive, but after completing the correction. ⸻ 🕯️ Price Action •Lower Highs. •Successive rejection candles from upper FVG areas. •The absence of a strong close above 4300 confirms sellers’ control intraday. ⸻ 🧱 Support & Resistance 🔻 Supports: •4280 – 4265 (first support + anchor point) •4245 – 4230 (strong demand area) •4200 (axial support) 🔺 Resistors: •4300 – 4320 •4350 – 4375 (display area + channel border) ⸻ 📐 Chart Patterns •Correction within an ascending channel (Pullback). •Failure of previous upper penetration (False Break). ⸻ 🔣 Digital models •Numerical weakness in rising versus falling waves. •Repeated closing failure over the same resistances. ⸻ 🦋 Harmonic models •Bearish Gartley/Butterfly completion likely near: •4320 – 4370 •The model supports the continuation of the current correction. ⸻ 🟩 Supply and demand areas •🟥Width area: 4320 – 4375 •🟩 First order area: 4245 – 4265 •🟩 Second demand area: 4200 – 4180 ⸻ 📍 Fixation Points •Top mount: 4320 •Medium fixation: 4280 •Bottom mount: 4245 Breaking any level determines the next acceleration. ⸻ 🎯 Pivot Zone •4275 – 4290 •Inside = oscillation • Below = downward continuation •Close the top = calm the correction ⸻ 🟢Trading Recommendation 🔴 Corrective selling (if signs of a reversal appear) •Sale from: 4295 – 4300 •Stop loss: above 4300 near Objectives: •🎯 4280 •🎯 4265 •🎯 4245 🟢Search for purchase (from order only): •Buy from: 4255 – 4225 •Stop loss: break 4180 Objectives: •🎯 4300 •🎯 4360 •🎯 New highs later ⸻ ✅ Conclusion •The general trend is up, but we are entering a healthy correction. •Selling is currently corrective from resistances. •Purchase only from confirmed demand areas.