
MAAwan
@t_MAAwan

What symbols does the trader recommend buying?
Purchase History
پیام های تریدر
Filter
MAAwan
بیت کوین در مسیر سقوط! الگوی مثلث نزولی و هارمونیک چه سرنوشتی را رقم میزنند؟
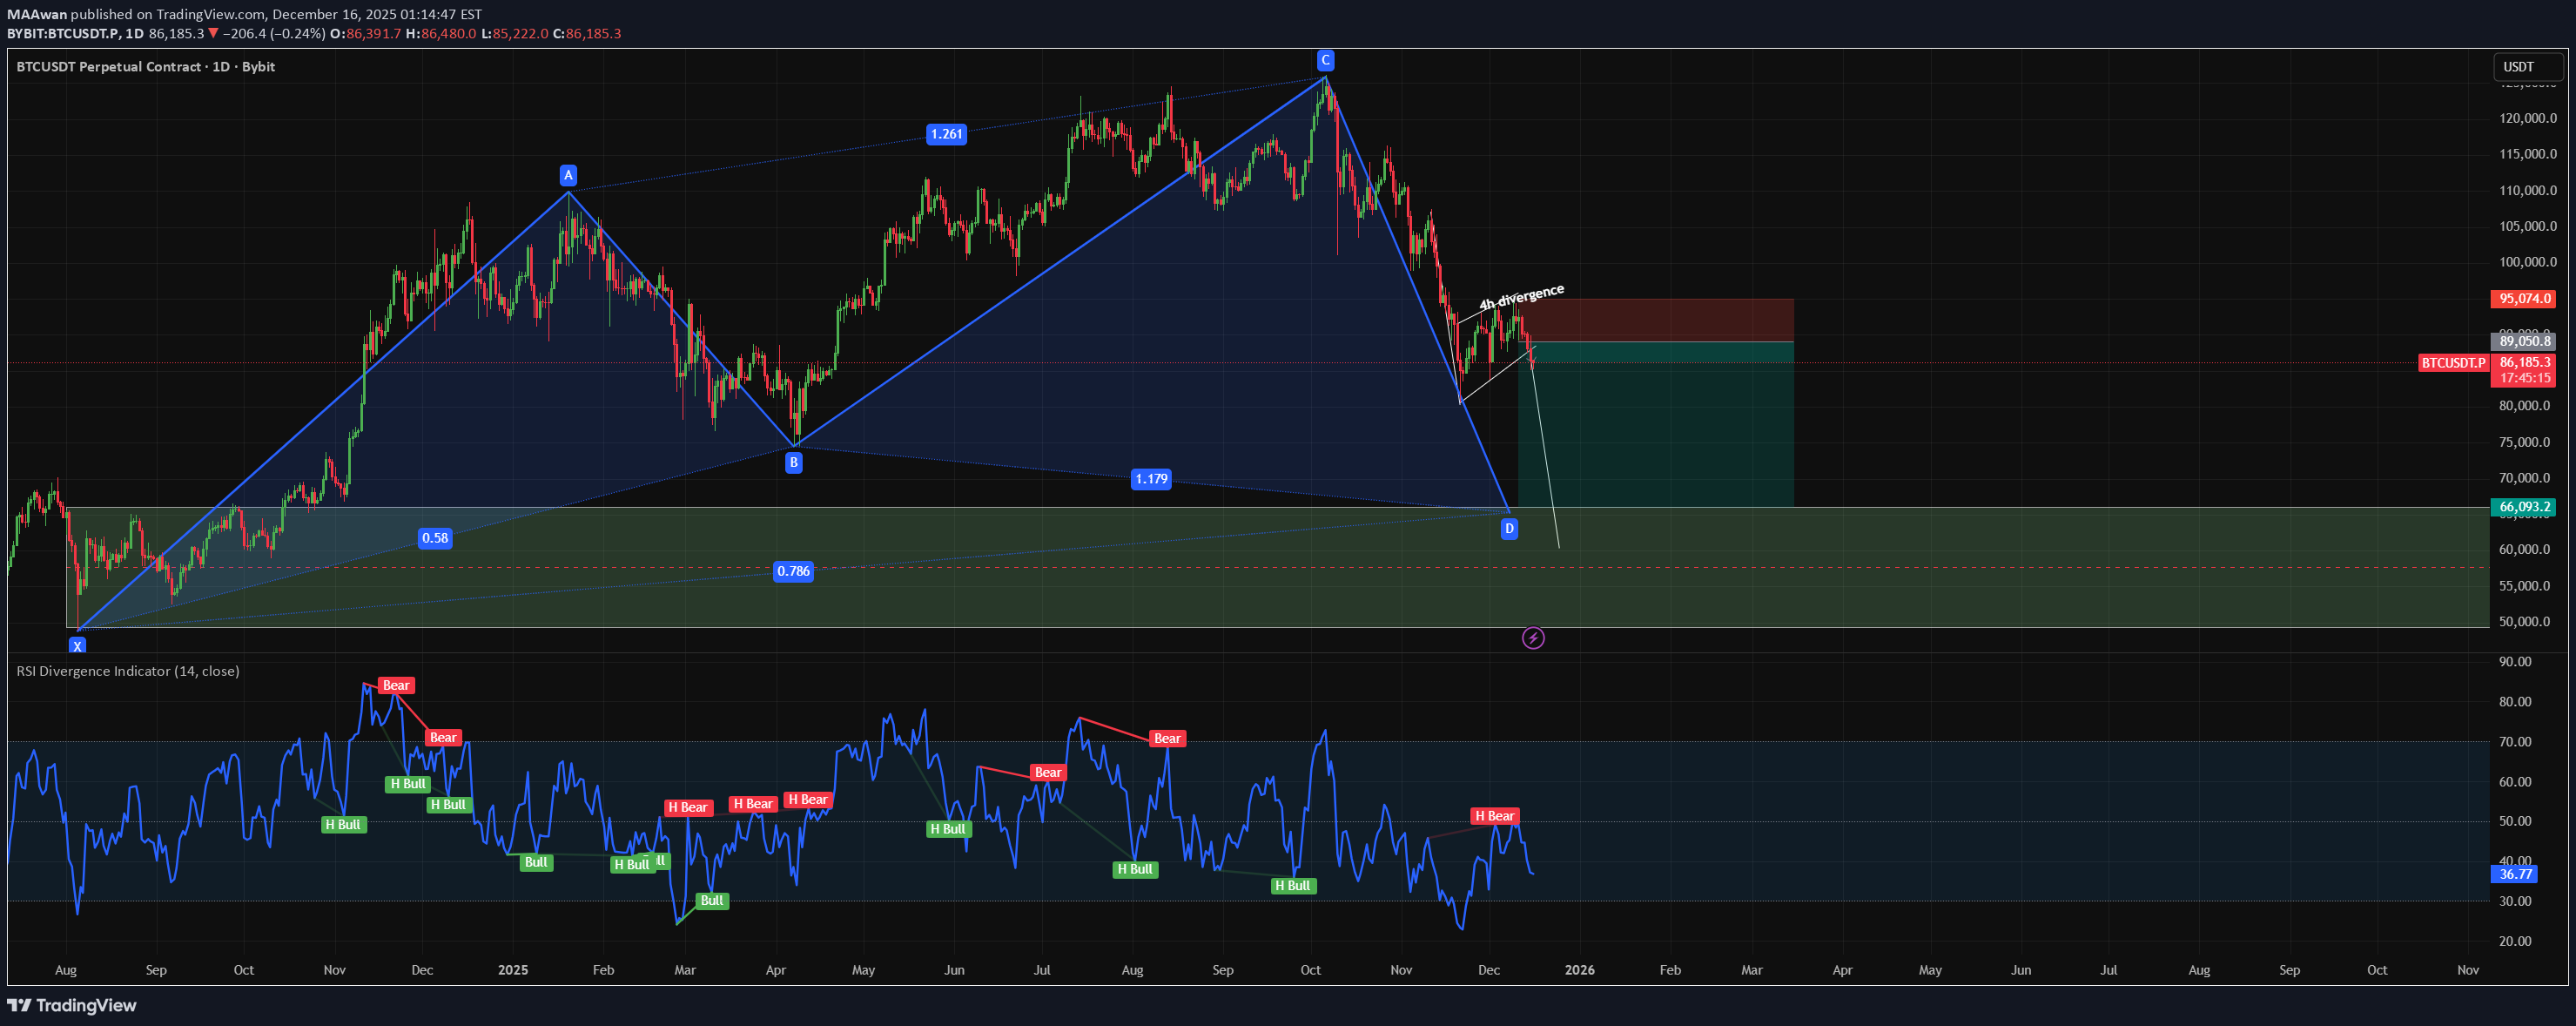
Market Context Bitcoin remains in a daily downtrend following the completion of a large Cypher Harmonic structure. After the impulsive selloff from point C, price has entered a bearish flag consolidation, reinforcing the probability of trend continuation lower rather than reversal. This is classic impulse → consolidation → continuation behavior. Harmonic Structure Recap XA: Strong impulsive advance. AB: Corrective retracement (~0.58). BC: Extension into 1.26, forming exhaustion at point C. CD (In Progress): Expansion toward 0.786 of XC, projecting completion near $60K–$66K. The harmonic structure provides the macro roadmap; the bearish flag provides the execution trigger. Bearish Flag Breakdown Flag formed after a high-momentum selloff (flagpole). Price is consolidating inside a descending corrective channel. Volume has contracted during consolidation — textbook bearish flag behavior. Recent rejection from the upper boundary confirms seller dominance. A breakdown below the flag low should trigger continuation toward the Cypher D zone. Structure & Momentum Market structure: Lower highs, lower lows intact. Daily RSI: Holding below 40 No bullish divergence present Confirms bearish continuation bias Prior demand levels have failed → now acting as resistance. Trade Plan Primary Setup: Bearish Continuation Short Entry (Aggressive): Breakdown below flag support Short Entry (Conservative): Pullback into $88K–$95K supply zone Invalidation: Daily close above $95,000 Targets: TP1: $78,000 TP2: $70,000 TP3: $60,000 – $66,000 (Cypher D completion / HTF demand) Risk remains asymmetric to the downside while price stays below flag resistance. Alternative Scenario Only a clean daily close above $95K, followed by structure reclaim, would invalidate: Bearish flag Cypher continuation Daily downtrend bias Until then, all upside moves are corrective. Conclusion Bitcoin is aligning two high-probability bearish structures: Cypher Harmonic continuation Bearish flag consolidation This confluence significantly increases the probability of a deeper corrective leg toward HTF demand. Patience favors sellers. Bias: Bearish Timeframe: Daily / Swing Pattern: Cypher + Bearish Flag Invalidation: Daily close > $95K Target Zone: $60K–$66K
MAAwan
فروپاشی پرچم نزولی بیت کوین: سیگنال ورود فروشندگان با واگرایی ۱ ساعته!
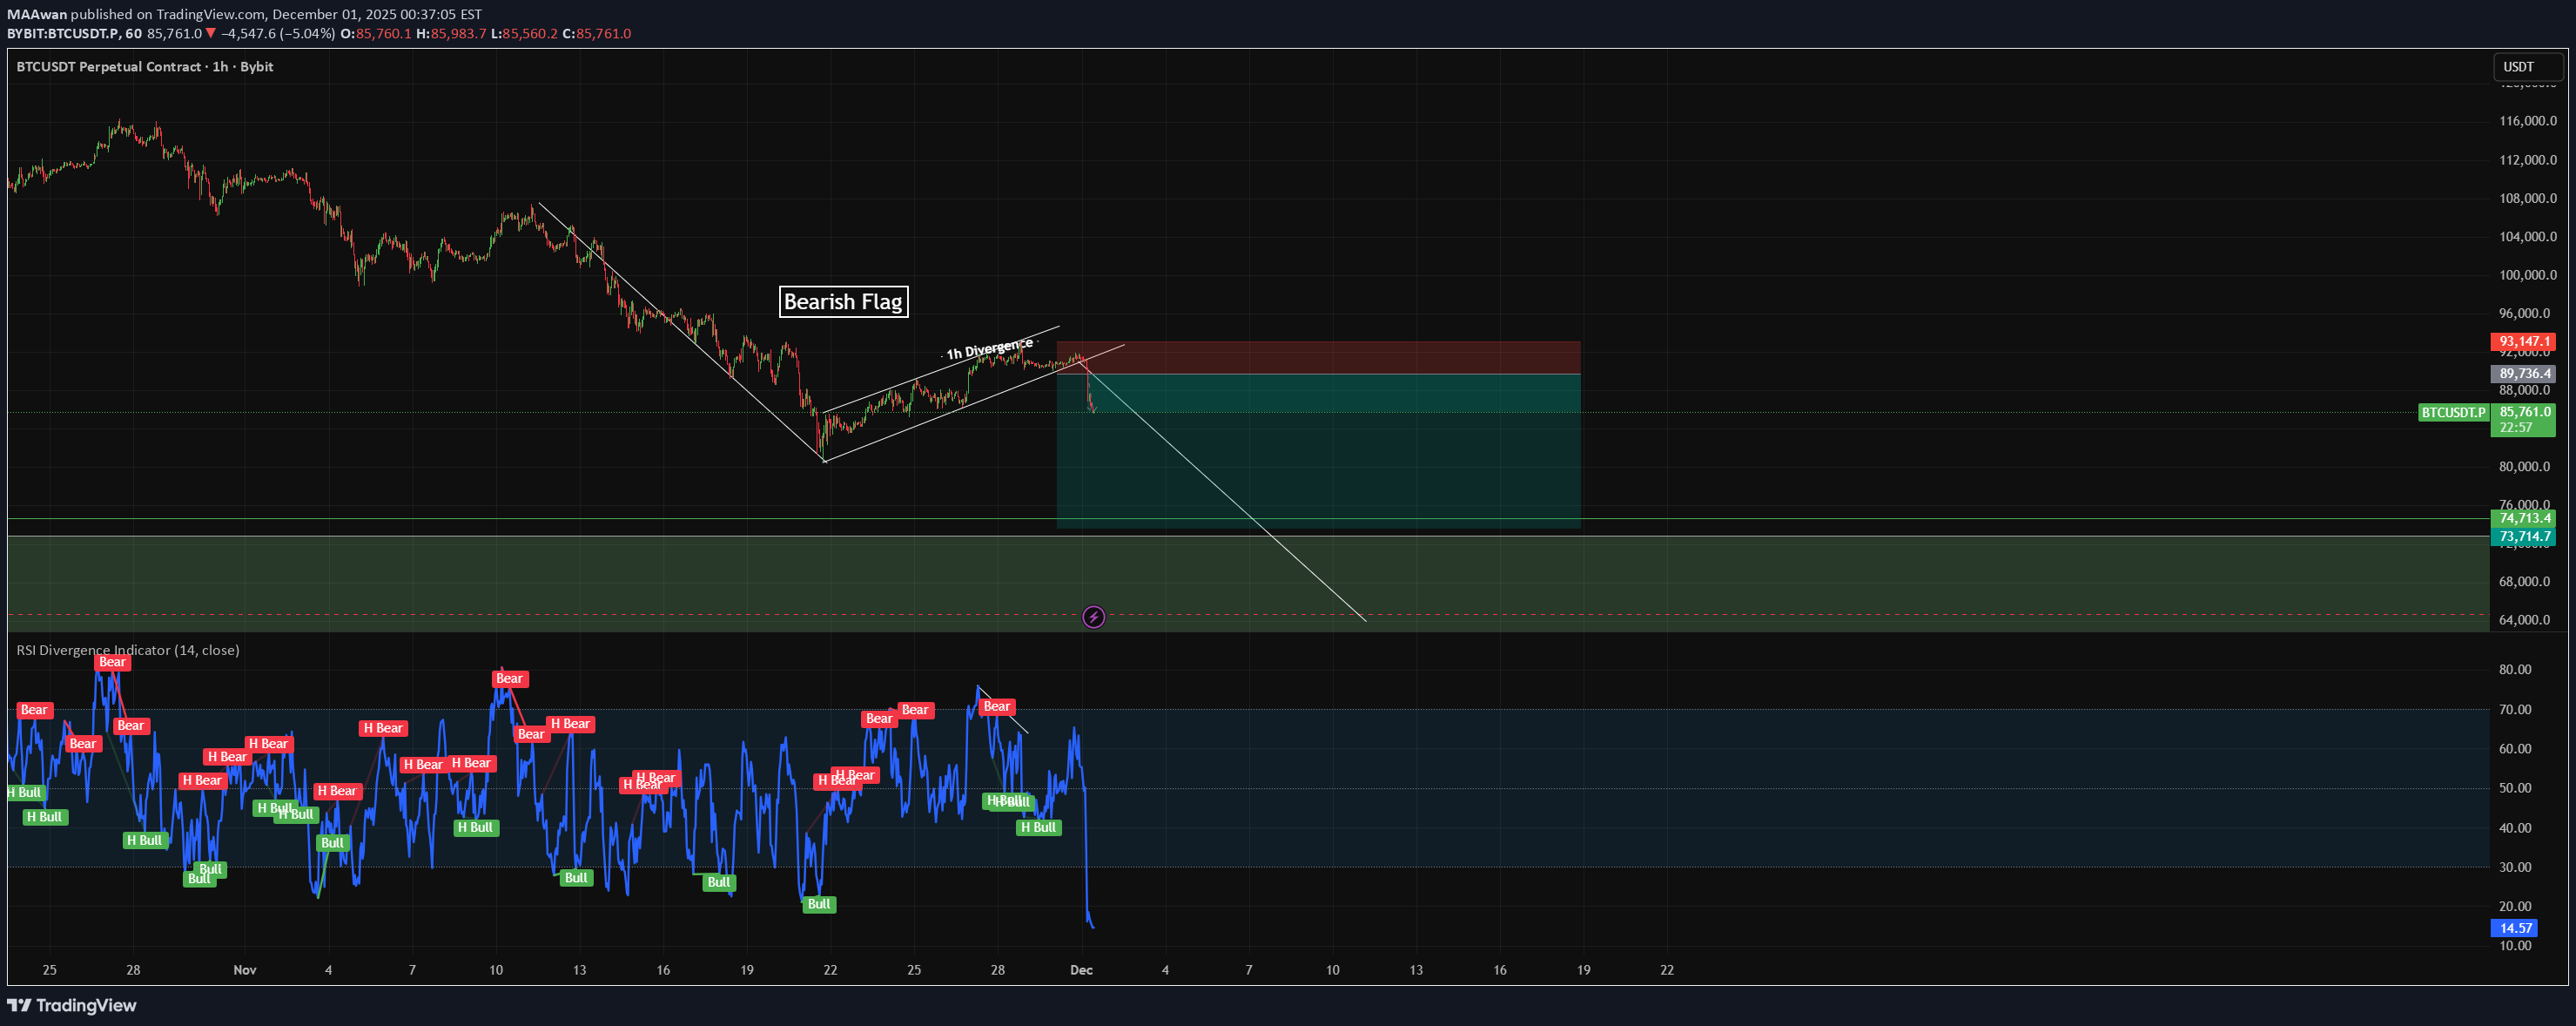
Bitcoin just broke down from a clear bearish flag structure after forming 1H bearish divergence right at the flag’s upper boundary. This is a classic continuation setup after the strong impulsive drop that came before it. The flag acted as nothing more than a relief channel — price kept grinding upward with weakening momentum while RSI printed lower highs. That’s the textbook recipe for a bearish divergence and a high-probability breakdown. Now that price has snapped below the flag support, the structure favors a continuation of the previous bearish leg. 🔥 Key Points Strong impulsive drop → consolidation inside rising flag 1H bearish divergence signaling exhaustion Clean breakdown confirms bearish continuation Momentum finally aligned with structure — sellers taking control again Downside levels marked on your chart line up well with previous liquidity pools 📉 Outlook Bias remains bearish unless BTC reclaims the flag structure. A continuation into the lower target zone (highlighted in green on your chart) is the most probable path. If price retraces back into the broken flag for a retest, it would be a fresh continuation entry zone. This breakdown is clean, logical, and follows classic price-action behavior — nothing confusing here.
MAAwan
الگوی هارمونیک سایفر بیت کوین: سیگنال خرید بزرگ در محدوده ۵۰ تا ۶۵ هزار دلار؟
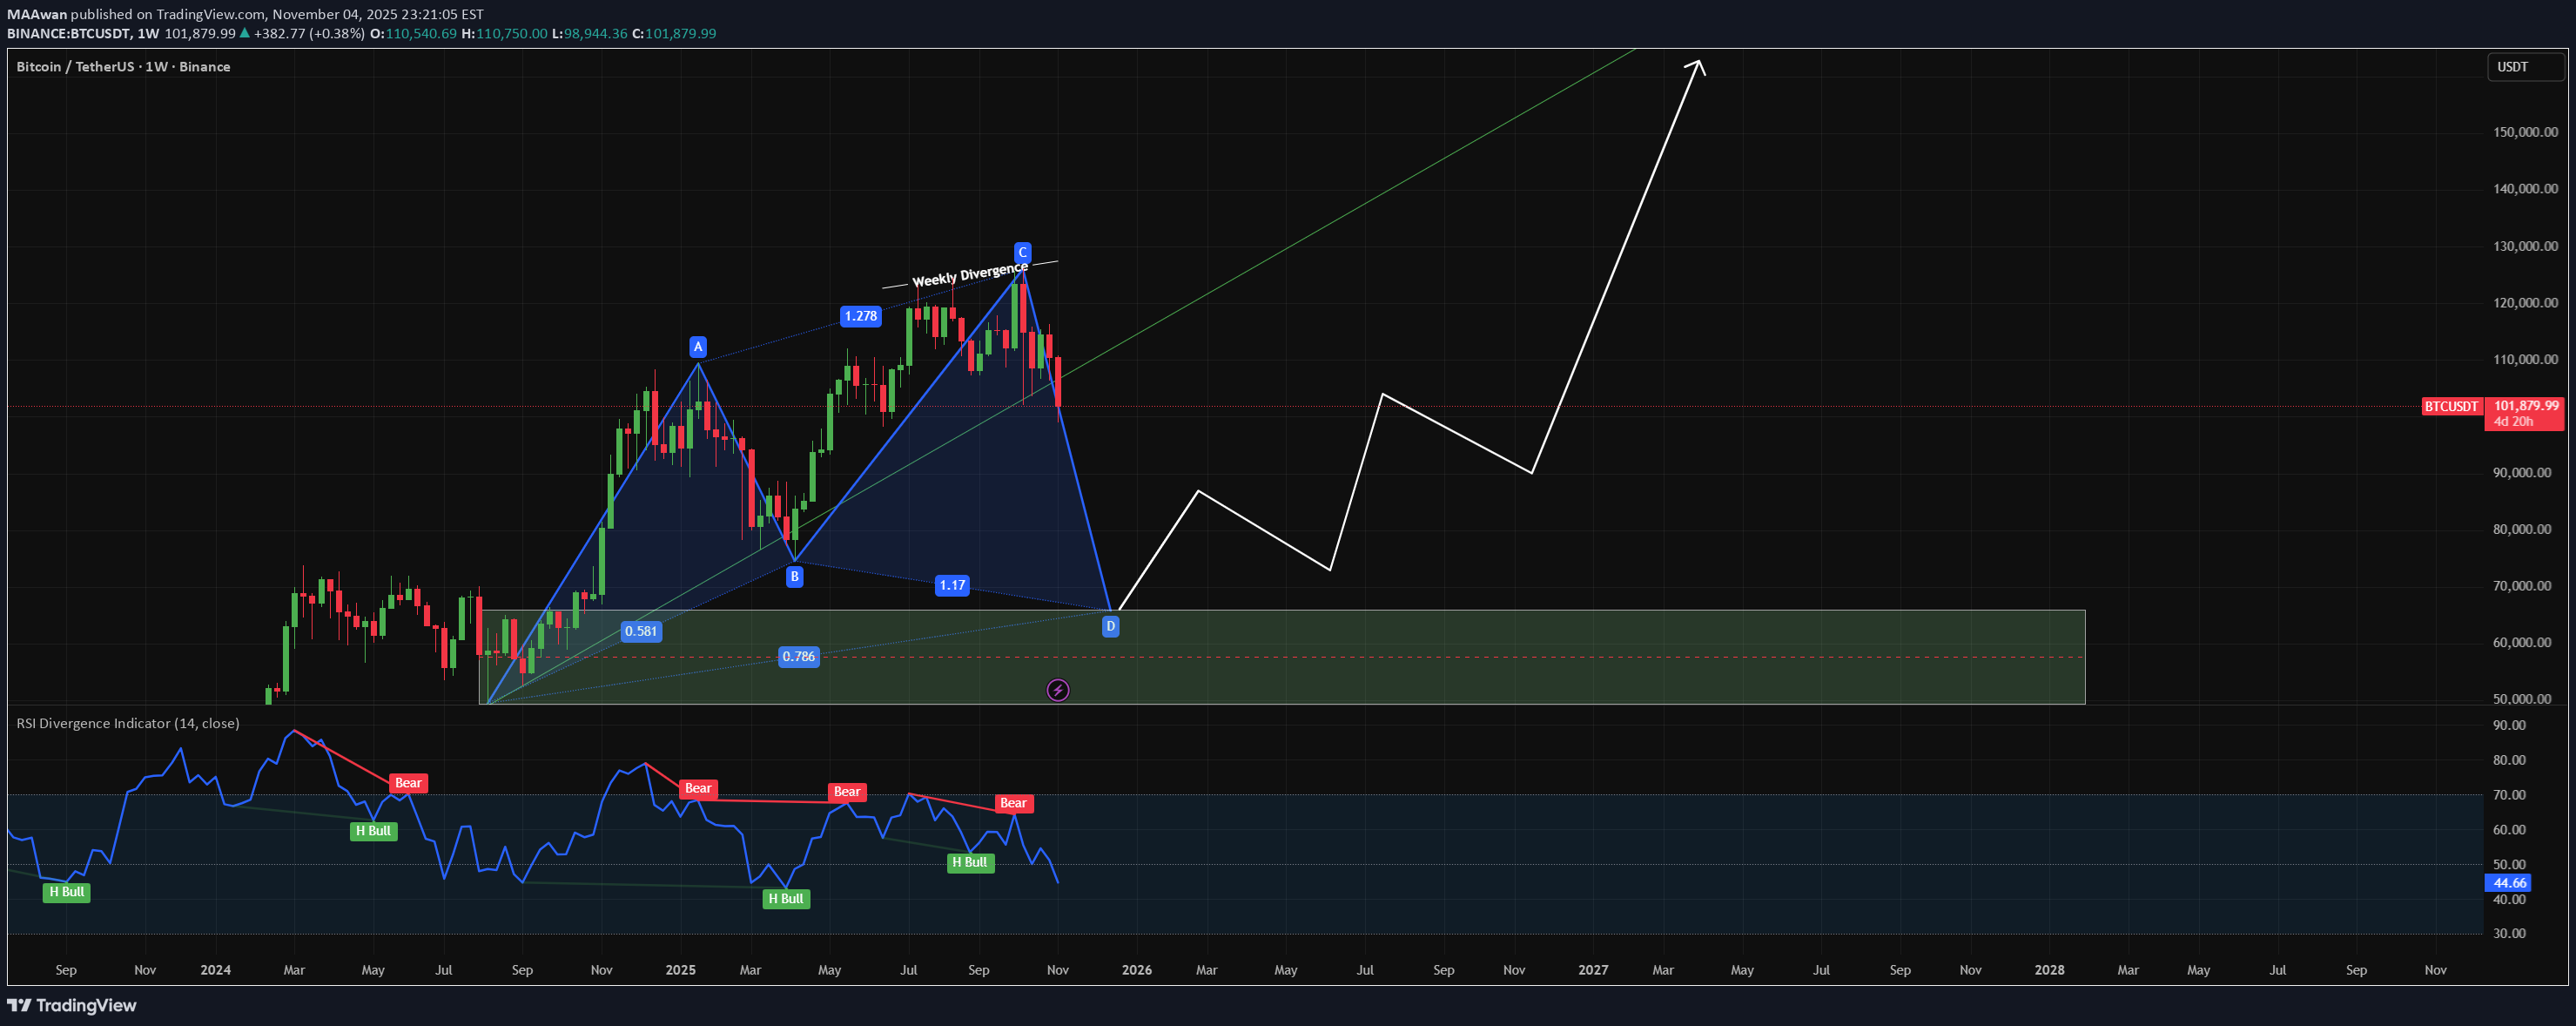
Bitcoin is currently forming a Cypher Harmonic Pattern on the weekly timeframe — a rare but reliable reversal setup that often appears near exhaustion phases of a macro move. This structure aligns with potential mid-cycle correction before continuation, providing a clear roadmap for both bulls and bears. Cypher Harmonic Structure The Cypher pattern follows strict Fibonacci ratios: XA leg: The initial impulsive wave defining trend direction. AB retracement: Retraces between 0.382–0.618 of XA (here ~0.58). BC extension: Expands to 1.13–1.414 of AB (here ~1.27). CD completion: Extends to 0.786 retracement of the XC leg — this defines the potential reversal zone (PRZ). In this setup: X → A → B → C structure is complete. Price is now heading toward point D, projected between $50,000–$65,000, the ideal PRZ for this Cypher. The highlighted green box marks this completion and potential accumulation zone. Technical Confluence Weekly RSI Divergence Bearish divergence appeared between point B and C — confirming a loss of upward momentum. RSI now approaching mid-levels (40–45), aligning with a healthy reset within a broader bull structure. Volume and Momentum Shift Declining bullish volume since the C-leg high, typical before harmonic completion. Short-term bearish bias persists until D-zone validation. Fibonacci and Structure Alignment The 0.786 retracement of XC overlaps with historical weekly demand. This overlap reinforces the D-zone as a strong potential reversal point. Scenario Planning Base Case (Cypher Completion): BTC retraces toward $55K–$60K (D-leg). Price stabilizes within PRZ and confirms structure with bullish divergence on RSI. Potential upside reaction back toward $90K+ over the next few quarters. Alternative Case (Invalidation): A weekly close below $50K would invalidate the Cypher completion and shift bias to extended correction territory. Trading Considerations Aggressive Entry: Scale into longs within the PRZ ($55K–$60K) once momentum indicators show exhaustion. Conservative Entry: Wait for bullish confirmation on higher timeframes (weekly close above prior swing low). Invalidation: Close below $50K zone. Risk management is crucial — the Cypher is high-probability but not infallible. Conclusion The Cypher Harmonic Pattern suggests BTC may be in the latter stages of a mid-cycle correction. If historical structure repeats, the D-point could serve as the macro reaccumulation zone before the next impulsive leg of the bull cycle. Bias: Short-Term Bearish → Mid-Term Bullish Pattern Type: Cypher Harmonic Key Zone: $50K – $65K Invalidation: Weekly Close < $50K
MAAwan
الگوی تاریخی بیت کوین: "۱ شمع قرمز، ۲ شمع صعودی" تکرار میشود!
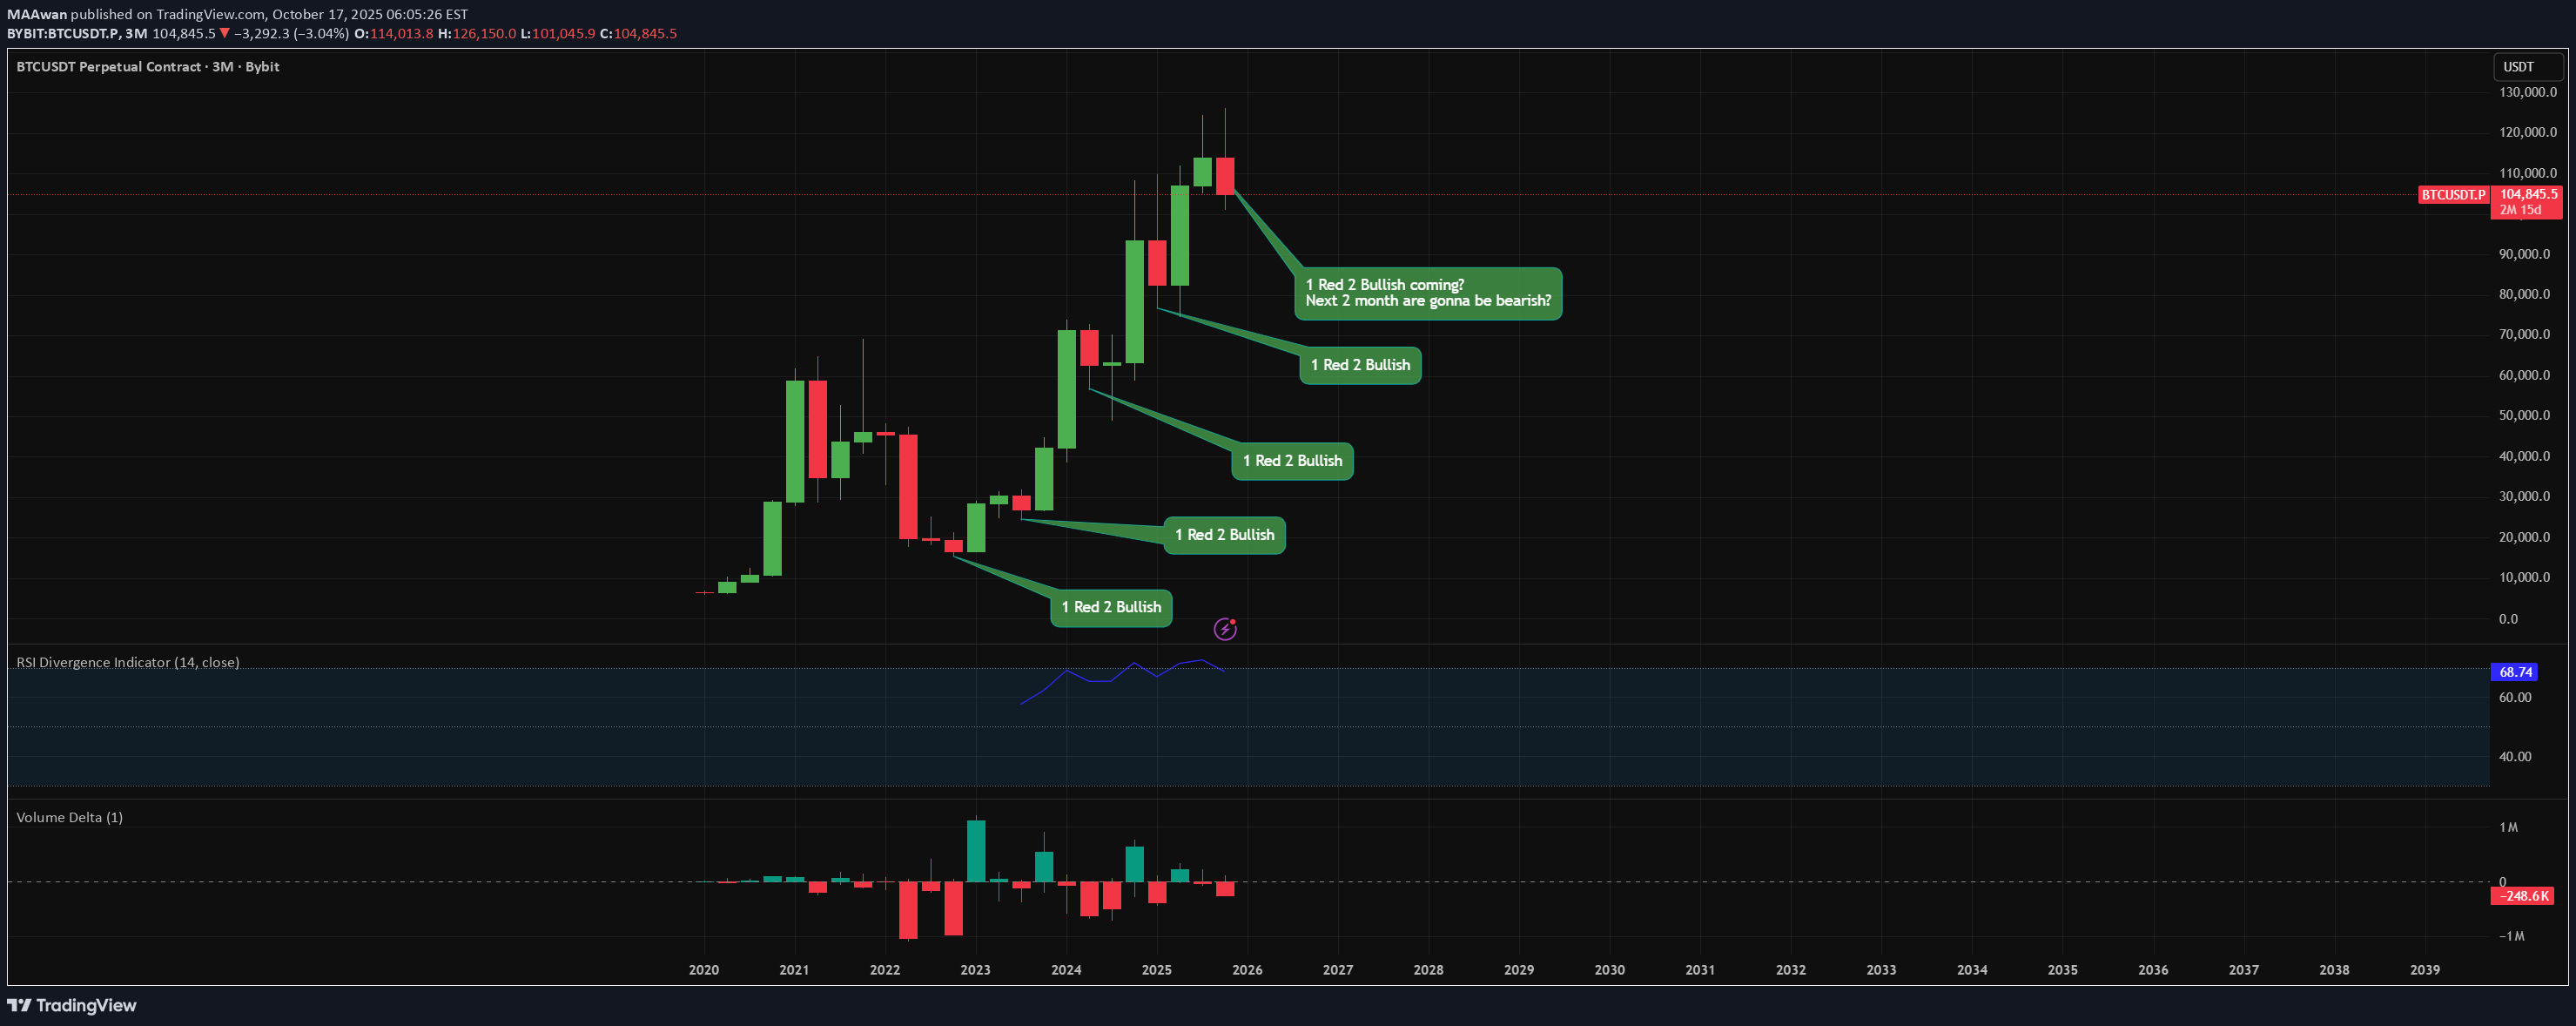
Macro Overview On the 3-month chart, Bitcoin continues to respect its long-term cyclical structure. A repeating pattern has emerged across prior macro expansions: after each single red (corrective) quarterly candle, BTC tends to print two consecutive strong bullish quarters, resuming the broader uptrend. This behavior has been consistent across the previous cycles — specifically around 2020, 2021, and 2023 — each time leading into a continuation of the bull phase. Pattern Structure Historical Context: Every major macro advance saw a single quarterly correction that reset overheated conditions, followed by renewed strength. Repetition Zone: We are once again witnessing one red quarterly candle after a series of strong bullish closes — historically a precursor to continuation. RSI Observation: The RSI on the 3M timeframe remains elevated but not divergent. The oscillator’s structure suggests momentum cooling within a bullish regime rather than a full trend reversal. Technical Implications The current red candle likely represents a mid-cycle correction, not a structural breakdown. Volume profile supports this narrative — a decrease in buying volume without aggressive distribution. If BTC maintains its higher lows on the 3M structure, the setup favors a continuation leg targeting new cycle highs into the next two to three quarters. Scenario Outlook Base Case (Bullish Continuation): 1 red quarterly candle completes the corrective phase. Two subsequent bullish candles emerge, aligning with the recurring “1 Red, 2 Bullish” pattern. Price expansion potential toward prior cycle extensions (FIB 1.618–2.0 range). Alternative Case (Bearish Extension): Failure to reclaim the prior quarterly open could extend the correction for one additional quarter before resumption. Structural invalidation only occurs with a quarterly close below the previous swing low. Macro Conclusion The current price behavior aligns with Bitcoin’s historical rhythm of expansion and reaccumulation. Unless the 3M candle closes decisively below key support, this setup favors macro consolidation before another impulsive leg higher. RSI structure, volume delta, and cyclical consistency collectively point toward bullish continuation over the next two quarters, following the completion of this corrective phase. Bias: Moderately Bullish (Macro Continuation Expected) Time Horizon: 6–12 Months Invalidation: Quarterly close below prior macro swing low
MAAwan
DOTUSDT – Daily Bullish Setup | Breakout Building
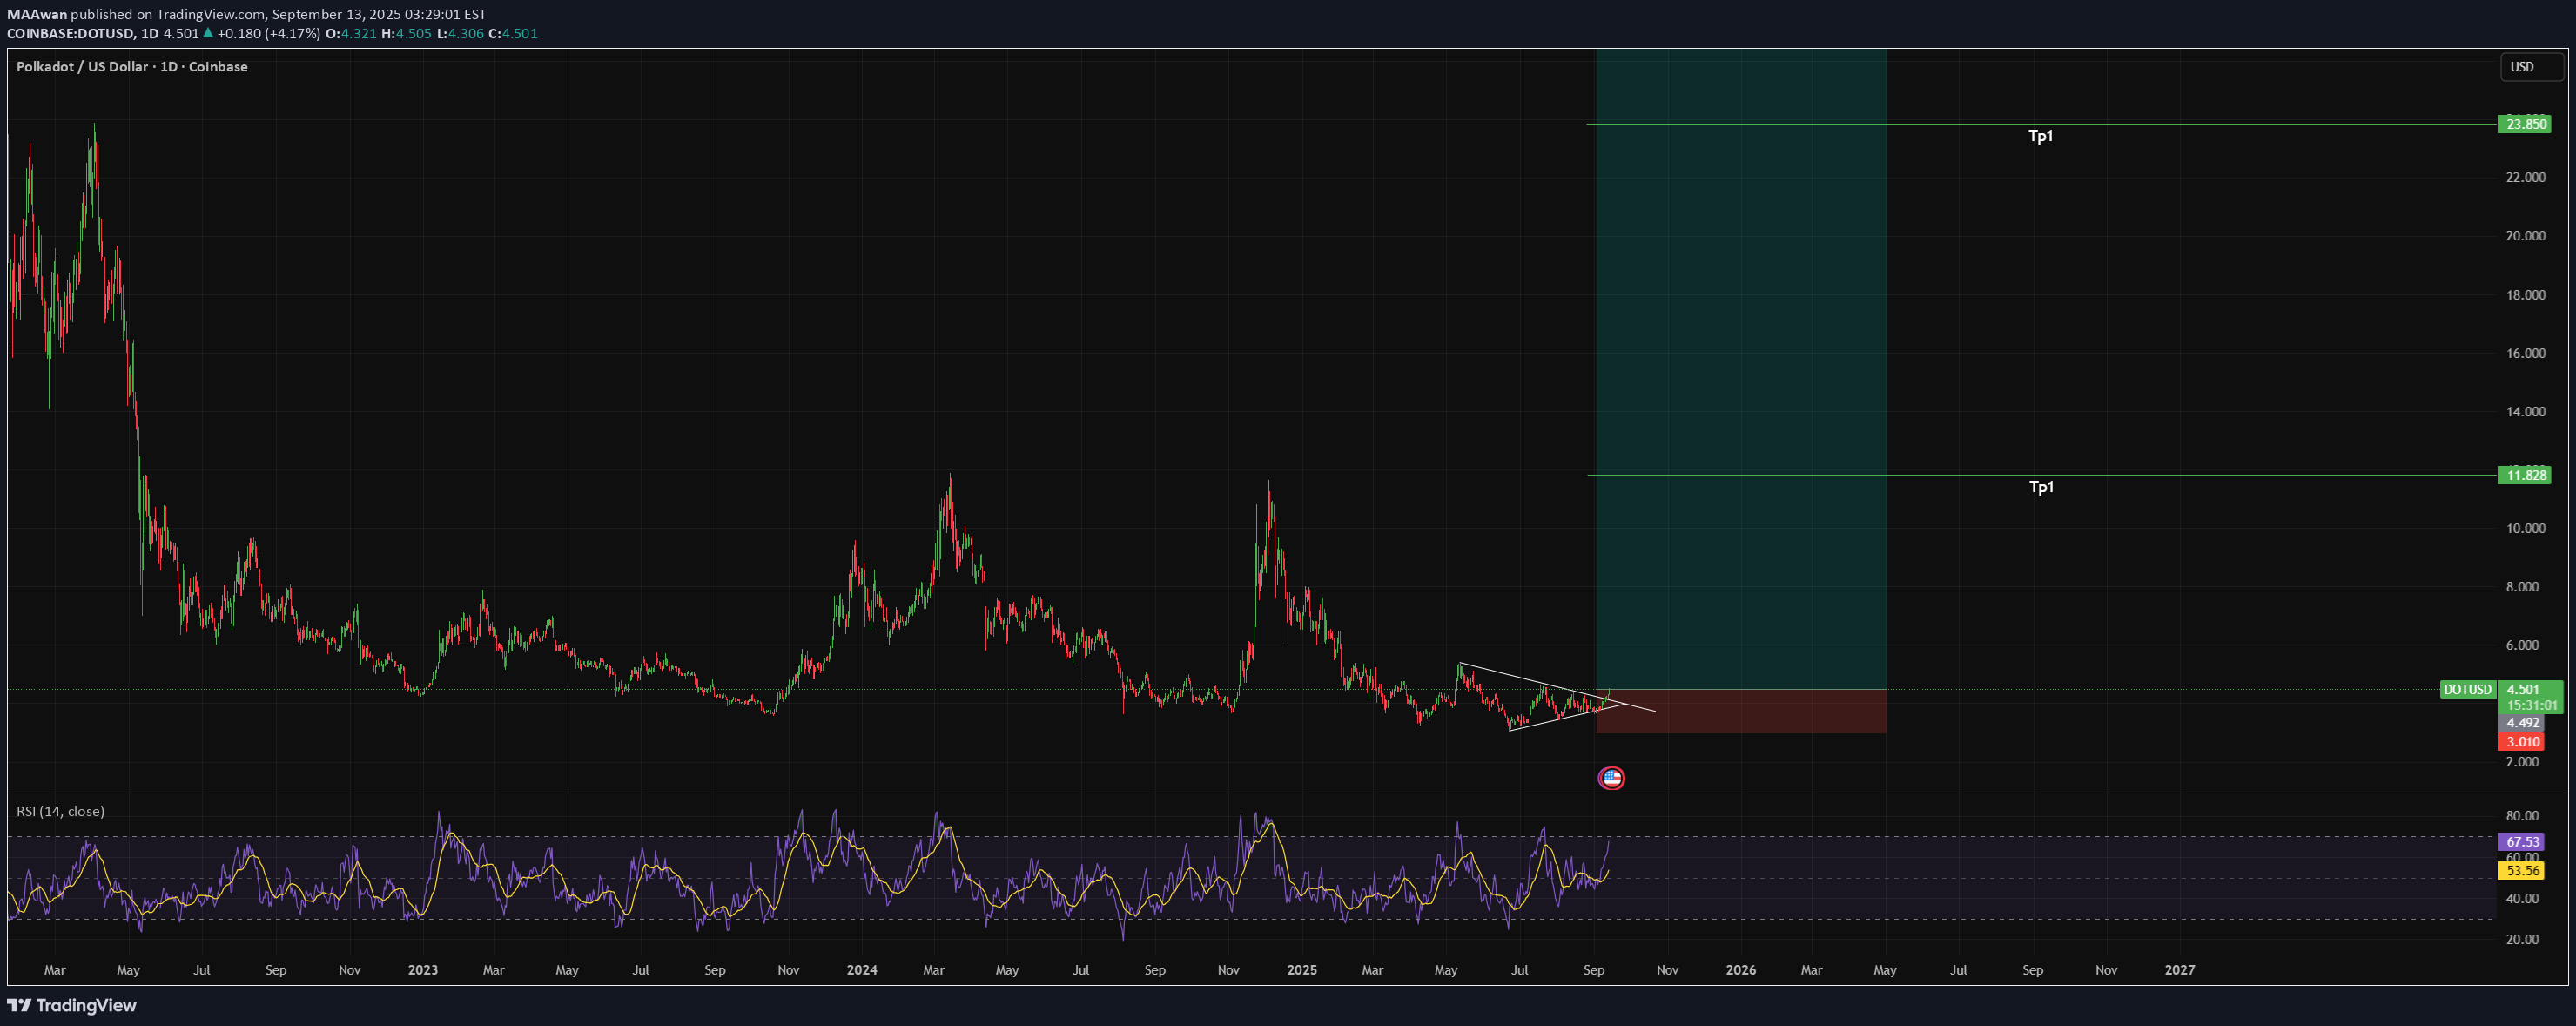
DOTUSDT – Daily Bullish Setup | Breakout Building for Major Upside 🚀📈 Hey traders 👋 Polkadot (DOTUSDT) has been in a prolonged downtrend and accumulation phase, but now things are heating up. Price is compressing into a tight wedge, and momentum indicators are pointing toward a potential bullish breakout. With a clearly defined invalidation level and huge upside potential, DOT is setting up for what could be a multi-leg rally if bulls step in. 📈 Technical Breakdown Structure: Price coiling inside a wedge → breakout nearing RSI: Trending higher, showing momentum building Risk/Reward: Clear invalidation below the wedge base, upside targets are multiples higher This is a classic breakout accumulation structure that often precedes big moves. 🎯 Trade Plan Idea Entry: Breakout confirmation above wedge resistance Stop-loss: Below wedge support (tight invalidation) Targets: TP1: 11.8 (first major resistance) TP2: 23.8 (macro swing resistance) TP3: 38+ (long-term potential if momentum sustains) The setup offers huge asymmetric risk/reward, ideal for swing traders looking to capture the bigger move. 📌 DOT is coiling for a breakout — will this be the start of its next bull leg? Are you scaling in early or waiting for breakout confirmation? Let’s discuss 👇 #DOTUSDT #Polkadot #Crypto #BullishSetup #Breakout #SwingTrade #TechnicalAnalysis #Altcoins
MAAwan
WUSDT – Weekly Bullish Divergence | Trendline Break Signals Poss
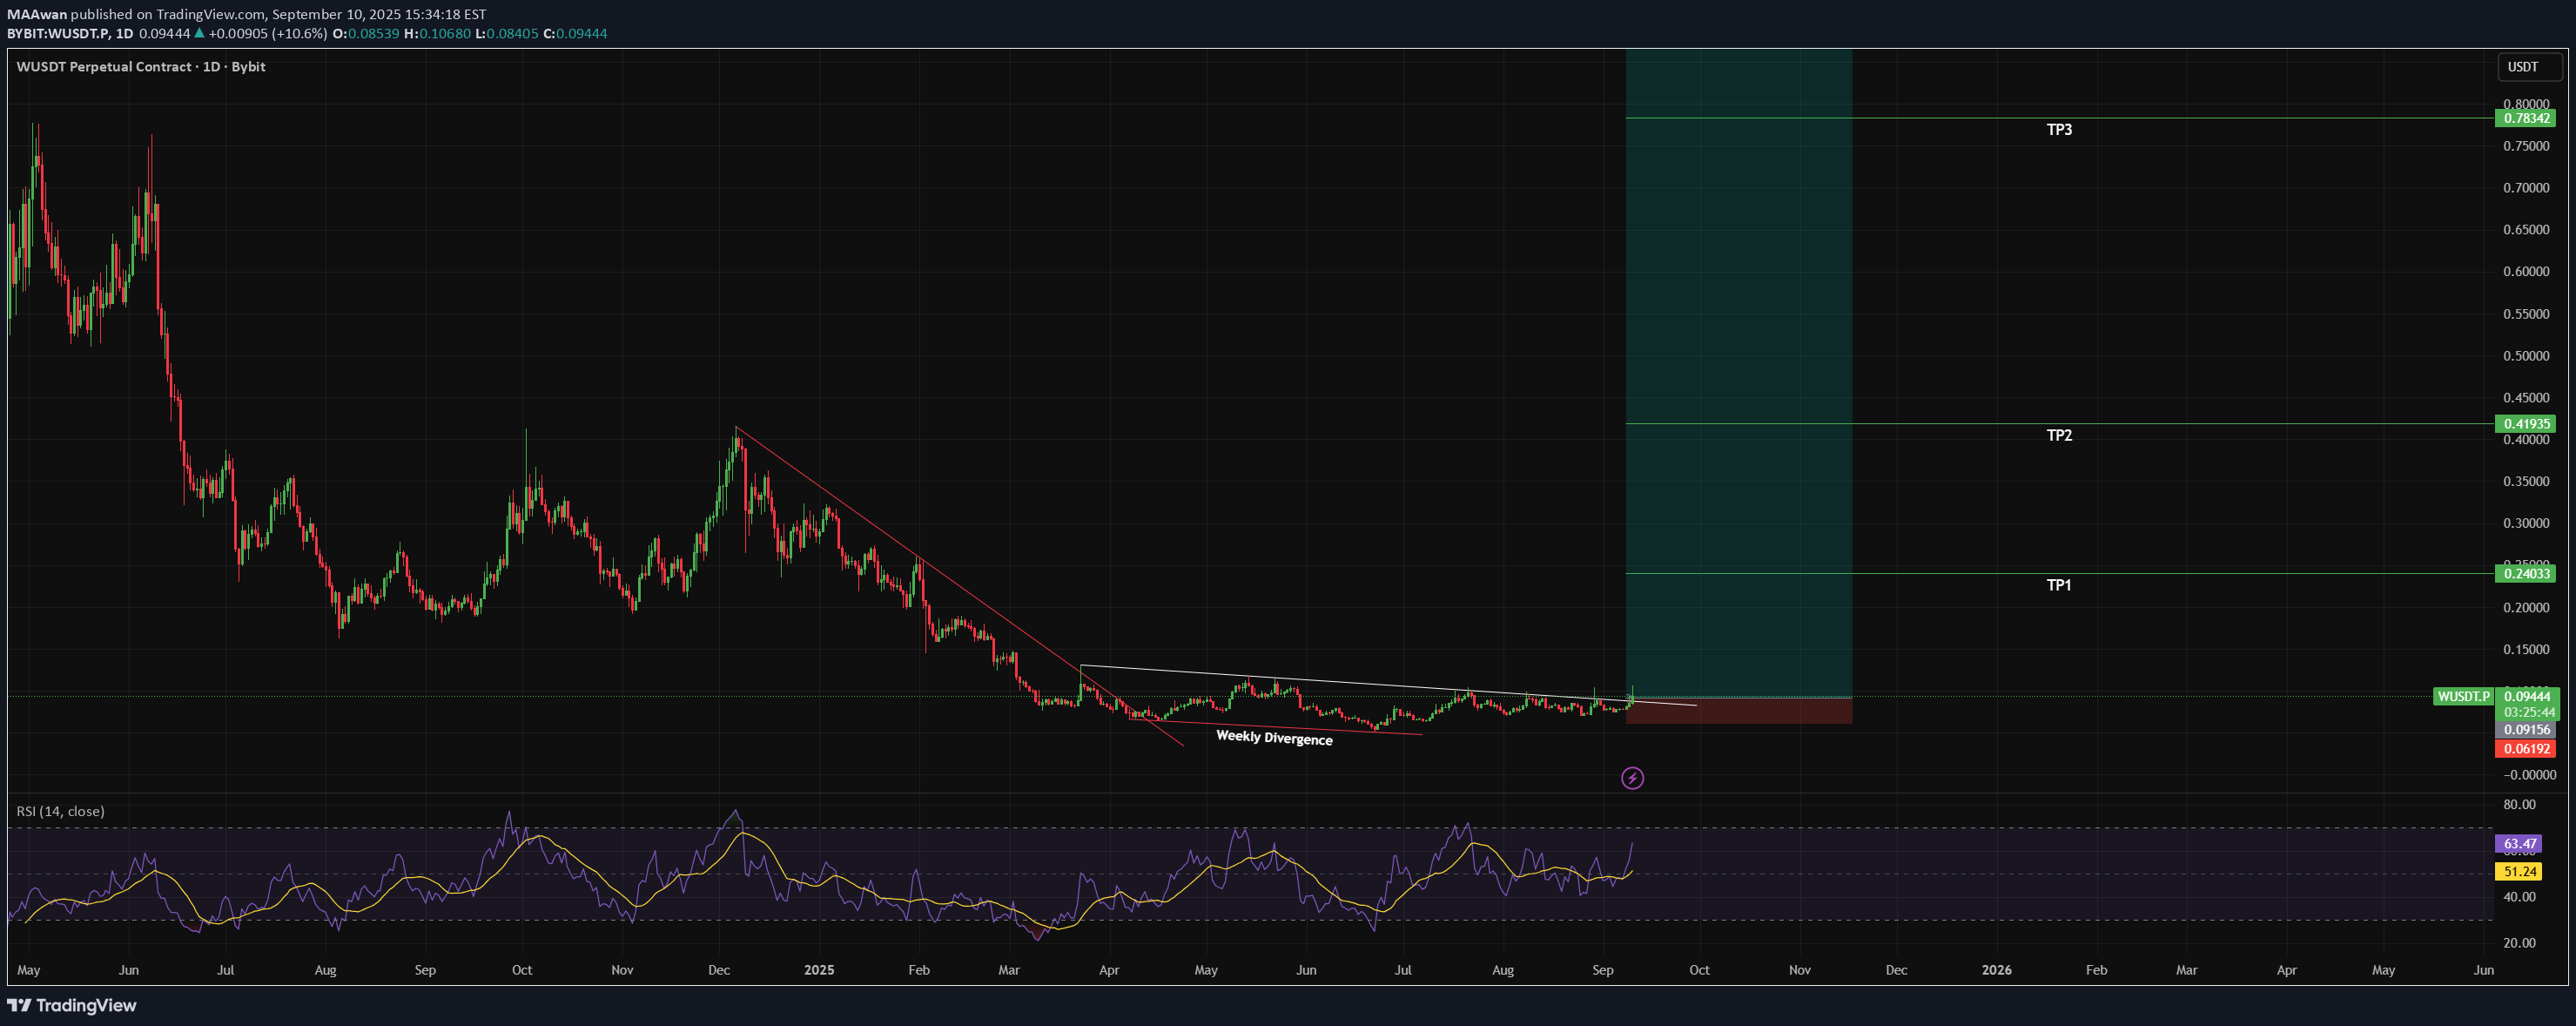
WUSDT – Weekly Bullish Divergence | Trendline Break Signals Possible Macro Reversal 🚀📈 Hey traders 👋 After a long stretch of bearish pressure, WUSDT is finally showing its first real signs of strength. On the weekly timeframe, we have a bullish divergence forming — a major clue that selling momentum is drying up and buyers are stepping back in. On top of that, price has just broken out of the descending trendline that kept it capped for months. This combo of divergence + breakout is exactly what marks the beginning of bigger trend shifts. 📈 Technical Breakdown Weekly Divergence: Price kept printing lower lows RSI made higher lows → classic bullish divergence Trendline Break: Price finally broke through the descending resistance line Volume Picking Up: Subtle but noticeable, backing the breakout This isn’t a scalper’s setup — it’s macro-level price action. 🎯 Trade Plan Idea Entry Zone: Around the breakout + retest level Stop-loss: Just under the breakout base Targets: TP1: 0.24 (first major resistance) TP2: 0.41 (swing resistance zone) TP3: 0.78+ (macro target if momentum continues) The R:R is massive here — a proper swing idea worth tracking over weeks/months. 📌 WUSDT Showing Weekly Bullish Divergence + Trendline Break – The Bottom May Be In Would you scale in on dips, or wait for retest confirmation? Drop your strategy 👇 #WUSDT #BullishDivergence #Crypto #SwingTrade #TrendlineBreak #Altcoins #ReversalSetup #TechnicalAnalysis
MAAwan
WUSDT – Daily Bullish Divergence

WUSDT – Daily Bullish Divergence | Early Reversal Signals In Play 🔄📈 What’s up traders 👋 WUSDT is starting to show some life after a consistent downtrend — and the first real sign of a shift is now visible: ✅ Bullish divergence on the daily chart This isn’t some noise on a 15-minute scalp — this is daily timeframe divergence, and that’s often the first clue that momentum is quietly turning. 🔍 Bullish Divergence Breakdown Price: Making lower lows, continuing the downtrend RSI (or MACD): Making higher lows, indicating loss of bearish momentum This is the textbook setup where sellers are still pushing price down — but buyers are starting to step in beneath the surface. That’s usually followed by: A range A breakout And often, a sharp bounce ⚡ What to Watch Next Support zone: Is price bouncing off a previous base? Volume: Any spike or subtle increase? Candle strength: Bullish engulfing or long-wick rejections? If any of those line up with the divergence — we’ve got a high-probability bounce/reversal scenario in motion. 🎯 Trade Strategy Idea Aggressive Entry: Off the divergence zone + candle confirmation Conservative Entry: Wait for a break above recent swing high Stop Loss: Just below the recent low Targets: Previous resistance levels or fib retracement zones (38.2% / 61.8%) 📌 WUSDT Showing Daily Bullish Divergence – Is Momentum About to Flip? Time to position early or wait for confirmation? Drop your thoughts & setups 👇 #WUSDT #BullishDivergence #DailyChart #CryptoTrading #Altcoins #ReversalSetup #SmartMoney #TechnicalAnalysis #MomentumShift
MAAwan
PYTHUSDT Bullish

PYTHUSDT – Daily Bullish Divergence + Trendline Break | Structure Shift In Play 🔄🚀 What’s up traders 👋 PYTH is showing major signs of reversal on the daily chart — and this isn’t just a one-signal wonder. We’ve got a bullish divergence plus a clean trendline break, which together make a strong case that the downtrend is done (or very close to it). 📈 Bullish Divergence – Momentum Is Turning Price has been making lower lows RSI is making higher lows That’s classic bullish divergence — meaning sellers are still pushing the price down, but the momentum behind the move is fading fast. This is the kind of setup that often precedes a reversal — especially on a higher timeframe like the daily. 📉 Daily Trendline Break – Structural Confirmation While divergence gives us a heads-up, the daily trendline break is confirmation. That descending resistance has been holding price down for a while — but not anymore. We’ve got: A strong breakout candle Volume rising with the break Price holding above the broken trendline — flipping resistance into support That’s exactly what you want to see when momentum shifts. 🎯 What Comes Next? Watch for a retest of the broken trendline — that would be an ideal entry zone Look for bullish candles forming above support Targets can be layered around prior structure levels — let price guide the path upward 🔥 Final Take This isn’t a meme or hype setup — it’s a technical structure shift backed by momentum divergence. When these two line up on the daily, smart money usually pays attention. 💬 In or waiting on a retest? What’s your PYTH game plan? Drop your chart or comment below — let’s talk setups! #PYTH #PYTHUSDT #BullishDivergence #TrendlineBreak #CryptoSetup #PriceAction #Altcoins #TechnicalAnalysis #SmartMoney #SwingTrade
MAAwan
GLMRUSDT Bullish

GLMRUSDT – Bullish Cypher Pattern Forming | Reversal Setup 🔄🚀 Hey pattern traders 👋 GLMR (Moonbeam) is forming what looks like a textbook bullish Cypher pattern — and if this completes properly, we could be looking at a solid reversal play off key Fibonacci levels. This is the kind of setup where precision and patience pay off. 🔺 Cypher Pattern Breakdown Let’s decode it real quick: XA: The initial impulse leg AB: Retraces 38.2–61.8% of XA BC: Extends to 113–141.4% of AB CD: Completes near 78.6% retracement of the entire XA move If we’re completing the D-leg now, that’s where the buy zone comes in — right near the golden pocket of the move. This isn’t just a harmonic — this is a measured, rule-based entry with a solid R:R structure baked in. 📈 Why This Matters Cypher patterns are rare but powerful, offering reversal potential at points of max pain Structure aligns with oversold RSI, and MACD is showing a flattening histogram — momentum might be shifting If D completes near support, you’re looking at low-risk entries with explosive upside 🎯 Trading Plan (Example) Entry: Near the Cypher completion zone (around 78.6% of XA) Target 1: 38.2% retracement of CD leg Target 2: 61.8% retracement of CD leg Stop Loss: Below X-leg (invalidate the pattern) This is not a hype trade — this is where pros take shots while everyone else panics at the bottom. 📌 GLMR Forming a Bullish Cypher – Reversal Could Be Near Are you watching this pattern too? Let’s talk strategy — aggressive entry or waiting for confirmation? #GLMRUSDT #CypherPattern #BullishSetup #CryptoTrading #HarmonicPatterns #PriceAction #AltcoinSetup #ReversalTrade #TechnicalAnalysis
MAAwan
ARB/USDT – Bullish Setup

ARB/USDT – Daily Trendline Break | Target: 2.40 🚀🔥 What’s up traders 👋 ARB (Arbitrum) is finally showing signs of life. After being suppressed under a long-term descending trendline, we’ve got a confirmed breakout on the daily chart — and that’s the signal we’ve been waiting for. 📉 Downtrend Broken – Momentum Shift in Motion For weeks, ARB’s been stuck in a slow grind down — lower highs, lower lows, rinse and repeat. But that structure is now broken. Price has closed above the daily trendline Volume is starting to tick up Candles are printing strong bodies, not just wicks — that’s a shift in sentiment This isn’t just a bounce — it’s a potential reversal. 🎯 Trade Setup Entry: At or around current levels (post-breakout) Target: $2.40 — a major resistance zone and previous range top Stop Loss: $0.23 — deep, but protects against daily shakeouts and confirms invalidation if hit Yes, the stop is far — but that’s the price of playing a high-timeframe trend reversal. This is a position trade, not a scalp. 📌 Why It Matters Daily trendline breaks don’t come often — and when they do, they usually mean business Arbitrum is a major Layer 2 project — when the market turns, L2s tend to run hard A reclaim of structure combined with bullish sentiment could fuel a strong move 💬 Are You Riding This Wave or Waiting on Retests? Let’s talk setups — and if you’re in this trade, how are you managing risk? #ARBUSDT #Arbitrum #Altcoins #CryptoTrading #DailyBreakout #TrendlineBreak #SwingTrade #PriceAction #BullishSetup
Disclaimer
Any content and materials included in Sahmeto's website and official communication channels are a compilation of personal opinions and analyses and are not binding. They do not constitute any recommendation for buying, selling, entering or exiting the stock market and cryptocurrency market. Also, all news and analyses included in the website and channels are merely republished information from official and unofficial domestic and foreign sources, and it is obvious that users of the said content are responsible for following up and ensuring the authenticity and accuracy of the materials. Therefore, while disclaiming responsibility, it is declared that the responsibility for any decision-making, action, and potential profit and loss in the capital market and cryptocurrency market lies with the trader.