
LupaCapital
@t_LupaCapital

What symbols does the trader recommend buying?
Purchase History
پیام های تریدر
Filter
LupaCapital
پیشبینی طلا (XAU/USD): ریزش اصلاحی در راه است؟ تحلیل موجی و سطوح کلیدی
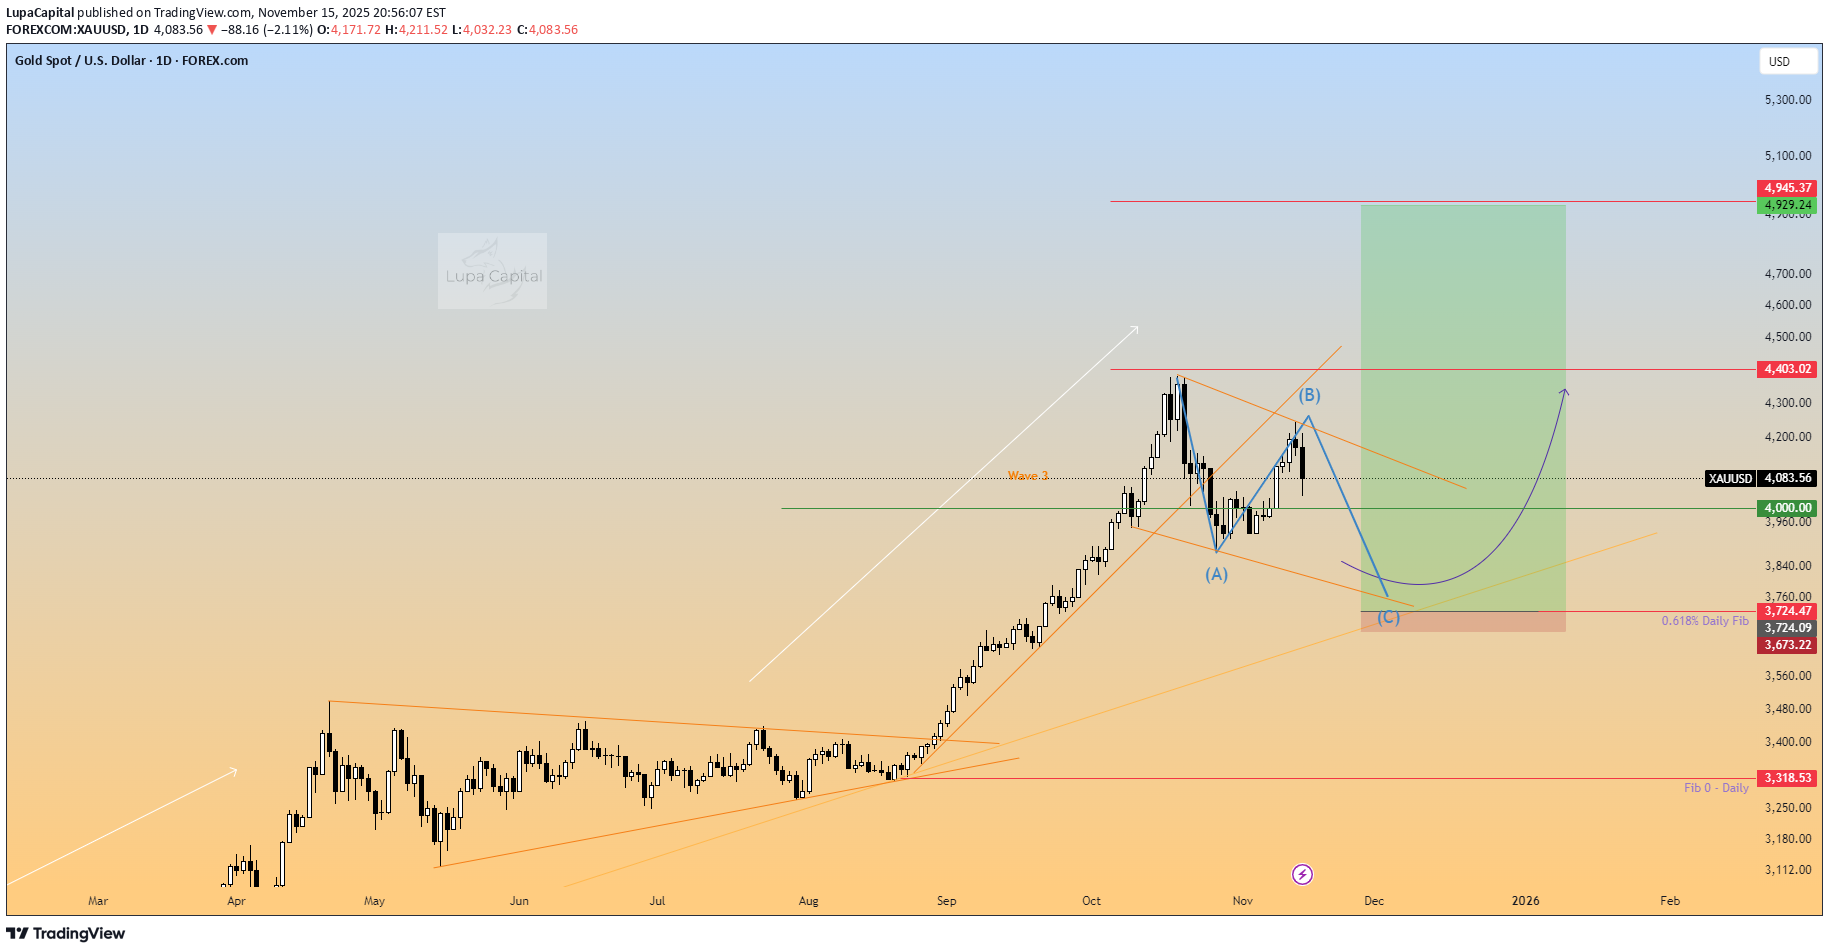
I'm referring to the Daily price chart and key counts are in line with Wave counting and supply and demand curve trading levels based on fair value gap intervals of weekly trading sessions plotted to a daily chart at intervals of 60. Current wave - 3 of 5 in the Elliott wave count. Experiencing ABC corrective structure. Corrective structure B has formed now nicely at $4,232. XX and rejected nicely, with a newly supply formed - based on A point of structure holding at at $4,372 - $4,217 zone within the inside candle. Price has nicely breached the wick and sold off accordingly. Now what happens? two things - 1. Price will fall to $4000.00 and use this psychological zone and the previous order block to create and nice order block and move up - retaining the Demand control. 2. This looks to be a setup of a technical alignment of a drop, base, drop where price channel or corrective wave from Point B - to point C is forming. The gap between on the daily structure left shows between $3,850 - 3,720 est is the real zone of interest where the Demand driver will derive from. Master Key for zones Black = Three Month Blue = Monthly Purple = weekly Pink = Consolidative box example (Daily) Orange = Daily White = Wave Red = Lines - Fibonacci, wave alignment. Risk Warning Trading leveraged products such as Forex, commodities and CFDs, carries with it a high level of risk and so may not be suitable for every investor. Prior to trading the foreign exchange, commodity or CFD market, consider your investment objectives, level of experience and risk appetite. You should never risk more than you can afford to lose. If you fail to understand or are uncertain of the risks involved, please seek independent advice and remember to conduct due diligence as criteria varies to suit the individual. Below are some of the take aways from the video - please listen again incase any detail is missed. Do you enjoy the setups? Professional analyst with 8+ years experience in the capital markets Focus on technical output not fundamentals Focus on investing for long term positional moves Provide updates where necessary - with new updated ideas tracking the progress. If you like the idea, please leave a like or comment. To all the followers, thank you for your continued support. Thanks, LVPA MMXXIV
LupaCapital
پیشبینی طلای جهانی (XAUUSD): آیا موج اصلاحی ABC در راه است؟
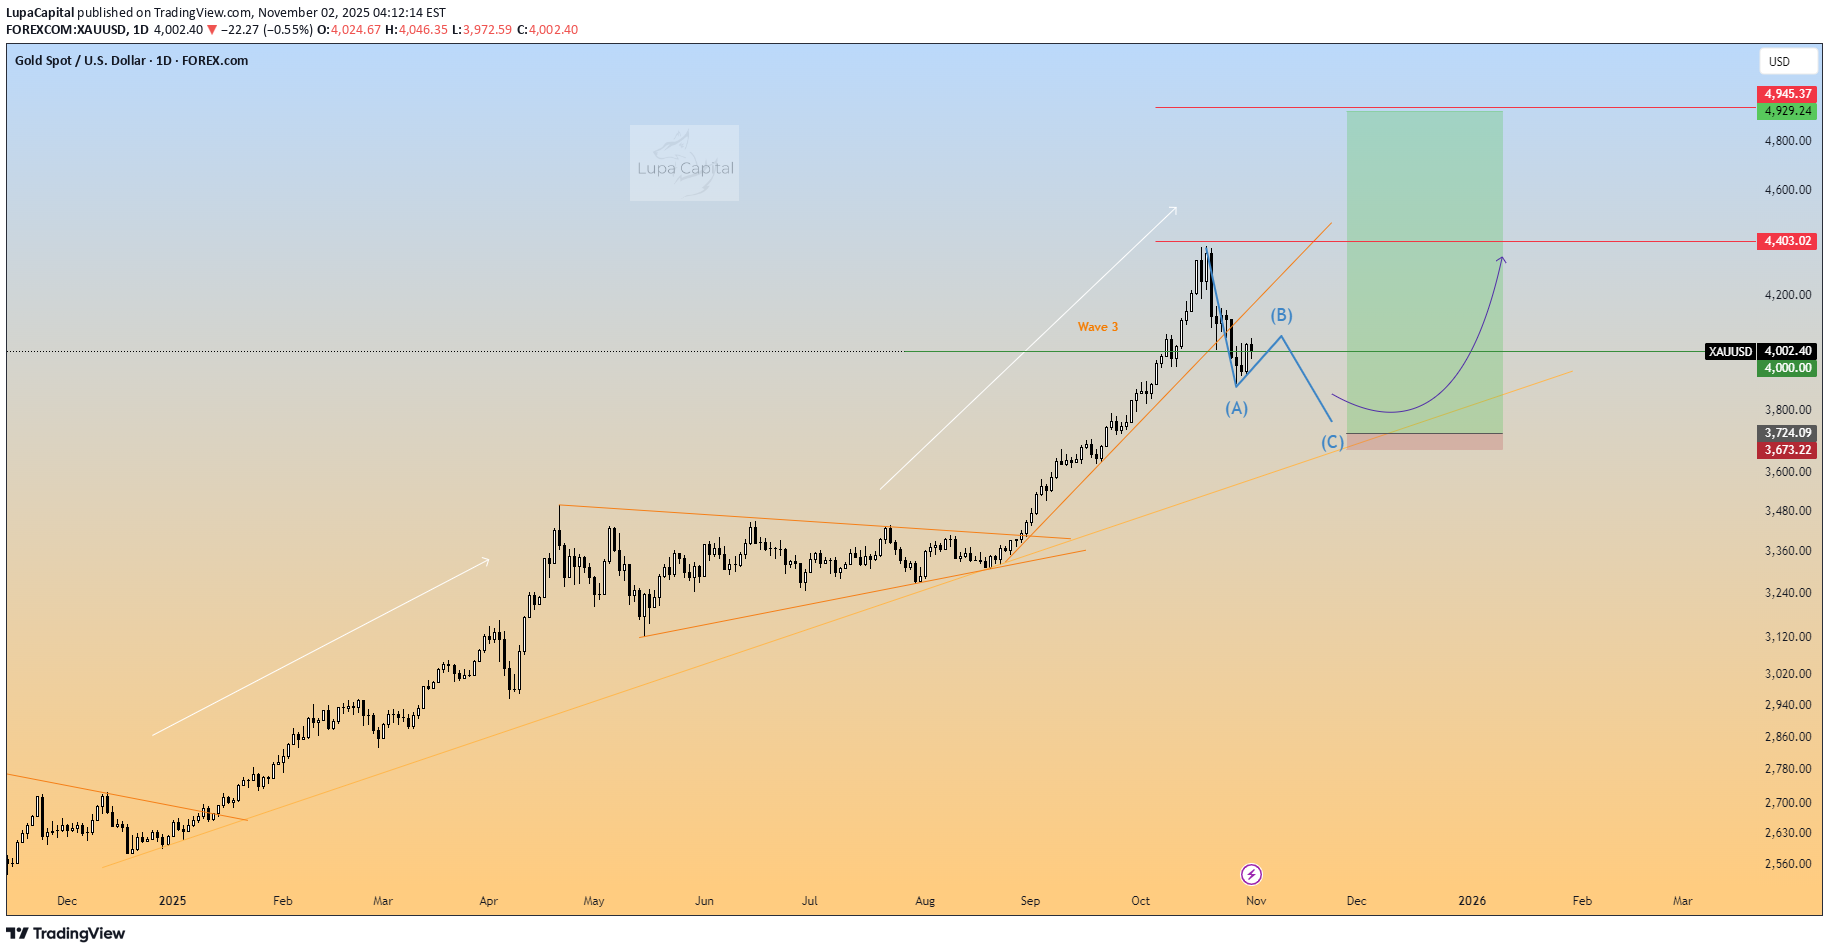
Updte to previous post. Still long, awaiting the corrective structure to occur - firstly to break and hold under $4000 (key level). Downward channel - to $3800 which is another area of interest - reason being, it holds high volume at a structure point under $3800. So, we sit tight and await the corrective pattern to emerge and complete. Daily chart image shows my thought pattern and an opportunity I am waiting for price to revert to. I'm referring to the Daily price chart and key counts are in line with Wave counting and supply and demand curve trading levels based on fair value gap intervals of weekly trading sessions plotted to a daily chart at intervals of 60. Current wave - 3 of 5 in the Elliott wave count. Experiencing ABC corrective structure. Master Key for zones Red = Three Month Blue = Monthly Purple = weekly Pink = Consolidative box example (Daily) Orange = Daily Risk Warning Trading leveraged products such as Forex, commodities and CFDs, carries with it a high level of risk and so may not be suitable for every investor. Prior to trading the foreign exchange, commodity or CFD market, consider your investment objectives, level of experience and risk appetite. You should never risk more than you can afford to lose. If you fail to understand or are uncertain of the risks involved, please seek independent advice and remember to conduct due diligence as criteria varies to suit the individual. Below are some of the take aways from the video - please listen again incase any detail is missed. Do you enjoy the setups? Professional analyst with 8+ years experience in the capital markets Focus on technical output not fundamentals Focus on investing for long term positional moves Provide updates where necessary - with new updated ideas tracking the progress. If you like the idea, please leave a like or comment. To all the followers, thank you for your continued support. Thanks, LVPA MMXXIV
LupaCapital
پیشبینی انفجاری طلا در سال 2025: آیا 4000 دلار در انتظار است؟
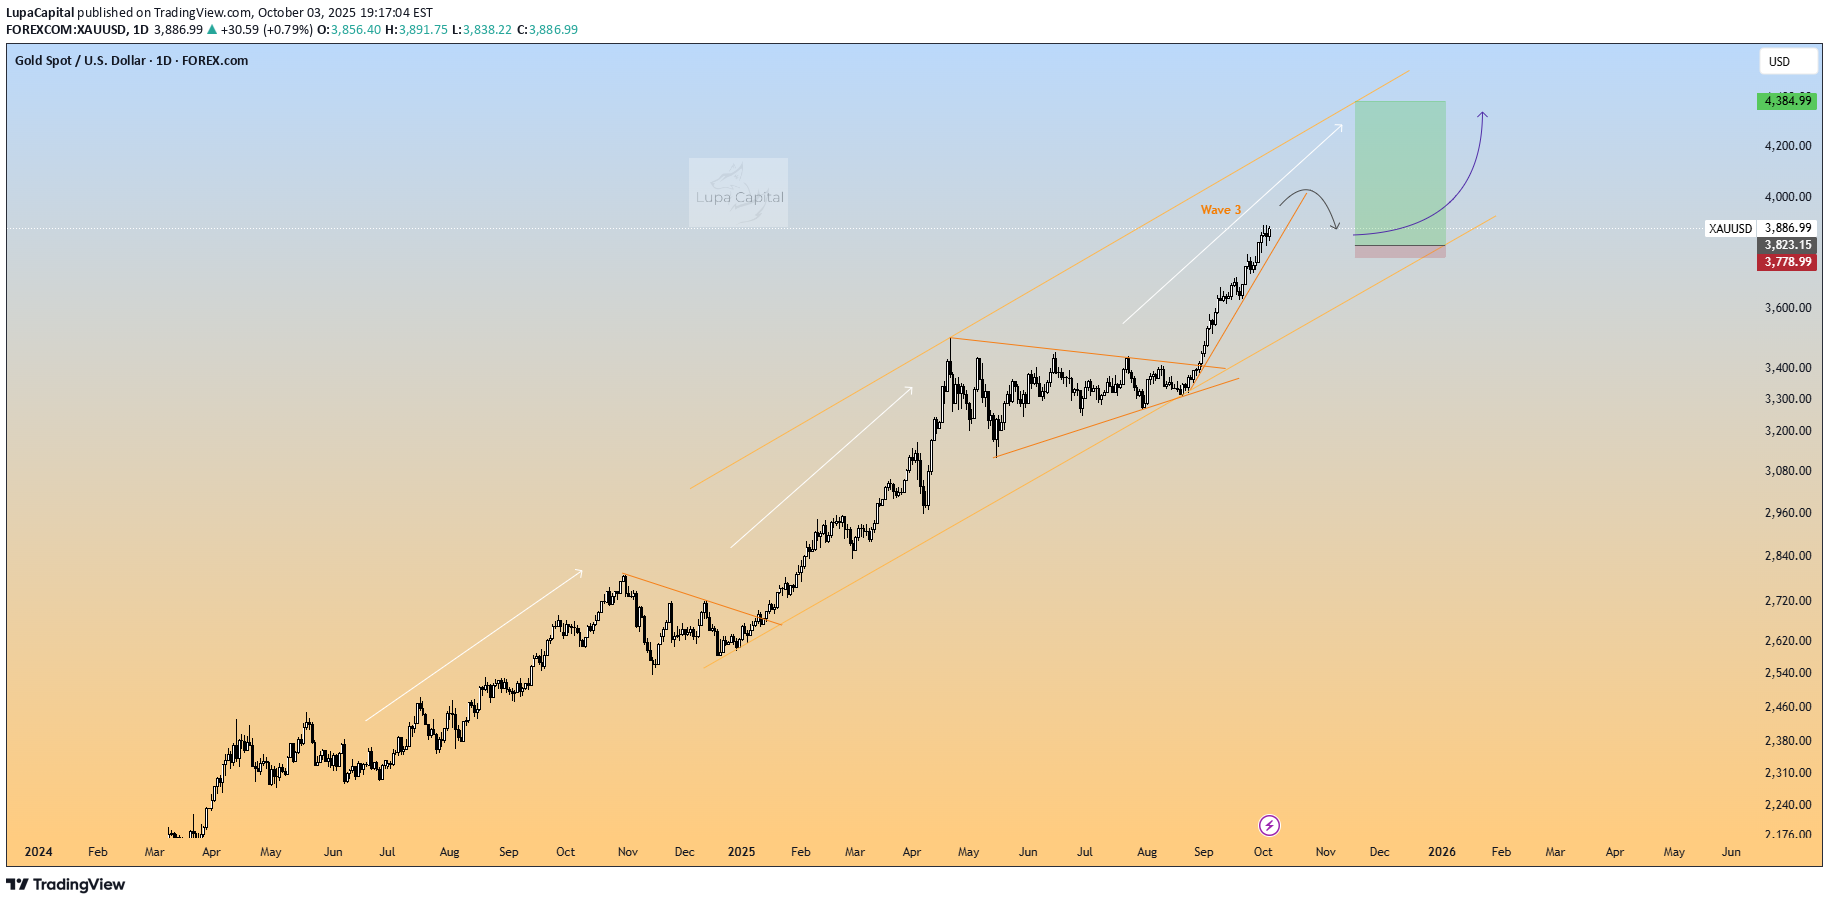
Hello, it's been a while. I've been on working building my pile in XAG, XAU reserves. Now i am back, Gold is still giving a phenomenal return on printing up and right (meaning growth). I don't know where price structure will end, however it's a highly probable chance we will hit $4,000USD per oz, and continue to raise. Daily chart image shows my thought pattern and an opportunity I am waiting for price to revert to. I'm referring to the Daily price chart and key counts are in line with Wave counting and supply and demand curve trading levels based on fair value gap intervals of weekly trading sessions plotted to a daily chart at intervals of 60. Current wave - 3 of 5 in the Elliott wave count. Master Key for zones Red = Three Month Blue = Monthly Purple = weekly Pink = Consolidative box example (Daily) Orange = Daily Risk Warning Trading leveraged products such as Forex, commodities and CFDs, carries with it a high level of risk and so may not be suitable for every investor. Prior to trading the foreign exchange, commodity or CFD market, consider your investment objectives, level of experience and risk appetite. You should never risk more than you can afford to lose. If you fail to understand or are uncertain of the risks involved, please seek independent advice and remember to conduct due diligence as criteria varies to suit the individual. Below are some of the take aways from the video - please listen again incase any detail is missed. Do you enjoy the setups? Professional analyst with 8+ years experience in the capital markets Focus on technical output not fundamentals Focus on investing for long term positional moves Provide updates where necessary - with new updated ideas tracking the progress. If you like the idea, please leave a like or comment. To all the followers, thank you for your continued support. Thanks, LVPA MMXXIVXAU USDtarget reached - new analysis
LupaCapital
BTC USD - Technical regression & Imbalances

G'day, This is the first video analysis upload, so the length is something I would like to scale down being more concise in future, however in order to appeal to the broader market, Technicals need to be simplified. A note before reading - this is a forecast analysis - based upon a long term trading strategy looking for Fresh Demand/Supply zones.This is tagged Neutral to the overall monthly demand in control, until the opportunity of a rejection of the PCP has occurred or a long opportunity from a break and retest of the trend. Overall, where an imbalance is formed and sellers have completed the changing of hands due to purchasing further increments the exhaustive sellers. Until this criteria is met - no trade is taken until reactive, break or curve is confirmed. Long term investment strategy will be looking for buys as part of the next cycle. This is an investment and not a quick move based on lower time frames.Master Key for zonesRed = Three MonthBlue = MonthlyPurple = weeklyPink = Three, Four DayOrange = DailyRisk WarningTrading leveraged products such as Forex, commodities and CFDs, carries with it a high level of risk and so may not be suitable for every investor. Prior to trading the foreign exchange, commodity or CFD market, consider your investment objectives, level of experience and risk appetite. You should never risk more than you can afford to lose. If you fail to understand or are uncertain of the risks involved, please seek independent advice and remember to conduct due diligence.Daily Potential Move - Short term Bullish break and reload of PCP zone formingWeeklyLong term Bearish probability potential outcome to equate to lows of 2022.Bullish WeeklyWhere price eliminates with CP levels confirming market structure.Weekly regression analysisBearish curve and bullish pathway.Awaiting the next move for either.Let me know your thoughts and analysis. Each opinion is valid where research is conducted. Do you enjoy the setups?Professional analyst with 5+ years experience in the capital marketsFocus on technical output not fundamentalsFocus on investing for long term positional movesProvide updates where necessary - with new updated ideas tracking the progress.If you like the idea, please leave a like or comment.To all the followers, thank you for your continued support.Thanks,LVPA MMXXIII
LupaCapital
Dash USD - Buy and hold for 2022

Hello Traders and Analysts,Welcome to 2022. This year, less posting, but more closer measurement analysing a smaller group of pairs.This refines analysis and provides clearer insights, while the principles of investment are still covered in detail.Breakdown:1. Note2. Contents3. Research breakdown4. Education recap5. Information on Lupa.A Note before reading - this is a forecast analysis - based upon our trading strategy. This is tagged long, due to purchasing further increments upon imbalances.Please do not take this as face value and conduct the relevant investment strategy to successfully trade the probabilities.Note* this analysis is a positional accumulation using a cost average upon positional aggregation. Short term losses incurred will not be realised, instead buying opportunities will be added. For CFD purposes, positions can be added with wider stop losses but minimal risk lost. Risk WarningTrading leveraged products such as Forex, commodities and CFDs, carries with it a high level of risk and so may not be suitable for every investor. Prior to trading the foreign exchange, commodity or CFD market, consider your investment objectives, level of experience and risk appetite. You should never risk more than you can afford to lose. If you fail to understand or are uncertain of the risks involved, please seek independent advice and remember to conduct due diligence.Master Key for zonesRed = Three MonthBlue = MonthlyPurple = weeklyScarlet [Red] - Four dayOrange = DailyGreen = 8 HourGrey = 4hourPink = 1 hourMonthly Imbalance for buyingThe main criteria for longs Strong wicks showing that the zone has failed to close within the imbalance. Net close out of the imbalance using August 20 - this coincides with the new monthly wicks proceeding creating higher highs. We have an inside bar which essentially on the monthly provides a bear trap - look down below for the weekly to see the change of hands closer. Looking left, the monthly candlesticks have created moves to establish supply imbalances. Adding supply imbalance as targetsStructure understandingUsing the Fibonacci from price formations - this has established zone for profit targets and change of hands zones which is a logical positional play in technical analysis. Things which are critical to understand here The swing low of the Fibonacci starts at "1", whereby price has established a strong imbalance candle The other established area is the retracement from the high, which >90% confidence within back testing scenarios across 11 crypto pairs, the established supply imbalance from the "0" or top of the swing - (which also aligns with a previous wick close). Price will look to a weekly pivot point. Price will extend to -0.618 or 1.1618 Fibonacci, which will provide a zone where price will enter a profit taking zone and subsequently a over buying imbalance and now create a selling imbalance. Not the previous top wick closes in line with the bearish open price.Weekly ImbalancesDaily Fibonacci Sequence completedPrice now has to break the following levels.I'm aware on the weekly a short opportunity is still present as the monthly zone can still be tested to buy at $108-100 zone, but the monthly also shows a positional change of hands from supply to demand imbalances.If the scenario where a rejection of either -0.27 [$150] and or -0.618 [$123.63] is present, then sell positions can be added to hedge or await buying due to the nature of a bear trap in smaller timescales.Let's view the Fibonacci chartThe swing high and swing low can be applied, measured sells between $245-$222 would have been a high probability of a selling imbalance, this is due to the gearing of daily candle sticks forming a basis of structure which on the three day chart [see 1.1] shows the netting off, where the imbalance meets the close out.1.1Here is the three day chart, which shows the selling imbalance where the netting had occurred. (note, on the weekly the wick created a half weekly high within the imbalance zone).What now?Well, two scenarios will occur for the bullish curve1. being the likelihood of a buying position from a breakout of the buy where price will climb after being squeezed but creates lower highs on the daily and three day chart.2. The second scenario, is based on the imbalance being retested on a deeper correction whereby the -0.618 [daily is tested] or on a higher timeframe, Monthly* - the correction will be based on the wick low (looking left).So long as the chart pushes up and to the right, longs are activated.Buying zones - daily, removedCrypto dominancePossibilities Since it is impossible to predict paths understand scenario analysis I have concluded these two scenarios to create two pathways, there are opportunities to buy accumulate positions here.Orange - follows closer to a daily timeframeWeekly - downside can still occur, but will tail off due to additional volume, cash conversion to buying, profit taking from sellers to buying inputs.Do you enjoy the setups?Professional analyst with 5+ years experience in the capital marketsFocus on technical output not fundamentalsPosition and swing tradesProvide updates where necessary - with new updated ideas tracking the progress.If you like the idea, please leave a like or comment.To all the followers, thank you for your continued support.Thanks,LVPA MMXXII
LupaCapital
Shiba INU - We are in the zone of interest (be patient)

Hello Traders and Analysts,A Note before reading - this is a forecast analysis - based upon our trading strategy. This is tagged Neutral for the short term. Long term, bullish, due to purchasing further increments upon imbalances.Please do not take this as face value and conduct the relevant investment strategy to successfully trade the probabilities.Note:To see more information - review the linked ideas for more crypto and through the analysis links which provide explanation's for further resources.Also to add - regarding the simplified method of the Shib Burning model, a full detailed model will be available - please contact me for further information.** Master Key for zones*Blue = Monthly*Purple = weekly*Red = 4 Days*Yellow = 16 Hours*Orange = Daily*Dark Green = 8 Hour*Grey = 4hour*Pink = 1 hourReview the full analysis below;Weekly Correction almost here;Monthly ImbalanceThus far there is not an abundance of Data provided from brokers and platforms - further imbalances will become clearer, however with data analysed - price had immediately sold off upon listing. Creating an immediate low of 0.0000569. The identifiable formation is a cup and handle which can be more visible on the weekly and four day chart. However with an introduction of further establishment of the traction from fundamental plays where new listings occur price can adopt an established consolidation. So new entrants to the market who began immediate price action on the monthly basis begin an immediate change of hands adding buyers to a selling market from the inception. This has now created a trading rang on the following four months listed whereby 0.0000471 is the established low point forming the monthly imbalance as well as the upper range of the imbalance reaching 0.00000979.The weekly Imbalance update The reason here for the half candle imbalance is provided for two reasons;1. Being the Formation of the 50% low Fibonacci from the peak 1.00 at the introduction of Shiba Inu to the market.2. The second reason for the 50% candle imbalance - is due to the upper 50% quartile using probability for price to retest the body of the candle for buying targets.Price did change hands from a selling market by creating three consecutive higher lows on the weekly timeframe, offering a >50% probability for buying power and long positions to be taken. Again using a fundamental backing with further adoption of users and further development of the project to become a useable token, the development through to the usage of Leash and Bone. - revert below to what is Leash & Bone.Daily Chart updatePrevious analysis;Daily talk pointsThe daily ray is intact with 3 zones of a trend rejection showing the longs are in positional playThe daily close out of the correction shows that the 50% and 0.000047X is a strong psychological value which rests upon a daily and weekly imbalance zone. Further to this - expecting a deep correctional pattern to the 61.8% or 70.5% whereby price has a <90% confidence of testing where price as opened [or rather introduced to market] price.The lower highs being created from the wicks by looking left have offered shorts to be closed out and retested with sellers unable to provide lower lows in the market. This is a sign the trend is reversing for you support and resistance traders.Please be aware that while analysing ETH, BTC, XRP, ADA - the reversion imbalances have often tested 70.5% so expect a pullback to the weekly zone as shown below. To see further studies of this - review my other analysis'. What the top formation correction would offer at a highly probable scenarioThe chart speaks for itself as to what occurred.Do you enjoy the setups?*Professional analyst with 5+ years experience*Focus on technical output not fundamentals*Position and swing trades*Provide updates where necessary - with new updated ideas tracking the progress.If you like the idea, please leave a like or comment.To all the followers, thank you for your continued support.Thanks,LVPA MMXXI
LupaCapital
Shiba Inu - Daily ray rejection

Hello Traders and Analysts,A Note before reading - this is a forecast analysis - based upon our trading strategy. This is tagged Neutral for the short term. Long term, bullish, due to purchasing further increments upon imbalances.Please do not take this as face value and conduct the relevant investment strategy to successfully trade the probabilities.Note:To see more information - review the linked ideas for more crypto and through the analysis links which provide explanation's for further resources.Also to add - regarding the simplified method of the Shib Burning model, a full detailed model will be available - please contact me for further information.** Master Key for zones*Blue = Monthly*Purple = weekly*Red = 4 Days*Yellow = 16 Hours*Orange = Daily*Dark Green = 8 Hour*Grey = 4hour*Pink = 1 hourReview the full analysis below;Monthly ImbalanceThus far there is not an abundance of Data provided from brokers and platforms - further imbalances will become clearer, however with data analysed - price had immediately sold off upon listing. Creating an immediate low of 0.0000569. The identifiable formation is a cup and handle which can be more visible on the weekly and four day chart. However with an introduction of further establishment of the traction from fundamental plays where new listings occur price can adopt an established consolidation. So new entrants to the market who began immediate price action on the monthly basis begin an immediate change of hands adding buyers to a selling market from the inception. This has now created a trading rang on the following four months listed whereby 0.0000471 is the established low point forming the monthly imbalance as well as the upper range of the imbalance reaching 0.00000979.The weekly ImbalanceThe reason here for the half candle imbalance is provided for two reasons;1. Being the Formation of the 50% low Fibonacci from the peak 1.00 at the introduction of Shiba Inu to the market.2. The second reason for the 50% candle imbalance - is due to the upper 50% quartile using probability for price to retest the body of the candle for buying targets.Price did change hands from a selling market by creating three consecutive higher lows on the weekly timeframe, offering a >50% probability for buying power and long positions to be taken. Again using a fundamental backing with further adoption of users and further development of the project to become a useable token, the development through to the usage of Leash and Bone. - revert below to what is Leash & Bone.8 Hour formation;There is a combination whereby the grey bottom correctional channel line is a 4hour line, but this as provided by the screenshot shows a clear 8hour view also encompasses the correctional channel.The channel has offered price action to move towards the upper channel boundary which will now play an important break and retest or rejection for longs as the imbalance has now formed upon the 50% high probability of a rejection of the pivot zone.Daily talk pointsThe daily ray is intact with 3 zones of a trend rejection showing the longs are in positional playThe daily close out of the correction shows that the 50% and 0.000047X is a strong psychological value which rests upon a daily and weekly imbalance zone.The lower highs being created from the wicks by looking left have offered shorts to be closed out and retested with sellers unable to provide lower lows in the market. This is a sign the trend is reversing for you support and resistance traders.Please be aware that while analysing ETH, BTC, XRP, ADA - the reversion imbalances have often tested 70.5% so expect a pullback to the weekly zone as shown below. To see further studies of this - review my other analysis'. What the top formation correction would offer at a high probable scenarioThe chart speaks for itself as to what occurred.Do you enjoy the setups?*Professional analyst with 5+ years experience*Focus on technical output not fundamentals*Position and swing trades*Provide updates where necessary - with new updated ideas tracking the progress.If you like the idea, please leave a like or comment.To all the followers, thank you for your continued support.Thanks,LVPA MMXXI
LupaCapital
Shiba Inu - A full technical analysis

Hello Traders and Analysts,A Note before reading - this is a forecast analysis - based upon our trading strategy. This is tagged Neutral for the short term. Long term, bullish, due to purchasing further increments upon imbalances.Please do not take this as face value and conduct the relevant investment strategy to successfully trade the probabilities. Excuse the delay on this, I began writing this on the 24th October. Note:To see more information - review the linked ideas for more crypto and through the analysis links which provide explanation's for further resources.Also to add - regarding the simplified method of the Shib Burning model, a full detailed model will be available - please contact me for further information.** Master Key for zones*Blue = Monthly*Purple = weekly*Red = 4 Days*Yellow = 16 Hours*Orange = Daily*Dark Green = 8 Hour*Grey = 4hour*Pink = 1 hourWhat is Shiba Inu Token?The First look at the Shiba Inu token came in August of 2020, when its developers took live with the creation to the market, along with an anonymous creator known as “Ryoshi” with an initial supply of one quadrillion tokens, of which was to send 50% of all the tokens on Uniswap and threw away the key (effectively render useless). The remaining 50% were then gifted away, or “burned”, to the Ethereum creator Vitalik Buterin.Risk WarningTrading leveraged products such as Forex, commodities and CFDs, carries with it a high level of risk and so may not be suitable for every investor. Prior to trading the foreign exchange, commodity or CFD market, consider your investment objectives, level of experience and risk appetite. You should never risk more than you can afford to lose. If you fail to understand or are uncertain of the risks involved, please seek independent advice and remember to conduct due diligence.Market dominanceUnderstanding the Market Capitalisation of the coins history.The privatised tracking will be found at the bottom - to view click the link.Attached to the chart is Shiba Inu Dominance tracking - where a positive correlation relating to added userbase, volume of transactions using the 26-27th trading activity for reference24-hour trading volume of $10,2B USD which adds overall long position sentiment.What must happen now to the supply of ERC-20 tokens?Well in order to reduce the supply will of course boost the price having a fixed circulation of tokens available will to those who hold will incur investors to gain.The supply Total is 1,000,000,000,000,000 or 1Quadrillion coins;where the following calcs have been removed;Burn Wallet = -410,253,870,302,595Uniswap = - 94,183,555,893India Covid Relied = -10,139,544,347,612Vitalik Buterin = -46,000,000,201,480 (0xab58)Review the etherscan here for the transactionshttps://etherscan.io/token/0x95ad61b0a150d79219dcf64e1e6cc01f0b64c4ce?a=0xab5801a7d398351b8be11c439e05c5b3259aec9bEst circulating supply retained497,730,966,630,395 or 497Trillion coinsWith Supply Burn Triggers - let's do the maths.so using every listing 25K shib and leash - burn implements.Use 1,000 listings for 25K = 25million burned [simplified] Using a burn rate of 3%, and based on 100m coins and an annual 30% YOY gain in price with a supply of 497T coins. Based on price at a current price 0.00005660The formula [simple] would look like so.=current price*(1+Annual increase YOY)+(Coin supply-new supply after burn)/New net total coin supplyOther variables to consider will be;** Refer to model noteImplied Crypto market cap, Implied ship market cap, implied Price & Burning factorsRefer to BTC chart below or to track the Crypto Dominance vs Total market cap - refer to the link belowhttps://www.tradingview.com/chart/TOTAL/HGxUUyI6-Crypto-Dominance-vs-Total-Market-Cap/Doge Vs Shiba Inu against relative market Dominances.Attached is the private tracking of the two coins and the represented inverse correlation between the two Coins. The negative correlation of the Dogecoin price as well as the dominance is taking effect with the rise of the inverse correlation coin Shiba, whereby the addition of trade volume and ecosystems on which the crypto's are built on are now beginning to take effect. With Doge having a peak of 4% of the market and a market cap of $89.5-7BN, the coins price is now on a market decline as it is now established, but has not yet reached the desired imbalance nor %Dominance which comes with it. A possible coin fluctuation price can be highly probable between the purple imbalance [1][1] Doge Imbalance upon the monthly and weekly combined8 Hour chartWhat is the 8 hour chart showing?Well firstly, a great formation of a correctional symmetrical triangle using the 8hour session candles. This chart pattern has formed through the formation of either a declining lower highs and or an increasing lower lows. Two lines are drawn upon the line squeezes which moves towards an Apex. Depending on inclining higher lows and higher highs within the structure squeeze, then the pattern will produce a bullish continuation upon the Apex breakout.Chart pattern - Symmetrical triangle Bearish example using Shiba INUMonthly ImbalanceThus far there is not an abundance of Data provided from brokers and platforms - further imbalances will become clearer, however with data analysed - price had immediately sold off upon listing. Creating an immediate low of 0.0000569. The identifiable formation is a cup and handle which can be more visible on the weekly and four day chart. However with an introduction of further establishment of the traction from fundamental plays where new listings occur price can adopt an established consolidation. So new entrants to the market who began immediate price action on the monthly basis begin an immediate change of hands adding buyers to a selling market from the inception. This has now created a trading rang on the following four months listed whereby 0.0000471 is the established low point forming the monthly imbalance as well as the upper range of the imbalance reaching 0.00000979.The weekly ImbalanceThe reason here for the half candle imbalance is provided for two reasons;1. Being the Formation of the 50% low Fibonacci from the peak 1.00 at the introduction of Shiba Inu to the market.2. The second reason for the 50% candle imbalance - is due to the upper 50% quartile using probability for price to retest the body of the candle for buying targets.Price did change hands from a selling market by creating three consecutive higher lows on the weekly timeframe, offering a >50% probability for buying power and long positions to be taken. Again using a fundamental backing with further adoption of users and further development of the project to become a useable token, the development through to the usage of Leash and Bone. - revert below to what is Leash & Bone.Four Day chartWhy here?The pull back on the four day chart had resulted in the building block which had perfectly placed itself upon the Fibonacci pivot zones upon the 38.2-50% - this formed the block to gain pivotal long additions as a double tweezer bottom occurred as well as a bearish candle which pulled back, this creates to most shorter time frame traders being daily time frame and below, a correctional move to instate a block which closes on the half body of the introductory candle from the top wick. This failed to break the weekly imbalance and has shown a high probability for added long positions. Market Capitalisation of ShibaINU:Refer to Coinmarket cap for further information regarding supplies, analytics and the ever changing landscape of the Volume, market cap of the top Crypto's.https://coinmarketcap.com/Four Hour chartThe four hour has shown two areas of key interest for adding longs, one key market structure offers the consolidation where price broke out of the triangle apex and engulfed, but came to a high, of which needed a move to look for a Fibonacci pivot based on the structure newly formed which showed a pivot point between 50-61.8% but provided tweezer bottom which is perfect rejection candles to see when analysing the candlesticks.The rejection upon the 50% again has provided the extension pattern to complete at a 1.618 Extension and further, but ofcourse first the hurdle is to retest the Supply imbalance based upon the Fibonacci "0"* and the introduction of the all time high. (See below)A smaller scale imbalance which has just been used at the time of writing has shown the netting of, the selling pressure has netted of the wick - therefore closing out at a [net zero] showing the zone is valid as an equal low has incurred and buying change of hands has occurred again upon counter-traders and profit takers.*FiboShiba Inu Ecosystem:What is Leash and Bone?LEASH tokens are staked or buried, the one staking the coins receives a reward in the form of x LEASH tokens, effectively the holders of x Leash holders are part of the liquidity pool, where a new block is created holders receive a proportional value to share of the pool. The digger of the of token receives a share of Leash ETH SSLP [Super simple ledger protocol]*Boneburying BONE tokens, the user receives tBONE. This entitles the holder the right to be part of a pool that provides the members 1% of all the BONE per block. And digging, in this case, is similar to the function for the LEASH tokens. The person digging or providing liquidity receives a share of the Bon -ETH SSLP*What is Shibaswap?This is a decentralized exchange created for the Shiba Inu community. The community gathers around three main coins: SHIB (the foundational currency of the Shiba Inu, II - LEASH (incentivised on ShibaSwap), and BONE (ShibaSwap’s governance token). The exchange/Swap allows buyers, sellers of the ERC-20 token to be supported by the Shibaswap exchange.BuryStaking (also known as BURY): staking pools for the ecosystem’s tokens (SHIB, BONE, LEASH). It allows you to earn token rewards while staking the tokens. Each pool has different time-locking intervals as well as APYs. Rewards are in the 3 figures percentages and are paid in BONE.Further fundamental news which assist the price increasesNFT token - 10,000 digitalized “lovable creatures” sold out in minutes, Shiba Inu NFTs were available only on the protocol’s DEX – ShibaSwap, buying and trading will be “completely free (except for the gas fee)." - which uses ETH from 0.1ETH +Shiba INU token burns - through transactions Bigger Entertainment - 20Shib tokens burned per song while listening to a playlist of 397 songs.Robinhood listing* - creating further opportunities to further userbase now having access to the crypto to trade.Do you enjoy the setups?*Professional analyst with 5+ years experience*Focus on technical output not fundamentals*Position and swing trades*Provide updates where necessary - with new updated ideas tracking the progress.If you like the idea, please leave a like or comment.To all the followers, thank you for your continued support.Thanks,LVPA MMXXIFurther increments of buys to be added upon the weekly zone if a correctional move occurs.4hour squeeze - looking to build up a consolidation zone above the previous introductory high.
LupaCapital
Cardano long position vs market dominance

Hello Traders and Analysts,Breakdown:1. Note2. Contents3. Research breakdown4. Education recap5. Information on Lupa.A Note before reading - this is a forecast analysis - based upon our trading strategy. This is tagged Long, due to purchasing further increments upon imbalances.Please do not take this as face value and conduct the relevant investment strategy to successfully trade the probabilities.Master Key for zonesRed = Three MonthBlue = MonthlyPurple = weeklyScarlet [Red] - Four dayOrange = DailyGreen = 8 Hour, 16hourGrey = 4hourPink = 1 hourSee dominance chart belowUnderstanding the Market Capitalisation of the coins history.The privatised tracking will be found at the bottom - to view click the link.Here is the Bitcoin market imbalances cap - monthly chartWeekly Bitcoin Market CapNotice the equal lows which have formed the famous double bottom formation. The weekly trendline whilst steep has now seen a sell off, but now can establish a take back being the dominant coin.Daily Market Cap with BTC priceNotice the daily imbalance on the market cap and the price chart equate to the same position opportunity.BTC - candle sticksETH - purpleBNB - Rose pinkXRP - OrangeADA - GreenTracking the major coins as of 6th October 2021BTC - 44.69% ETH - 18.51%BNB - 3.19%ADA - 3.11%USDT - 2.95* XRP - 2.22%* based on a fictional USD stable coin derived from Fiat.Source: https://coinmarketcap.com/Cardano Write upMonthly structureThe market is presenting an interesting scenario;Whereby price has tested the 0.236% Fibonacci - and rejected. However, price can still revert to this level. I.// Where price retests, and rejects further - look to a buy probability with the imbalance closing out with the equal wick to the previous month, assessing the low reactive point.II.// If price indicates a reactive level break, add a net sell position to hedge long positions creating an absolute return positive.WeeklyWeekly Impulse, correction, Impulse waves?Notice, that price has reverted back upon the first Fibonacci sequence wave from the established "0" to 0.705 upon the structure.Using the price wave theory as a basic concept - price has made the consolidation one since the initial tail off from the peak back in 2018. Price has provided a gearing process where the imbalance can be closed out in creating the next sequence high using imbalances, and Fibonacci targets for extension targets.The reversion pivot points are 61-70.5% creating the imbalance confirmation - where price will look to as a position of interest to change hands of sellers to buyers if required.Weekly Market capitalisation of CardanoThe trendline is being respected, however also take into account the pathway in which the % of dominance for ADA shows an opportunity for longs as the overall picture is an uptrend swing based off previous % dominance. Refer to the chart below.Taking the theory and applying said wave; shows the possible predictive pathway - reason being, price has a volume increase, propelling a multitude of in-flow into the market capitalisation.looking to Marketcap: - we have seen that Cardano currently amounts to 77.3B in market cap, with a market share of 3.6% as of September 15th 2021. Updated to October, whereby the marketcap is now 2.86%, meaning that there is now a proportional move to the growth of the market capitalisation in general - meaning if, BTC dominance ideally flows back towards previous dominant percentages, [refer to idea below]. The target percentage of 60% for example will grow the price of BTC and the entire market cap, the relationship of inflows to ADA, ETH and other cois will all provide valuable growth too, as will a correlative price with it. Hence the bullish sentiment. and the model assumptions taken from the base case and conservative targets, overall - the buyers are ever present, looking at the current supply of 71% of tokens circulating, this enables us to understand where price will move in the future as the supply ever reaches full circulation.** If you are interested in the model of the market cap - please send a message via Tradingview.The Daily correction, has provided a solid basis for additional opportunities.The pathwayWhilst BTC and ETH have market dominance, note the importance of the price fluctuations upon these cryptocurrencies, whereby large imbalance moves positive and negative will have a correlative but not a causative response.The idea of having the imbalance at the previous is historical, based upon market structure and explained above.Using the market CapitalisationSee the weekly chart below in reference to the following;BTC - WhiteETH - PurpleADA - Light BlueThe correlation upon the three largest crypto's all have a relativity and looking over the charts all have similar imbalances [as expected], Bitcoin being the most dominant, offers the shift in change first, followed by a lag time for ETH and ADA as the chart shows.Though the products follow different develops within their own space, please note - from a technical aspect the chart still shows a strong factor for clear opportunities to buy, sell based upon price reactive levels - which correlate to the market Cap.If you like the idea, please leave a like or comment.To all the followers, thank you for your continued support.Thanks,LVPA MMXXI
LupaCapital
BTC vs Bitcoin Dominance

Hello Traders and Analysts,A Note before reading - this is a forecast analysis - based upon our trading strategy. This is tagged Neutral for the short term. Long term, bullish, due to purchasing further increments upon imbalances.Please do not take this as face value and conduct the relevant investment strategy to successfully trade the probabilities.Note:I was incorrect in planning the imbalance to take us back to 20k or below, the reason for this is imbalances revert back to the original imbalance.With Crpyto's it seems the Golden ratio and a high probability to 0.786% Deep retracement zone. Master Key for zones*Blue = Monthly*Purple = weekly*Red = 4 Days*Yellow = 16 Hours*Orange = Daily*Dark Green = 8 Hour*Grey = 4hour*Pink = 1 hourPlease see the previous chart idea to understand where price was headingAn interesting note:Based on a modelling concept using a base case where the Cryptocurrency market reaches the size of the gold market and Bitcoin remains at around 50% Market dominance and or reaches 60%+ as the market has previous held % dominance of. The price of BTC can reach heights of according to the multiplication factor of the model. Note: Using at the time of model the gold market is 11.03Trillion. The Implied market cap of 6,781.80T at 60% gives an implied price per BTC at $360,734.04 per BTC. 50% Market dominance will provide an implied price per BTC at $300,611.70 per BTC.To know further about the model please message me in the comments or privately for further information. Monthly ImbalancesHere are the latest imbalances for Bitcoin, where the point of interest had offered a weekly candle close from the peak high of $64,823.XX to $51,997.XX. This is a huge imbalance where price has offered a large change of hands to a critical price inefficiency. Sellers are now in control and created a low with a heavy drop where the weekly shows the rapid selling. This is due to the buying imbalance now changing to provide efficiency based up on the pivot point.Bi-monthly ChartThe weekly sell zone from 64K All time high (at current).The Fibonacci took us back to the weekly zone [which aligns with the Bi monthly] - refer to Weekly chart [1][1] - Weekly ChartThe Fibonacci successfully closes out with the -0.618%.Understanding the Market Capitalisation of the coins history.The privatised tracking will be found at the bottom - to view click the link.Here is the Bitcoin market imbalances cap - monthly chartWeekly Bitcoin Market CapNotice the equal lows which have formed the famous double bottom formation. The weekly trendline whilst steep has now seen a sell off, but now can establish a take back being the dominant coin.Daily Market Cap with BTC priceNotice the daily imbalance on the market cap and the price chart equate to the same position opportunity.BTC - candle sticksETH - purpleBNB - Rose pinkXRP - OrangeADA - GreenTracking the major coins as of 6th October 2021BTC - 44.69% ETH - 18.51%BNB - 3.19%ADA - 3.11%USDT - 2.95* XRP - 2.22%* based on a fictional USD stable coin derived from Fiat.Source: https://coinmarketcap.com/Here is the Daily, since the previous analysis - please ensure you read to understand why this was taken.Do you enjoy the setups?*Professional analyst with 5+ years experience in the capital markets*Focus on technical output not fundamentals*Position and swing trades*Provide updates where necessary - with new updated ideas tracking the progress.If you like the idea, please leave a like or comment.To all the followers, thank you for your continued support.Thanks,LVPA MMXXI
Disclaimer
Any content and materials included in Sahmeto's website and official communication channels are a compilation of personal opinions and analyses and are not binding. They do not constitute any recommendation for buying, selling, entering or exiting the stock market and cryptocurrency market. Also, all news and analyses included in the website and channels are merely republished information from official and unofficial domestic and foreign sources, and it is obvious that users of the said content are responsible for following up and ensuring the authenticity and accuracy of the materials. Therefore, while disclaiming responsibility, it is declared that the responsibility for any decision-making, action, and potential profit and loss in the capital market and cryptocurrency market lies with the trader.