
Loveiceroollss
@t_Loveiceroollss

What symbols does the trader recommend buying?
Purchase History
پیام های تریدر
Filter
TRON (TRX) on the Road to $0.64? An Analysis for the Community

🚀 TRON (TRX) on the Road to $0.64? An Analysis for the Community 🚀 TRON (TRX) is showing strong signs of a potential price surge, with a realistic target of $0.64 based on Fibonacci levels and technical indicators. Here’s why TRX looks bullish heading into 2025: 1️⃣ Technical Analysis The current chart analysis reveals: Fibonacci Level 1.618 highlights $0.64 as a possible target. Strong support levels at $0.24 and $0.28 are holding firm, paving the way for further growth. The price is following a clear uptrend and has recently broken key resistance levels. 2️⃣ Fundamental Strength TRON's ecosystem continues to expand at a rapid pace: Partnership with Bitget: TRON recently announced a collaboration with Bitget, one of the leading cryptocurrency exchanges. This partnership boosts global adoption and liquidity for TRX. Leading in dApps: TRON remains one of the top blockchains for decentralized applications and smart contracts. 3️⃣ Positive Market Momentum USDT-TRC20 Dominance: TRON continues to gain strength globally, driven by the rising adoption of USDT on the TRC-20 network, which offers faster and cheaper transactions compared to alternatives. Bull Market Catalysts: As the broader crypto market enters a bullish phase, TRON is uniquely positioned to benefit, thanks to its established presence across all major exchanges and its robust ecosystem. 4️⃣ Why $0.64? Analysts believe the combination of increased network utility, growing adoption of TRC-20 USDT, and TRON’s technical strength could push the price to $0.64. While the crypto markets are inherently volatile, TRON has historically demonstrated its ability to rally quickly. What’s Your Take? What are your thoughts on the partnership between TRON and Bitget? Do you believe $0.64 is achievable in 2025? Share your opinions with the community! 🌐 📢 Disclaimer: This is not financial advice. Please do your own research before making investment decisions!
DEEPBOOK Set for Explosive Move to 0.11!?

The current DEEP/USDT 4-hour chart shows the price consolidating after a strong upward move, and now it's nearing a crucial decision point. Using Fibonacci retracement, we can identify key support and resistance levels that could dictate the next big move. 🚀 Key Support Zones: The price is currently sitting near the 0.618 Fibonacci retracement level, historically a strong area of support for a potential bullish bounce. 🚀 Further support is found at the 0.5 level, indicating that there’s a high chance the price could reverse upwards from here. 🚀 Strong support from SUI/USDT, as indicated in the chart, adds extra confidence to the bullish potential. 🚀 Resistance Levels: The first major hurdle lies around the 0.786 Fibonacci level and the psychological resistance at 0.100. 🚀 If the bullish momentum continues, the long-term target could be the 1.618 Fibonacci extension at 0.113, signaling significant upside potential. 🚀 Price Action Scenarios: In the bullish scenario, the price could bounce from the current support levels, pushing towards the 1.618 extension for an explosive move upward. 🚀 In the bearish scenario, if the support fails, the price could dip further towards the 0.382 or 0.236 Fibonacci levels before finding solid footing again. 🚀 In summary, DEEP/USDT is at a pivotal moment. A breakout from here could lead to massive gains, while a failure to hold support could trigger a deeper correction. Don’t miss this potential opportunity as the market braces for its next big move!
SUI/USDT Analysis Heading Towards $2.10?

Current Price: $0.859 🟢 Key Points: Fibonacci Retracement: SUI/USDT is currently trading within the "Golden Pocket" between the 0.618 and 0.65 Fibonacci retracement levels, a critical area often associated with strong buying interest. Price Target: The 2.618 Fibonacci extension suggests a potential target of $2.189, which aligns with recent technical developments. Latest News Impact: The SUI ecosystem is seeing significant activity, including potential bullish momentum driven by recent developments such as Grayscale's announcement of a new SUI trust fund and notable OTC bids from large investors. These factors have contributed to a positive market sentiment, with SUI potentially poised for a 40% rally in the near term (CoinGape) (TradingView). 🔄 Potential Scenario: After a strong recovery from recent lows, SUI might push towards the 1.618 Fibonacci extension ($1.527) and eventually the 2.618 extension ($2.189). The recent price action, bolstered by strategic network upgrades and increased institutional interest, supports this outlook. However, traders should be mindful of potential pullbacks, especially if SUI fails to hold its current support levels (CoinGape) (World Coin Index). 💡 Conclusion: With recent bullish developments, SUI/USDT shows promising signs of a rally towards $2.10, especially if key resistance levels are broken. Short-term dips could present buying opportunities in light of the ongoing positive market sentiment.So good look at this 0.236 FibWait for move UP!
SUI/USDT Analysis Heading Towards $2.10?

Current Price: $0.859 🟢 Key Points: Fibonacci Retracement: SUI/USDT is currently trading within the "Golden Pocket" between the 0.618 and 0.65 Fibonacci retracement levels, a critical area often associated with strong buying interest. Price Target: The 2.618 Fibonacci extension suggests a potential target of $2.189, which aligns with recent technical developments. Latest News Impact: The SUI ecosystem is seeing significant activity, including potential bullish momentum driven by recent developments such as Grayscale's announcement of a new SUI trust fund and notable OTC bids from large investors. These factors have contributed to a positive market sentiment, with SUI potentially poised for a 40% rally in the near term (CoinGape) (TradingView). 🔄 Potential Scenario: After a strong recovery from recent lows, SUI might push towards the 1.618 Fibonacci extension ($1.527) and eventually the 2.618 extension ($2.189). The recent price action, bolstered by strategic network upgrades and increased institutional interest, supports this outlook. However, traders should be mindful of potential pullbacks, especially if SUI fails to hold its current support levels (CoinGape) (World Coin Index). 💡 Conclusion: With recent bullish developments, SUI/USDT shows promising signs of a rally towards $2.10, especially if key resistance levels are broken. Short-term dips could present buying opportunities in light of the ongoing positive market sentiment.
pepe go down for a week?

Over the past week , Pepecoin has experienced a significant downturn, with its value plummeting to 0.00000806579. This sudden drop has led to a flurry of Pepe enthusiasts selling off their holdings at this price point. However, there's optimism stirring within the community as whispers circulate that the market is poised to bounce back up to 0.00000316763 in the coming days. This anticipated resurgence has prompted many to hold onto their Pepecoin, eagerly awaiting the expected upswing. As the market teeters on the brink of volatility, investors are closely monitoring the situation, ready to capitalize on any favorable movement. Made by ChatgptMade by Chatgpt Update, pls Ignor the text over me Over the past week, Pepecoin has seen a steady rise, reaching a peak price of 0.00000806579. However, at this price point, a wave of selling has ensued, leading to a decline in Pepe's value. Many holders are cashing out their Pepecoin as it hovers around 0.00000806579. Despite the current downturn, there's speculation circulating that the market will see a reversal, potentially driving Pepecoin back down to 0.00000316763 in the near future. As traders brace for fluctuations in the market, the fate of Pepecoin hangs in the balance, with investors closely watching for signs of a turnaround.
BTC Bitcoin goes to $180,000 in June 2024? Price goal 250.000$!

Bitcoin's Meteoric Rise: Predictions and BlackRock's ETF Impact In the ever-evolving landscape of cryptocurrencies, Bitcoin has consistently remained at the forefront, capturing the imagination of investors and enthusiasts alike. As we approach mid-2024, a flurry of predictions and speculations surround the world's most valuable cryptocurrency, with some experts forecasting a staggering rise to $180,000 by June and even setting a price target of $250,000. Several factors contribute to these bullish forecasts. Bitcoin's limited supply of 21 million coins creates an inherent scarcity, making it a coveted asset in times of economic uncertainty. Additionally, growing institutional adoption, favorable regulatory developments in various jurisdictions, and increasing mainstream acceptance have all played pivotal roles in driving up demand and prices. One significant development that could further propel Bitcoin's ascent is the potential introduction of a Bitcoin Exchange-Traded Fund (ETF) by BlackRock, the world's largest asset manager. An ETF would provide institutional and retail investors with a more accessible and regulated means of investing in Bitcoin, potentially unlocking billions of dollars in new capital inflows. BlackRock's entry into the Bitcoin ETF arena could serve as a watershed moment for the cryptocurrency market, legitimizing Bitcoin as a viable investment asset class and attracting a broader range of investors. The sheer size and influence of BlackRock could also lead to increased market liquidity and reduced price volatility, making Bitcoin a more attractive investment option for conservative investors. However, it's essential to approach these predictions with a degree of caution. Cryptocurrency markets are notoriously volatile, and unforeseen external factors, such as regulatory changes, technological developments, or macroeconomic shifts, could impact Bitcoin's price trajectory. In conclusion, while the $180,000 and $250,000 price targets for Bitcoin may seem ambitious, they are not entirely out of reach given the current market dynamics and potential catalysts on the horizon. BlackRock's potential Bitcoin ETF could indeed be a game-changer, ushering in a new era of mainstream adoption and pushing Bitcoin prices to new heights. As always, investors should conduct thorough research and exercise prudent risk management strategies when navigating the unpredictable world of cryptocurrencies. Made by Chatgpt.LFG we go higher than 250k :)
BomeUSDT to 0.04? BOOK OF MEME the new Dogecoin or a Scam?

This coin could become a new meme for the future, there will be a sell-off, my assessment is that it still has a lot of potential in a few weeks if not years, no investment advice! It dumps because people get scared, I'll keep it regardless if it reaches a value of 0.
Shiba to 0.00005222

Introduction: Shiba Inu (SHIB) has captured the attention of cryptocurrency enthusiasts with its recent price movements. In this technical analysis, we'll explore the potential for SHIB to reach the level of 0.00004807 against its trading pair. Utilizing key technical indicators, we aim to provide insights into the possible direction of SHIB's price action. Analysis: Support and Resistance Levels: Upon examining the historical price data, we identify significant support at 0.00004200 and resistance at 0.00005000. These levels are crucial in determining the potential movement of SHIB towards 0.00004807. Moving Averages: The 50-day and 200-day moving averages indicate a bullish sentiment for SHIB, with the shorter-term average trending above the longer-term average. This suggests positive momentum in the short to medium term. Relative Strength Index (RSI): The RSI currently stands at 60, indicating a neutral stance. However, the RSI has been trending upwards, suggesting increasing buying pressure and potential for further price appreciation. Fibonacci Retracement: Applying Fibonacci retracement levels to SHIB's recent price action reveals that the 0.00004807 level aligns closely with the 38.2% retracement level. Historically, this level has acted as both support and resistance, adding significance to its potential impact on SHIB's price movement. Conclusion: Based on our technical analysis, there is a compelling case for Shiba Inu (SHIB) to reach the level of 0.00004807 against its trading pair. Key indicators such as moving averages, support/resistance levels, RSI, and Fibonacci retracement suggest a bullish outlook for SHIB in the near term. However, traders should exercise caution and conduct their own analysis before making any investment decisions. Made by AIUpdatee!
Shiba to 0.00004807???? Fib

Introduction: Shiba Inu (SHIB) has captured the attention of cryptocurrency enthusiasts with its recent price movements. In this technical analysis, we'll explore the potential for SHIB to reach the level of 0.00004807 against its trading pair. Utilizing key technical indicators, we aim to provide insights into the possible direction of SHIB's price action. Analysis: Support and Resistance Levels: Upon examining the historical price data, we identify significant support at 0.00004200 and resistance at 0.00005000. These levels are crucial in determining the potential movement of SHIB towards 0.00004807. Moving Averages: The 50-day and 200-day moving averages indicate a bullish sentiment for SHIB, with the shorter-term average trending above the longer-term average. This suggests positive momentum in the short to medium term. Relative Strength Index (RSI): The RSI currently stands at 60, indicating a neutral stance. However, the RSI has been trending upwards, suggesting increasing buying pressure and potential for further price appreciation. Fibonacci Retracement: Applying Fibonacci retracement levels to SHIB's recent price action reveals that the 0.00004807 level aligns closely with the 38.2% retracement level. Historically, this level has acted as both support and resistance, adding significance to its potential impact on SHIB's price movement. Conclusion: Based on our technical analysis, there is a compelling case for Shiba Inu (SHIB) to reach the level of 0.00004807 against its trading pair. Key indicators such as moving averages, support/resistance levels, RSI, and Fibonacci retracement suggest a bullish outlook for SHIB in the near term. However, traders should exercise caution and conduct their own analysis before making any investment decisions. Made by AISL hit ;/
Coinbase Stock: Potential Surge to $230 vs. Dip to 90$ ?
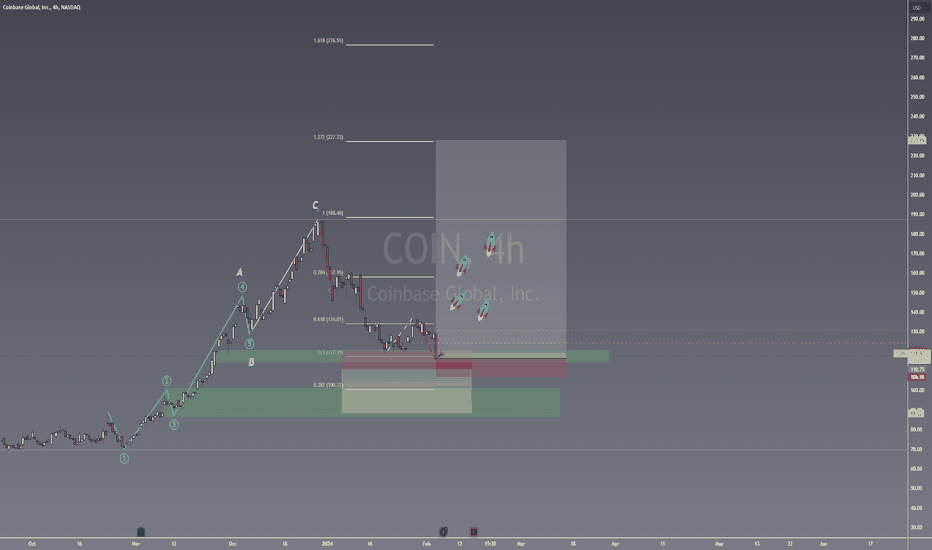
The Dynamic Trajectory of Coinbase Stock: Navigating Towards $230 with a Gaze on ETF Influence As the cryptocurrency market continues to mature, the intersection of traditional financial instruments like ETFs (Exchange-Traded Funds) and digital assets is becoming increasingly significant. In this evolving landscape, Coinbase, a beacon for the crypto economy, finds its stock at a pivotal juncture. With the stock currently priced at $118.49, there's speculative anticipation that it could ascend to $230, aligning with the 1.272 Fibonacci retracement level—a notable technical indicator used by traders to gauge potential reversal points in stock prices. The Climb to $230: A Confluence of Catalysts The potential surge to $230 is not unfounded but hinges on a confluence of positive market dynamics and strategic corporate milestones. A key factor could be the anticipated influx of new ETFs in 2024, tailored to cater to the crypto market. These ETFs are expected to not only broaden the investor base by offering a regulated pathway into cryptocurrency investments but also to inject significant liquidity into the market. For Coinbase, a platform at the forefront of offering access to digital currencies, the proliferation of crypto-related ETFs could translate into increased trading volumes and, consequently, higher revenue streams. Moreover, the broader acceptance and integration of cryptocurrencies into the financial ecosystem, spurred by the launch of these ETFs, could lead to heightened demand for Coinbase's services. As institutional and retail interest in crypto assets intensifies, Coinbase's pivotal role in the ecosystem positions it to potentially capitalize on this growth trajectory. The $90 Contingency: Navigating Potential Headwinds However, the path to $230 is fraught with uncertainties inherent to the volatile nature of the crypto market. Should Coinbase fail to leverage the expanding ETF landscape or if broader market conditions turn bearish, the stock could witness a retraction towards the $90 range. This potential downturn could be exacerbated by regulatory hurdles, competitive pressures, or shifts in investor sentiment, underscoring the importance of strategic agility and market adaptation for Coinbase. 2024: A Pivotal Year for ETFs and Coinbase The year 2024 stands out as a watershed moment for the crypto market, with the expected launch of numerous crypto-focused ETFs. This development is poised to bridge the gap between traditional finance and the burgeoning world of digital assets, offering a new vista of growth opportunities for platforms like Coinbase. As these ETFs come to fruition, they could significantly impact Coinbase's market position, either by propelling the stock towards the $230 mark, reflective of robust growth and investor confidence, or by testing its resilience in the face of market adversities. Conclusion The trajectory of Coinbase's stock in the context of an evolving crypto ETF landscape encapsulates the dualities of opportunity and challenge. While the potential ascent to $230 symbolizes a milestone of growth and mainstream acceptance, the risk of a decline to $90 serves as a reminder of the volatile and unpredictable nature of the crypto market. For investors and market watchers alike, the unfolding dynamics of crypto ETFs in 2024 will be a critical factor to monitor, offering insights into not only the future of Coinbase but also the broader digital asset ecosystem. Understanding the Dynamics of Crypto Investments: A Disclaimer It's important to recognize that the realm of cryptocurrency investments is marked by its volatility and complexity. As we explore potential scenarios for assets like Coinbase stock or the broader impacts of new crypto-focused ETFs, it's crucial to underscore that these discussions are purely speculative and serve to inform and entertain rather than advise. Cryptocurrency markets are highly unpredictable, influenced by a myriad of factors ranging from regulatory changes and market sentiment to technological advancements and global economic conditions. While the potential for significant returns exists, so does the risk of substantial losses. As such, any investment in cryptocurrency or related financial instruments should be approached with caution and due diligence. Disclaimer: Not Financial Advice This content is provided for informational purposes only and should not be construed as financial advice, endorsement, or recommendation of any specific investment strategy or financial product. The scenarios and outcomes discussed are hypothetical and based on assumptions that may not materialize. Investing in cryptocurrencies and other financial markets carries risks, and decisions should be made based on your own analysis, risk tolerance, and financial situation. It is highly recommended to consult with a qualified financial advisor before making any investment decisions. The future of the cryptocurrency market and assets like Coinbase stock remains uncertain, and while opportunities for growth are evident, they come with their own set of risks and challenges. Navigating these waters requires a well-informed strategy, a clear understanding of your investment goals, and a readiness to adapt to changing market conditions. Remember, the key to successful investing is not just in predicting market movements but also in planning for various outcomes, understanding the risks involved, and managing your investment portfolio with a balanced and informed approach.280 new targetTp hit on 280, ty for all make Profit!
Disclaimer
Any content and materials included in Sahmeto's website and official communication channels are a compilation of personal opinions and analyses and are not binding. They do not constitute any recommendation for buying, selling, entering or exiting the stock market and cryptocurrency market. Also, all news and analyses included in the website and channels are merely republished information from official and unofficial domestic and foreign sources, and it is obvious that users of the said content are responsible for following up and ensuring the authenticity and accuracy of the materials. Therefore, while disclaiming responsibility, it is declared that the responsibility for any decision-making, action, and potential profit and loss in the capital market and cryptocurrency market lies with the trader.