
JoE
@t_JoE

What symbols does the trader recommend buying?
Purchase History
پیام های تریدر
Filter
JoE
ETH/USDT (Monthly) – Symmetrical Triangle Breakout
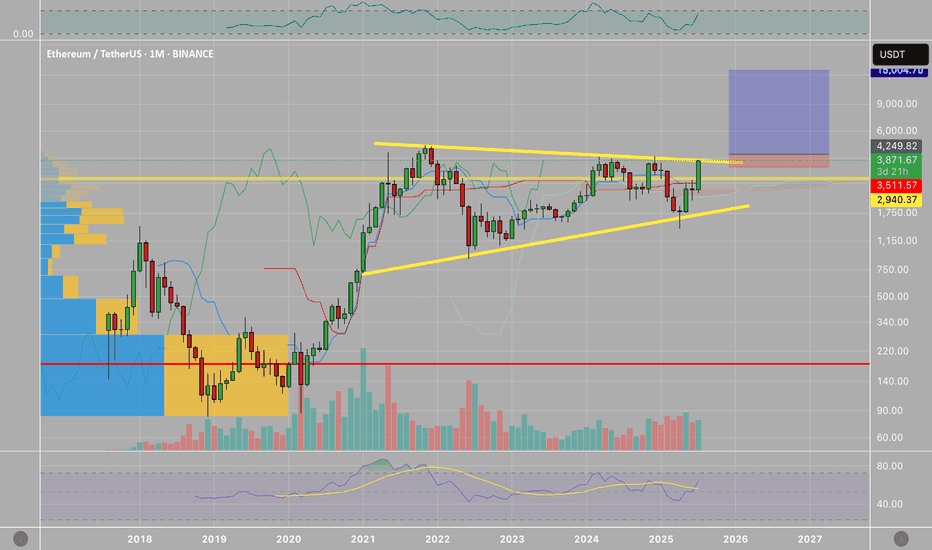
Pattern & Technical Setup Ethereum (ETH/USDT) is showing a textbook symmetrical triangle pattern on the monthly chart. The pattern has been developing since the 2021 high, with lower highs converging with higher lows. The current candle has broken out above the triangle’s upper trendline, suggesting a potential bullish continuation. This breakout is significant given the long consolidation period and strong volume profile near the breakout zone. Trade Plan •Entry: Around $4000 on confirmed monthly close above triangle. •Stop Loss: Below $3,500 (safe side under breakout + previous support). •Profit Targets: $4,800 (measured move target based on triangle height) ⸻ Risk & Reward •Risk: ~17% downside (stop at $2,950) •Reward: ~253% upside to $4,800 •R/R Ratio: ~14:1 (favorable for swing trade)
JoE
Cup&Handle with a valid break
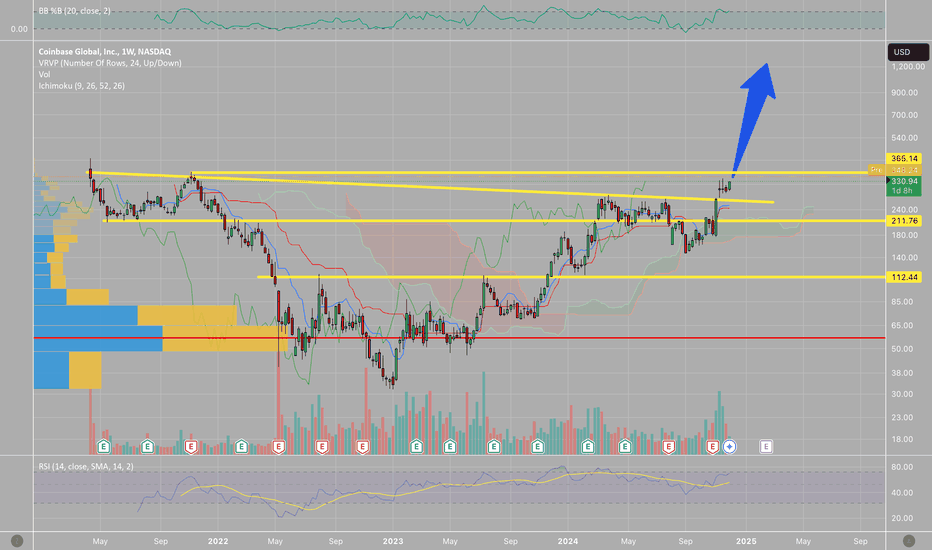
On the weekly chart of COIN (Coinbase Global, Inc.), we see a classic Cup and Handle pattern forming over an extended period. The breakout above the handle’s resistance is supported by strong price momentum, as indicated by the Ichimoku Kinko Hyo cloud and RSI strength. Key highlights: •Breakout Level: ~$330 confirmed, heading towards $365 resistance zone. •Ichimoku Analysis: Price action is well above the cloud, signaling bullish momentum. •Volume Profile: Strong volume at breakout adds credibility to the move. •Next Target: Possible upward momentum toward $500+ if the breakout holds and market conditions remain supportive. This breakout marks a significant move for COIN , offering an excellent opportunity for bulls. Keep an eye on volume and overall market sentiment to confirm further upside potential.
JoE
Easy 3x from here for Uniswap

When it comes to DEFI, what is the go-to website for you? For me it's Uniswap, with clarity of regulation down the road as Trump takes office, UNI is destined to succeed in my opinion. The chart looks amazing as well, clear break of asymmetrical triangle, seems like a low risk high reward trade for me. ###NOT FINANCIAL ADVICE###
JoE
BNB is a no brainer here

BNB is a no brainer here, buy low sell high. Simple as that. You can call it a head and shoulder, a cup and handle, call it whatever you want, but you'll come into one single conclusion, which is bullish. I'd be surprised if this isn't the last chance we see 3 digits for $BNBUSDT. ###NOT FINANCIAL ADVICE###
JoE
MATICUSDT Symmetrical Triangle

MATICUSDT is showing a Symmetrical Triangle currently breaking out and has now retested support. On the other hand we've got MATICBTC on the relative low with an inverse head and shoulders pending bull break. Which further aligns with my MATICUSDT thesis.
JoE
Ethereum Ascending Triangle Breakout

Ethereum Ascending Triangle Breakout We're witnessing a potential bullish movement on the ETHUSDT pair as it breaks out of an ascending triangle pattern. This chart indicates a significant long trading opportunity that follows a consolidation period, which has just culminated in a breakout. Key Observations: 1. Ascending Triangle Formation: The ETH price has formed higher lows since the beginning of its consolidation, suggesting a buildup of buying pressure. The flat upper trend line shows a resistance level that has been tested multiple times. 2. Breakout Point: The price has broken above the resistance level, confirming the ascending triangle pattern. This could potentially signal the start of a new uptrend. 3. Volume Profile: A noticeable increase in volume accompanies the breakout, adding credence to the bullish signal. 4. Price Target: Based on the height of the triangle, the projected price target is set around $4,000, offering a substantial upside potential from the breakout point. 5. Risk Management: A stop loss has been placed at $1,950 below the breakout level to minimize potential losses if the market moves against the position. 6. R/R Ratio: The trade boasts a healthy risk/reward ratio of 12.52, appealing for risk-conscious traders. 7. Technical Indicators: The RSI and MACD indicators show momentum in favor of the bulls, with the RSI trending upwards and the MACD line crossing above the signal line. Trading Strategy: - Entry Point: Consider entering the trade above the breakout level to ensure confirmation of the bullish trend. - Stop Loss: Set a stop loss at $1,950 to protect your investment against any sudden reversals. - Take Profit: Aim for the price target of $4,000, but be ready to adjust based on market behavior and new technical patterns that may emerge. Remember to conduct your due diligence and consider this analysis as one part of your trading decision. *Disclaimer: This post is for educational purposes only and is not to be construed as financial advice.
JoE

JoE

JoE
Bitcoin is not done yet

Bitcoin is not done yet We are seeing a retest of the previous inverse head and shoulder pattern neckline. A strong bounce would confirm the validity of the neckline support, also BTC.D is acting strong. This could be a combination of a concentration of money into the Bitcoin and an effect of the upcoming halving event. A great risk reward trade has presented itself and this might be the trade of the year.
JoE
XRP falling wedge breakout.

XRP falling wedge breakout. A huge falling wedge breakout occured on XRPUSDT while we are seeing an inverse H&S on the micro level. This is a great opportunity to go long with very small risk. ###NOT FINANCIAL ADVICE###Trade activeComment: Making some new progress here, take me to the moon plz.
Disclaimer
Any content and materials included in Sahmeto's website and official communication channels are a compilation of personal opinions and analyses and are not binding. They do not constitute any recommendation for buying, selling, entering or exiting the stock market and cryptocurrency market. Also, all news and analyses included in the website and channels are merely republished information from official and unofficial domestic and foreign sources, and it is obvious that users of the said content are responsible for following up and ensuring the authenticity and accuracy of the materials. Therefore, while disclaiming responsibility, it is declared that the responsibility for any decision-making, action, and potential profit and loss in the capital market and cryptocurrency market lies with the trader.