
Hosseinshokrii
@t_Hosseinshokrii

What symbols does the trader recommend buying?
Purchase History
پیام های تریدر
Filter
Hosseinshokrii
تحلیل بیت کوین: مثلث صعودی مرموز و راز هدف قیمتی بعدی!
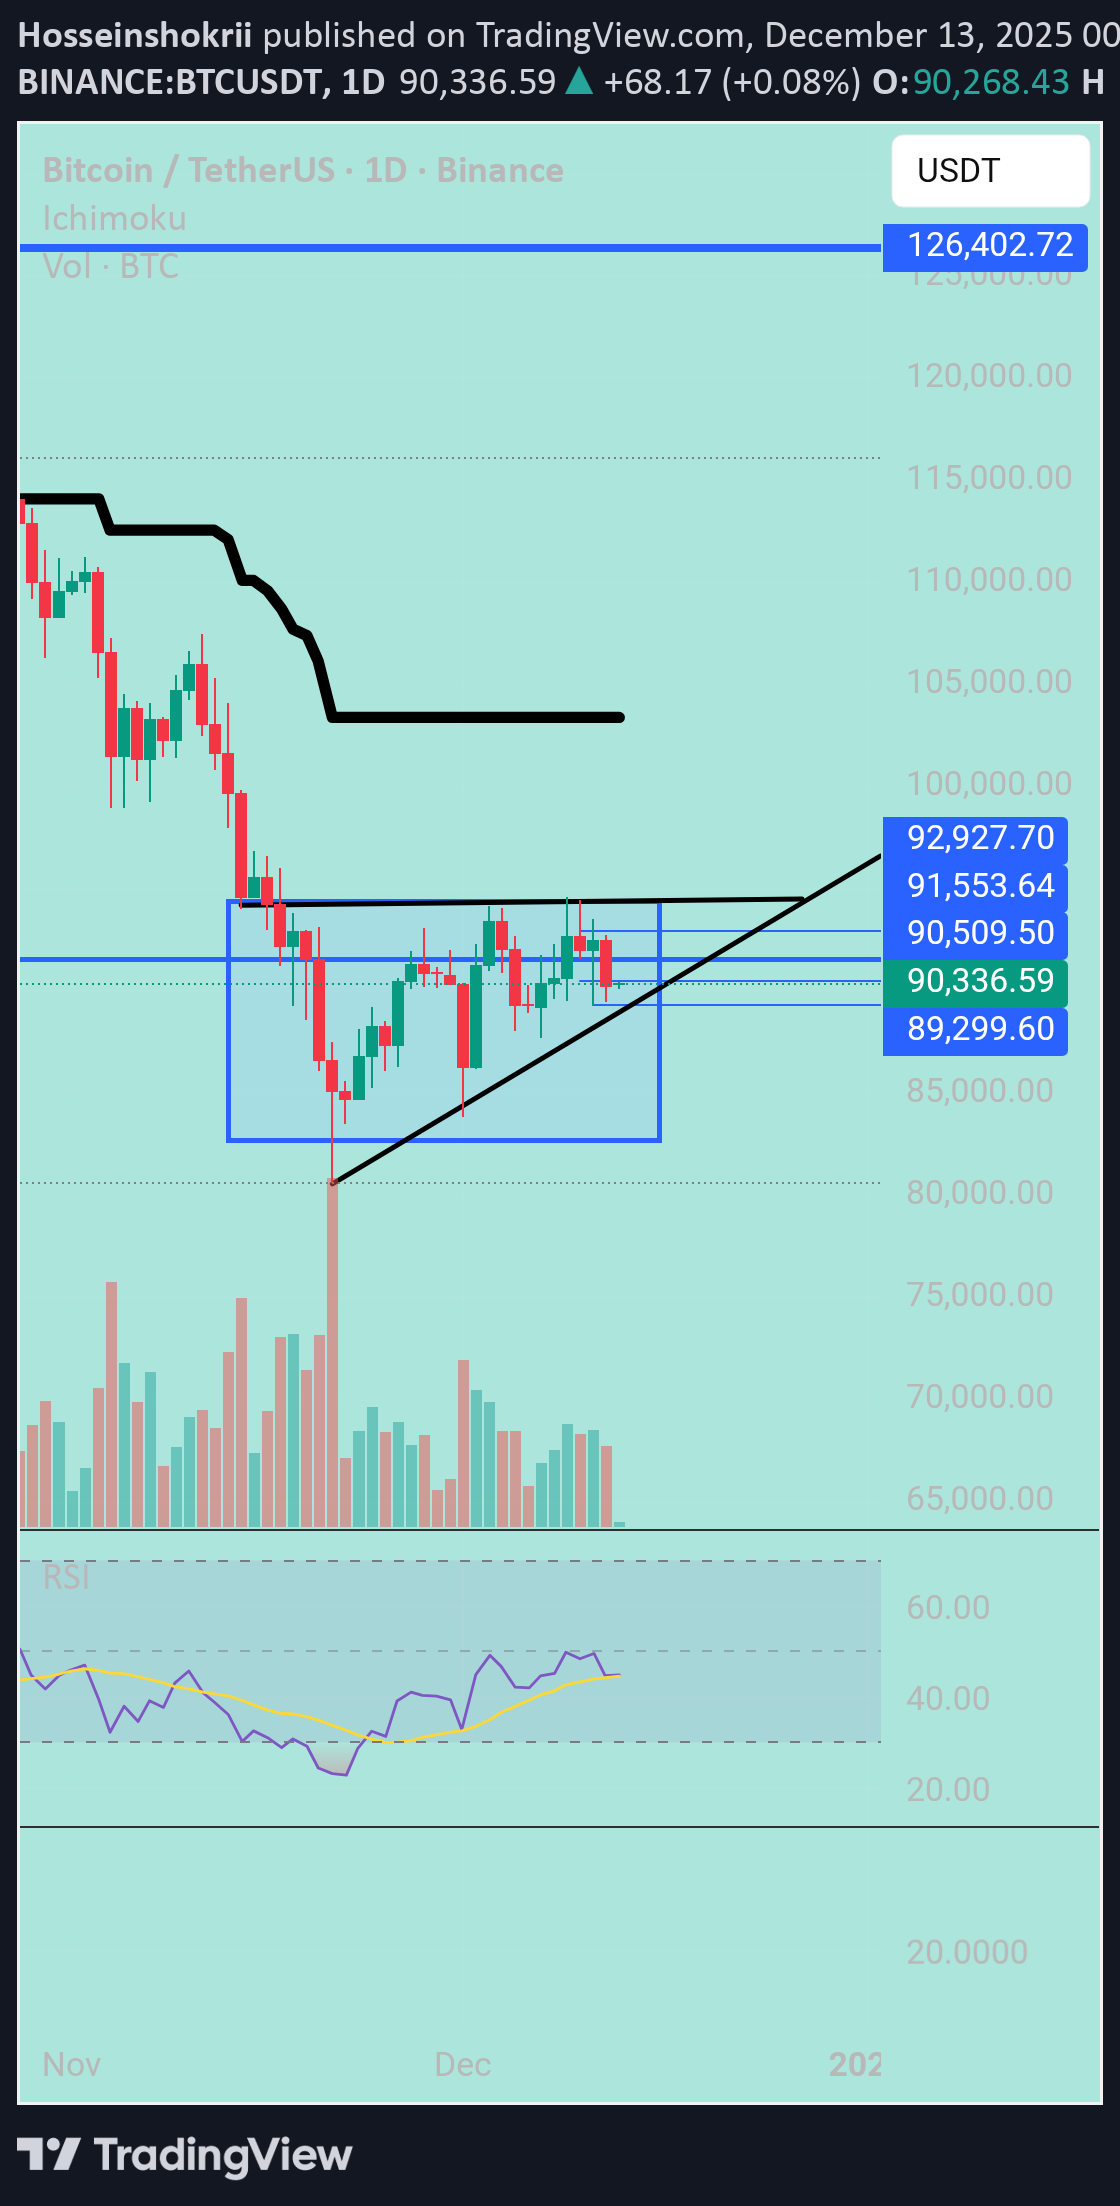
Hi snipers. Bitcoin fell from its historic high of $126,199 in the weekly timeframe and reached a low of $80,600 in 7 weeks, although it only touched this price with a shadow. During this period, the decline was on increasing volume, after which it stopped and there was a weekly bullish candle with medium volume and two doji candles. If we look at these 3 candles on the daily timeframe, we see a fixed high of 94,500 and increasing lows, which is an ascending triangle pattern. Of course! Here's the English translation of the full explanation I gave earlier: --- This pattern is most likely an **Ascending Triangle**, which typically signals a continuation of an uptrend and a potential **bullish breakout**. #### 📐 What Is an Ascending Triangle? An ascending triangle forms when: - The **resistance level (ceiling)** remains flat (in this case, at 94,000). - The **support levels (floors)** are gradually rising, indicating increasing buying pressure. This pattern often appears in uptrends and suggests that **buyers are gaining strength** and may soon push the price above the resistance. #### 📈 Key Insights from This Pattern - **Breakout Confirmation**: A valid breakout occurs when the price closes above 94,000 with strong volume. - **Price Target**: The height of the triangle (difference between the first low and the resistance) is often projected upward from the breakout point. For example, if the first low was 85,000, the target could be around 103,000. - **Beware of False Breakouts**: If the breakout happens with low volume or lacks follow-through, the price might fall back into the triangle. #### ⚠️ Cautions and Considerations - **No pattern is 100% reliable**. It's best to use additional tools like RSI, MACD, or moving averages for confirmation. - **Risk management is crucial**. Setting a stop-loss just below the last higher low can help limit potential losses. Would you like a chart of this pattern or a more detailed analysis of Bitcoin’s current setup?
Hosseinshokrii
Seiusdt

Hello snipers. The sei / usdt currency pair is on the one-day time frame. The price is still moving in an ascending channel. With the market turning red, a strong bearish candle has brought the price to the bottom of the channel. Fortunately, the moving average line is below the price at the bottom of the channel, which can be a strong support and I hope the price will turn back from this point and move towards the top of the channel. Do not catch the falling knife in your hand. Wait for the reaction to the bottom and support. I am learning. Analysis is not a recommendation to buy or sell. 🙏🙏🫶
Hosseinshokrii
Avaxusdt
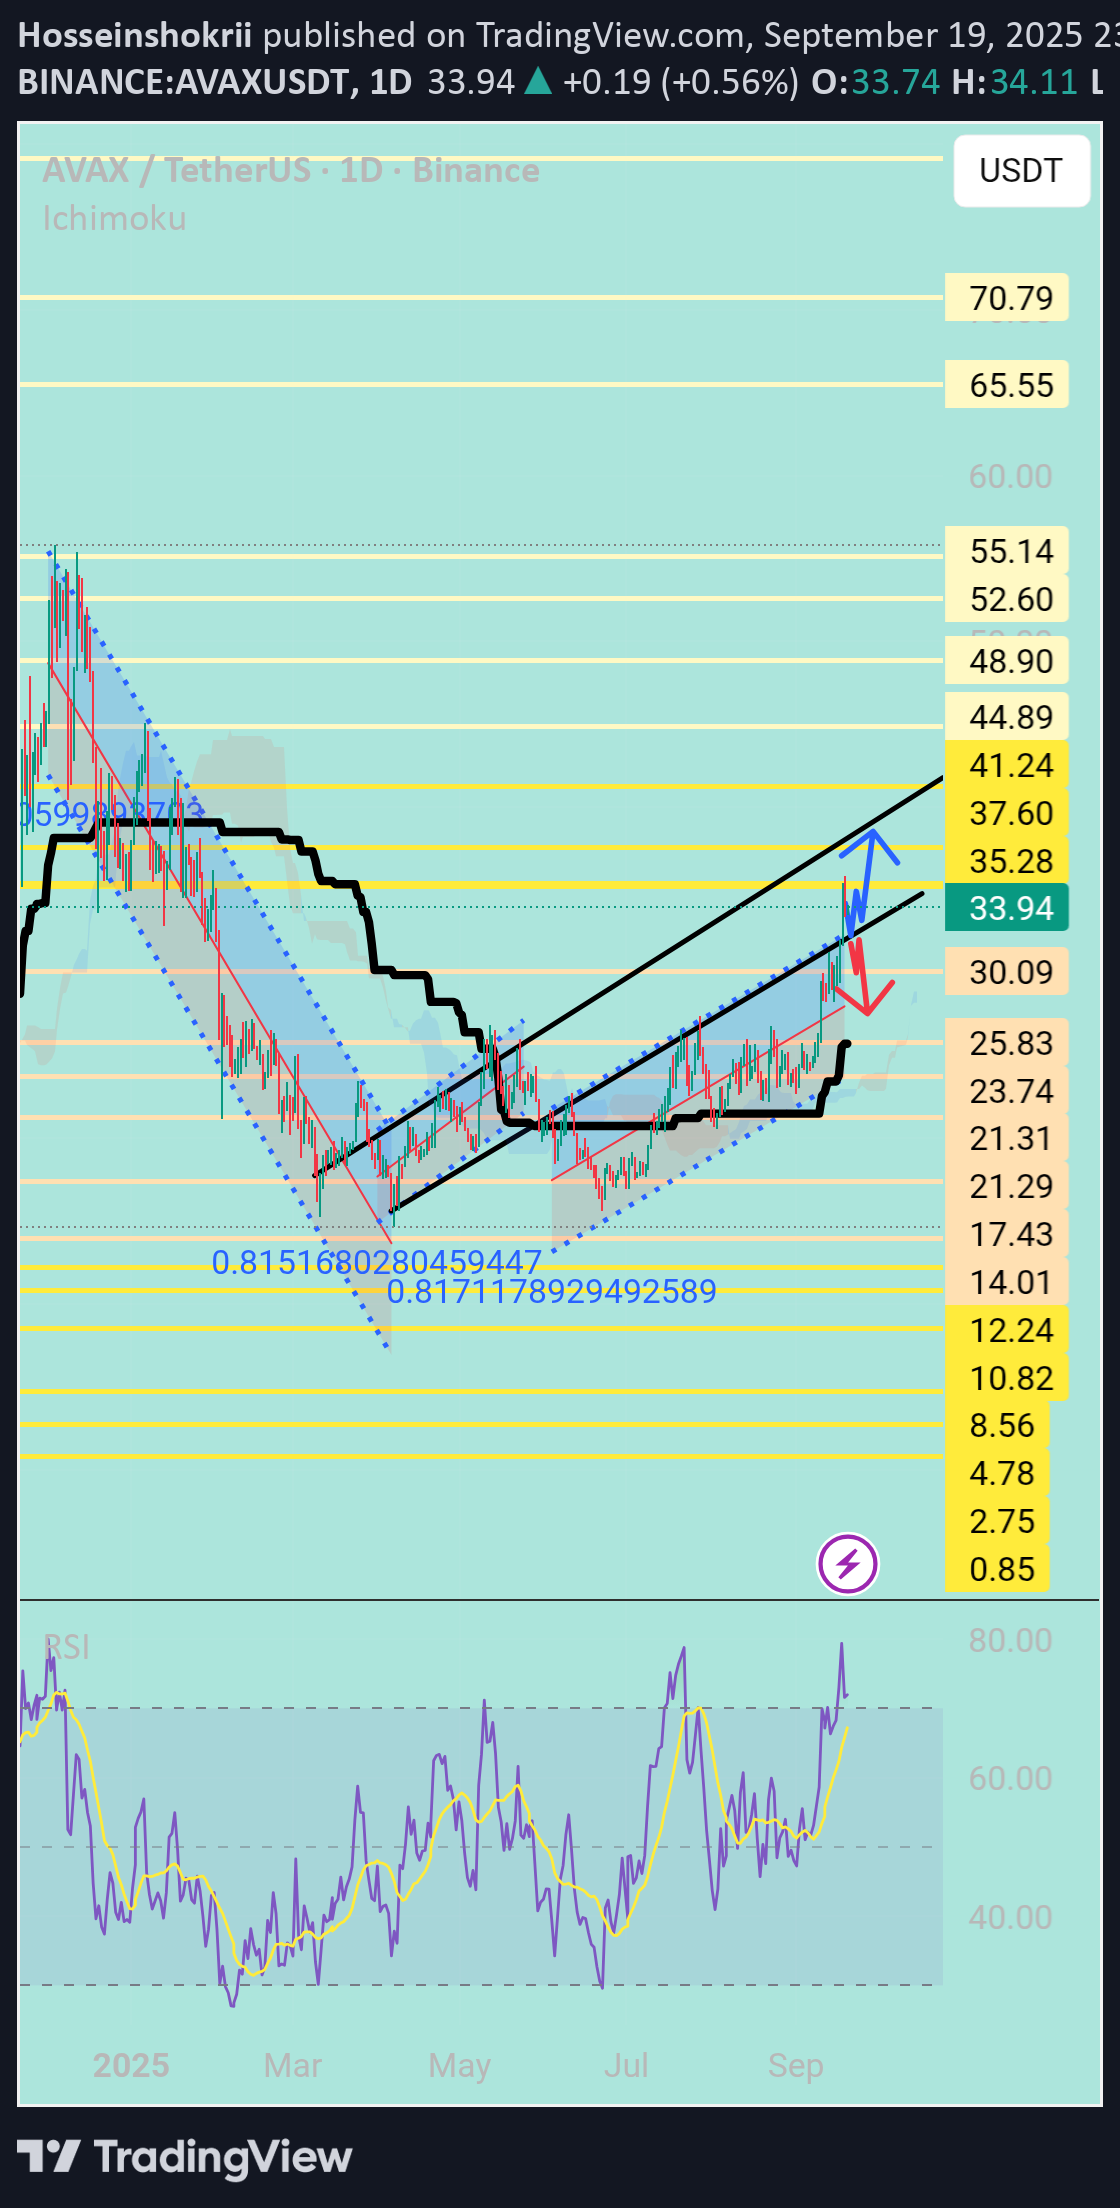
Hi snipers. The avax / usdt currency pair on the one-day timeframe has managed to break the upper line of the ascending channel. In the overall picture, we see an older ascending channel that has been invalidated, which is parallel to the current channel, which the price has re-entered. The price has now hit a resistance (35) and has reversed. It will probably hit the bottom of the new channel and resume the upward trend again, but if this line is broken, there is also a possibility of returning to the previous channel. I am learning. The analysis is not a buy or sell recommendation. 🙏
Hosseinshokrii
Cakeusdt
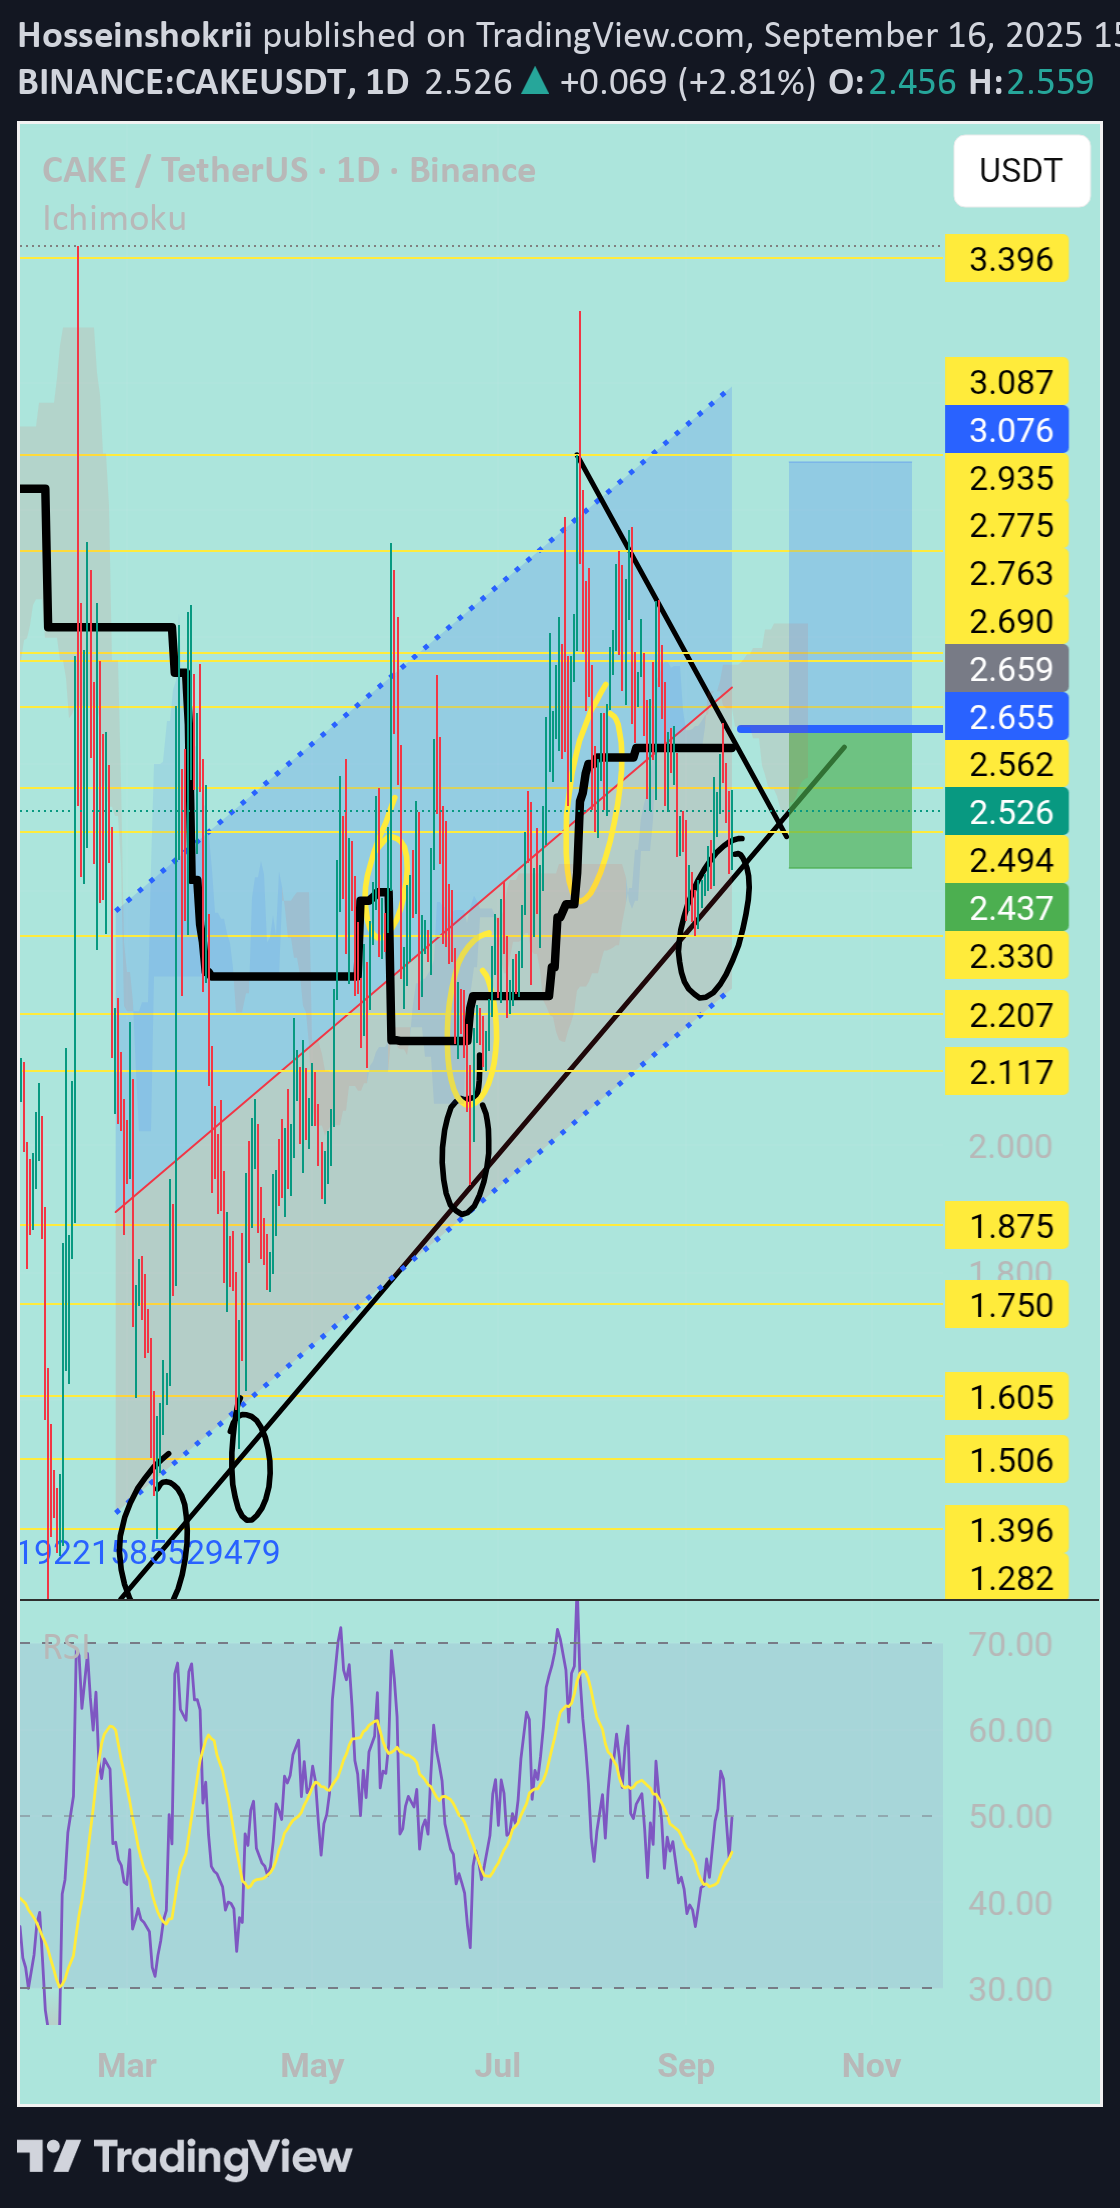
Hi snipers. The cake / usdt currency pair is in a wide and long-term ascending channel on the one-day timeframe, which is fluctuating between the bottom and top of the channel. The moving average line is in the middle of the channel, and every time after breaking this line, the price has increased well. If it breaks again and the price closes above the black line (103-day moving average), there is a possibility of the price increasing and touching the top of the channel. I am learning. The analysis is not a recommendation to buy or sell. 🙏
Hosseinshokrii
Aptusdt
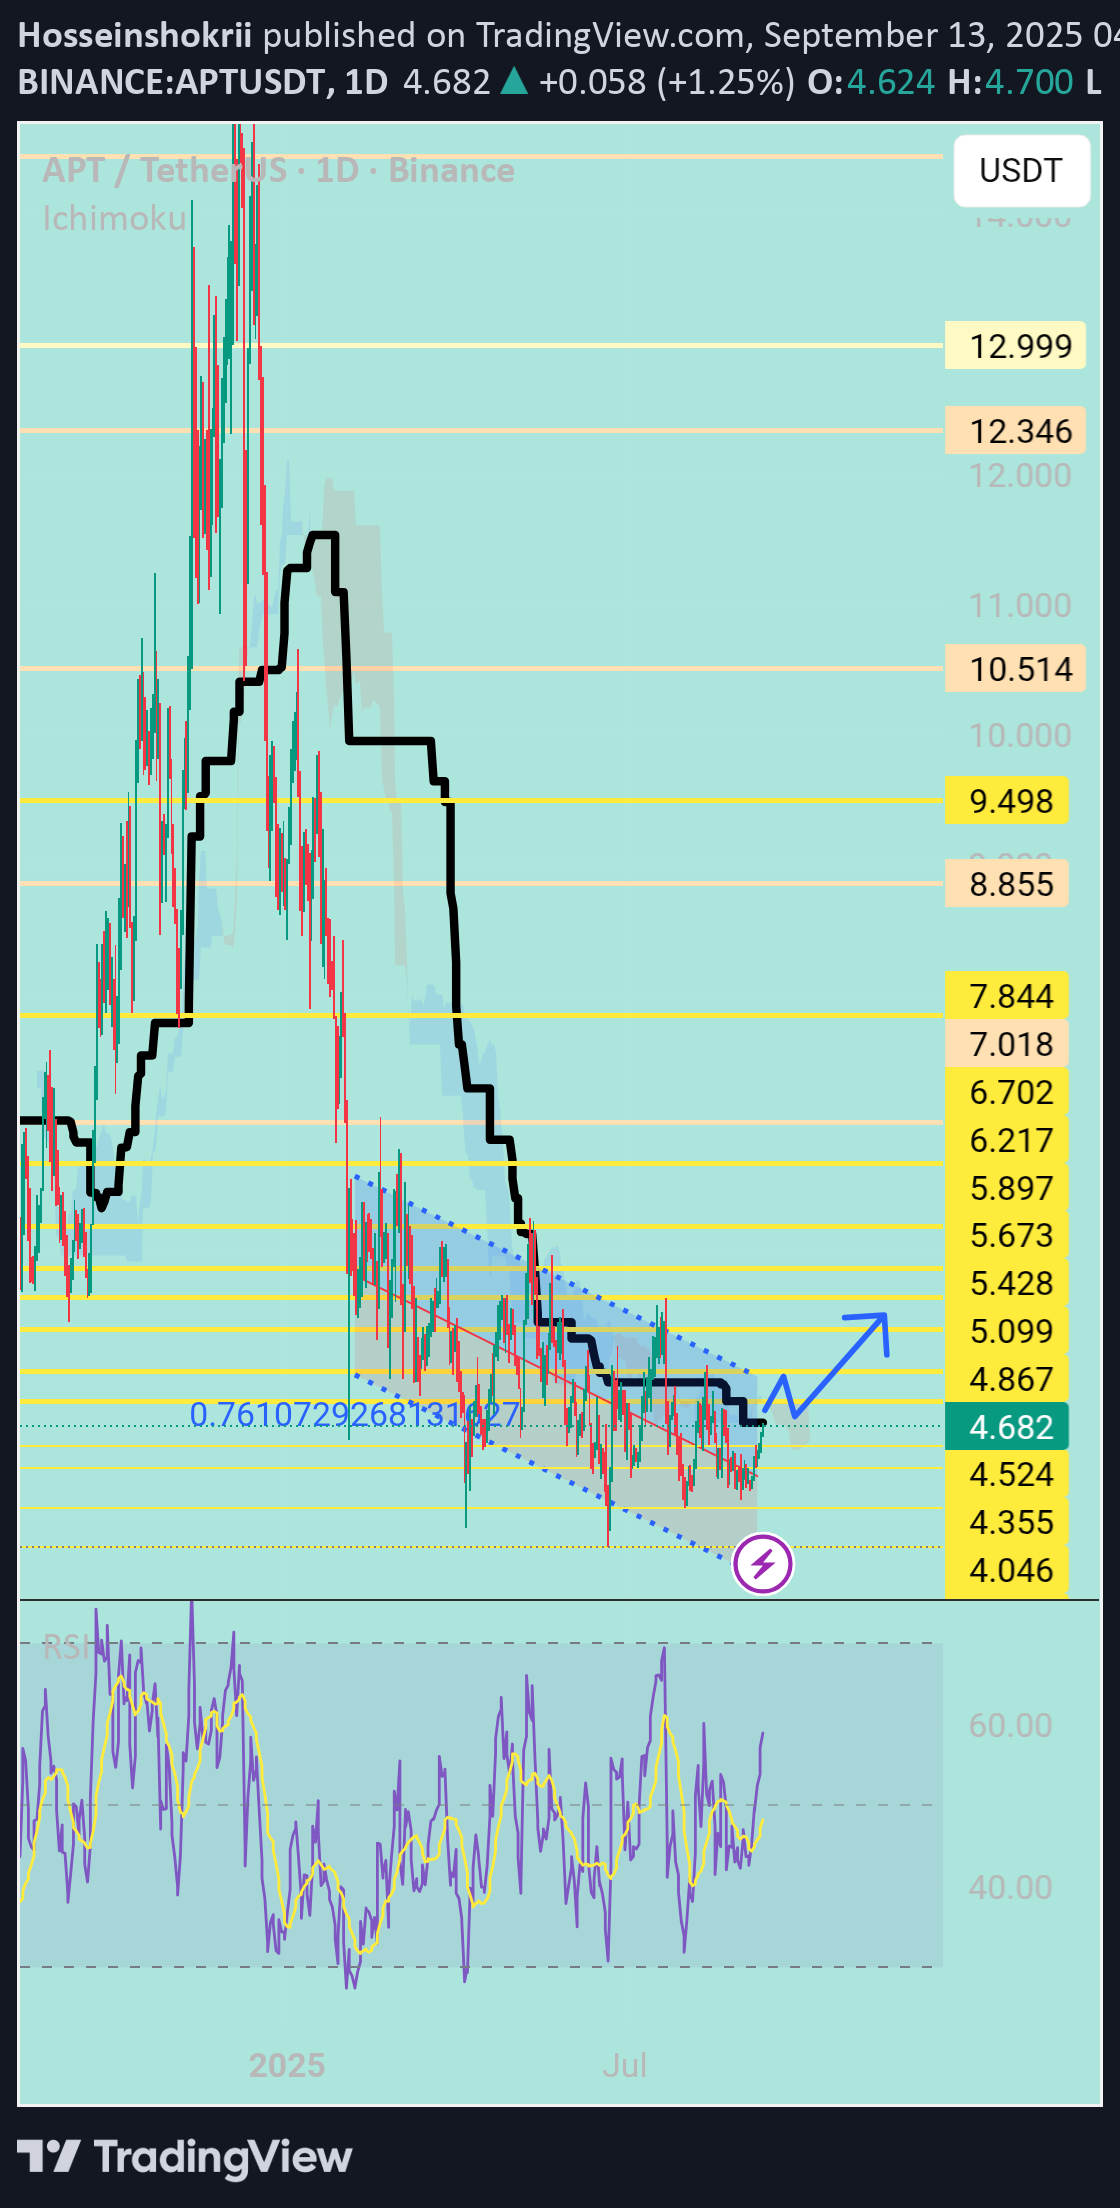
Hi snipers. APT USDT on the one-day time frame has gone far from its price ceiling. But in this chart it is trying to escape from this downward channel. The price has reached a sensitive point. My experience says that the black moving average line acts like a magnet and pulls the price towards itself and plays both a resistance and a support role. If the price can cross it, we will see a good price increase. I am learning and this is not a buy or sell offer. Good luck
Hosseinshokrii
FARTCOINUSDT
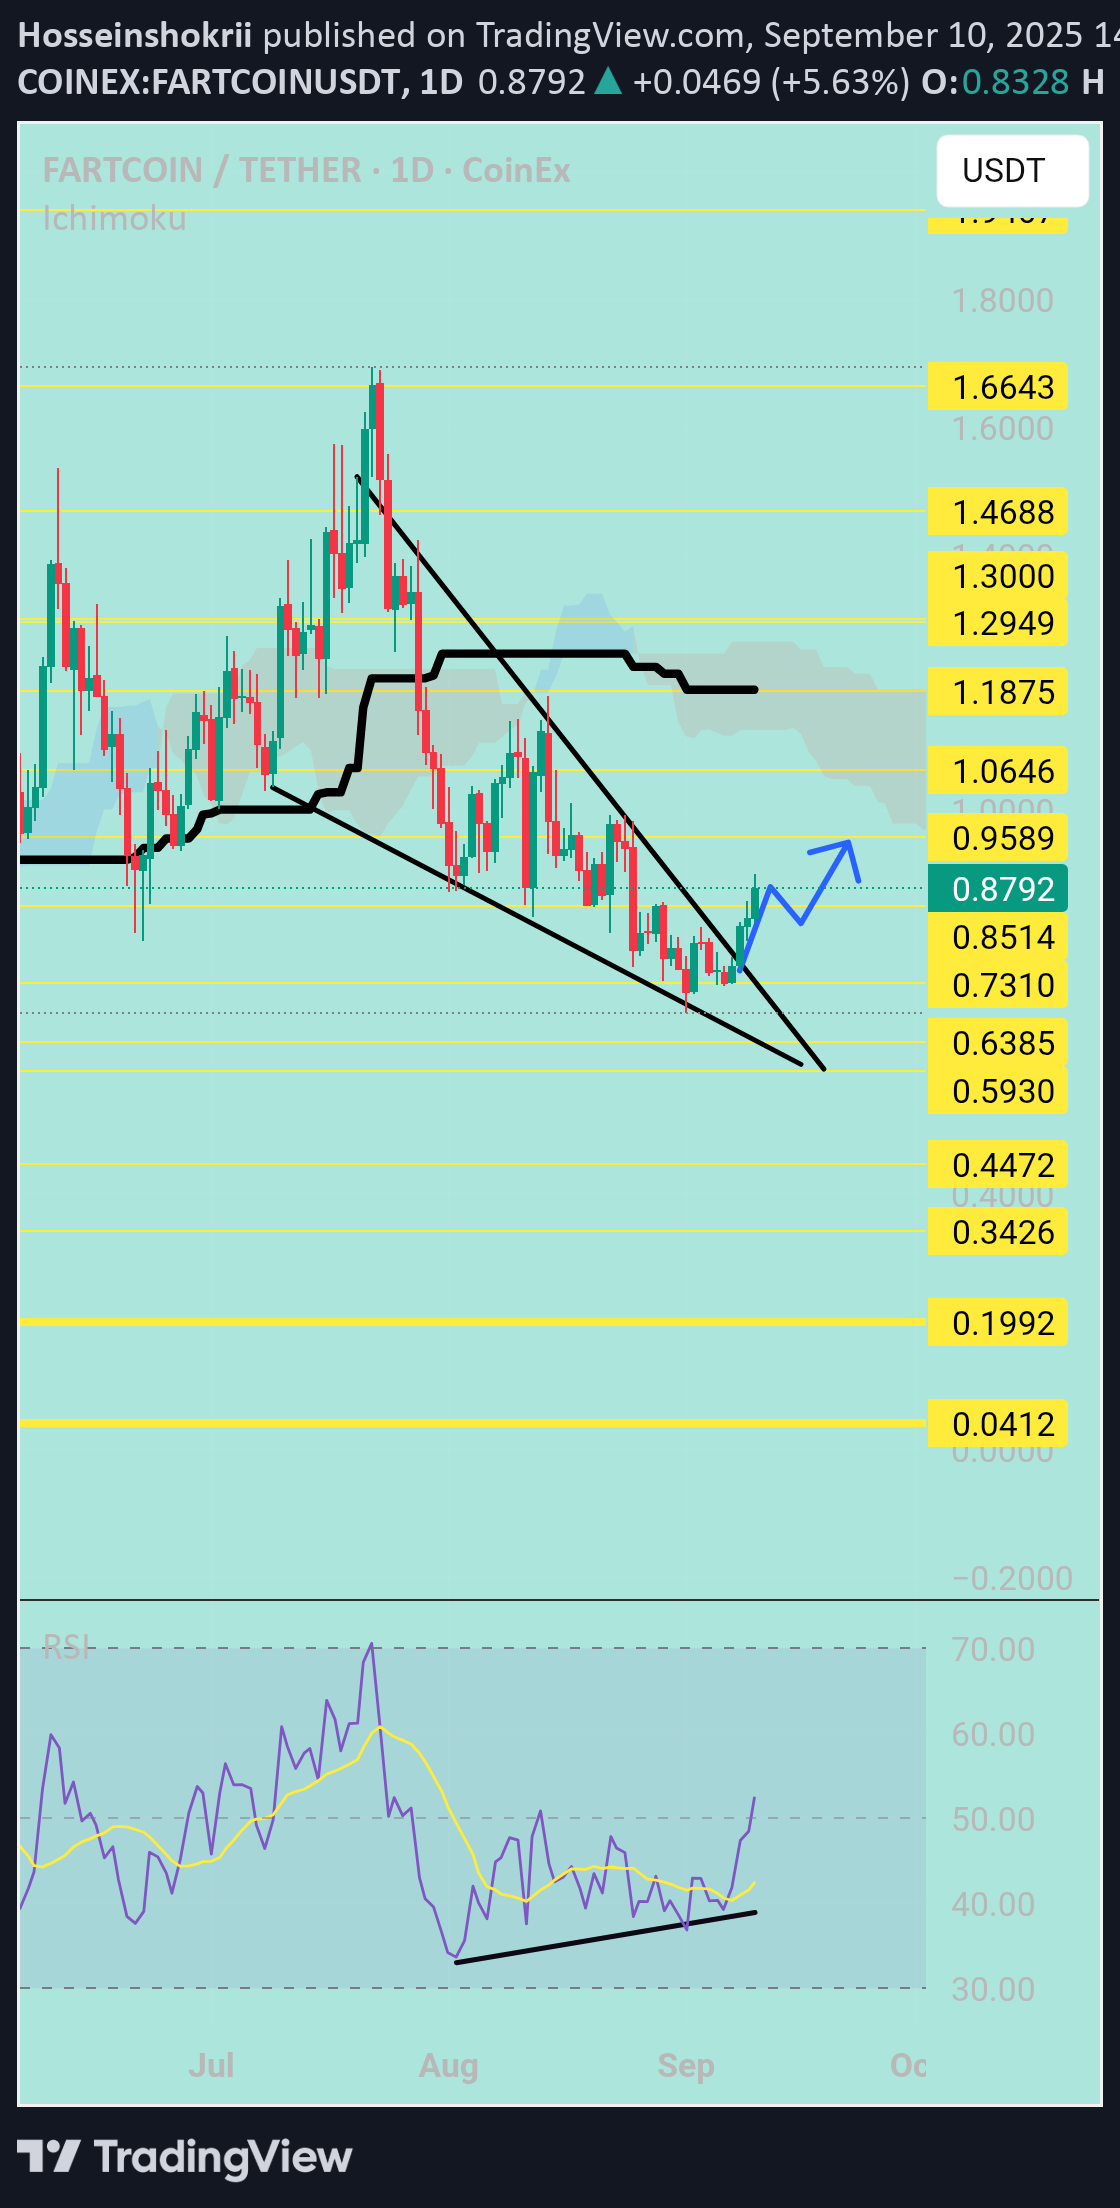
Hi snipers. On the one-day timeframe, we witnessed the formation of a descending triangle, which, along with a divergence, was able to form an upward breakout. Given the increase in trading volume, I expect the price to grow further. I am practicing and learning, and this is not a buy or sell recommendation.
Hosseinshokrii
WLDUSDT
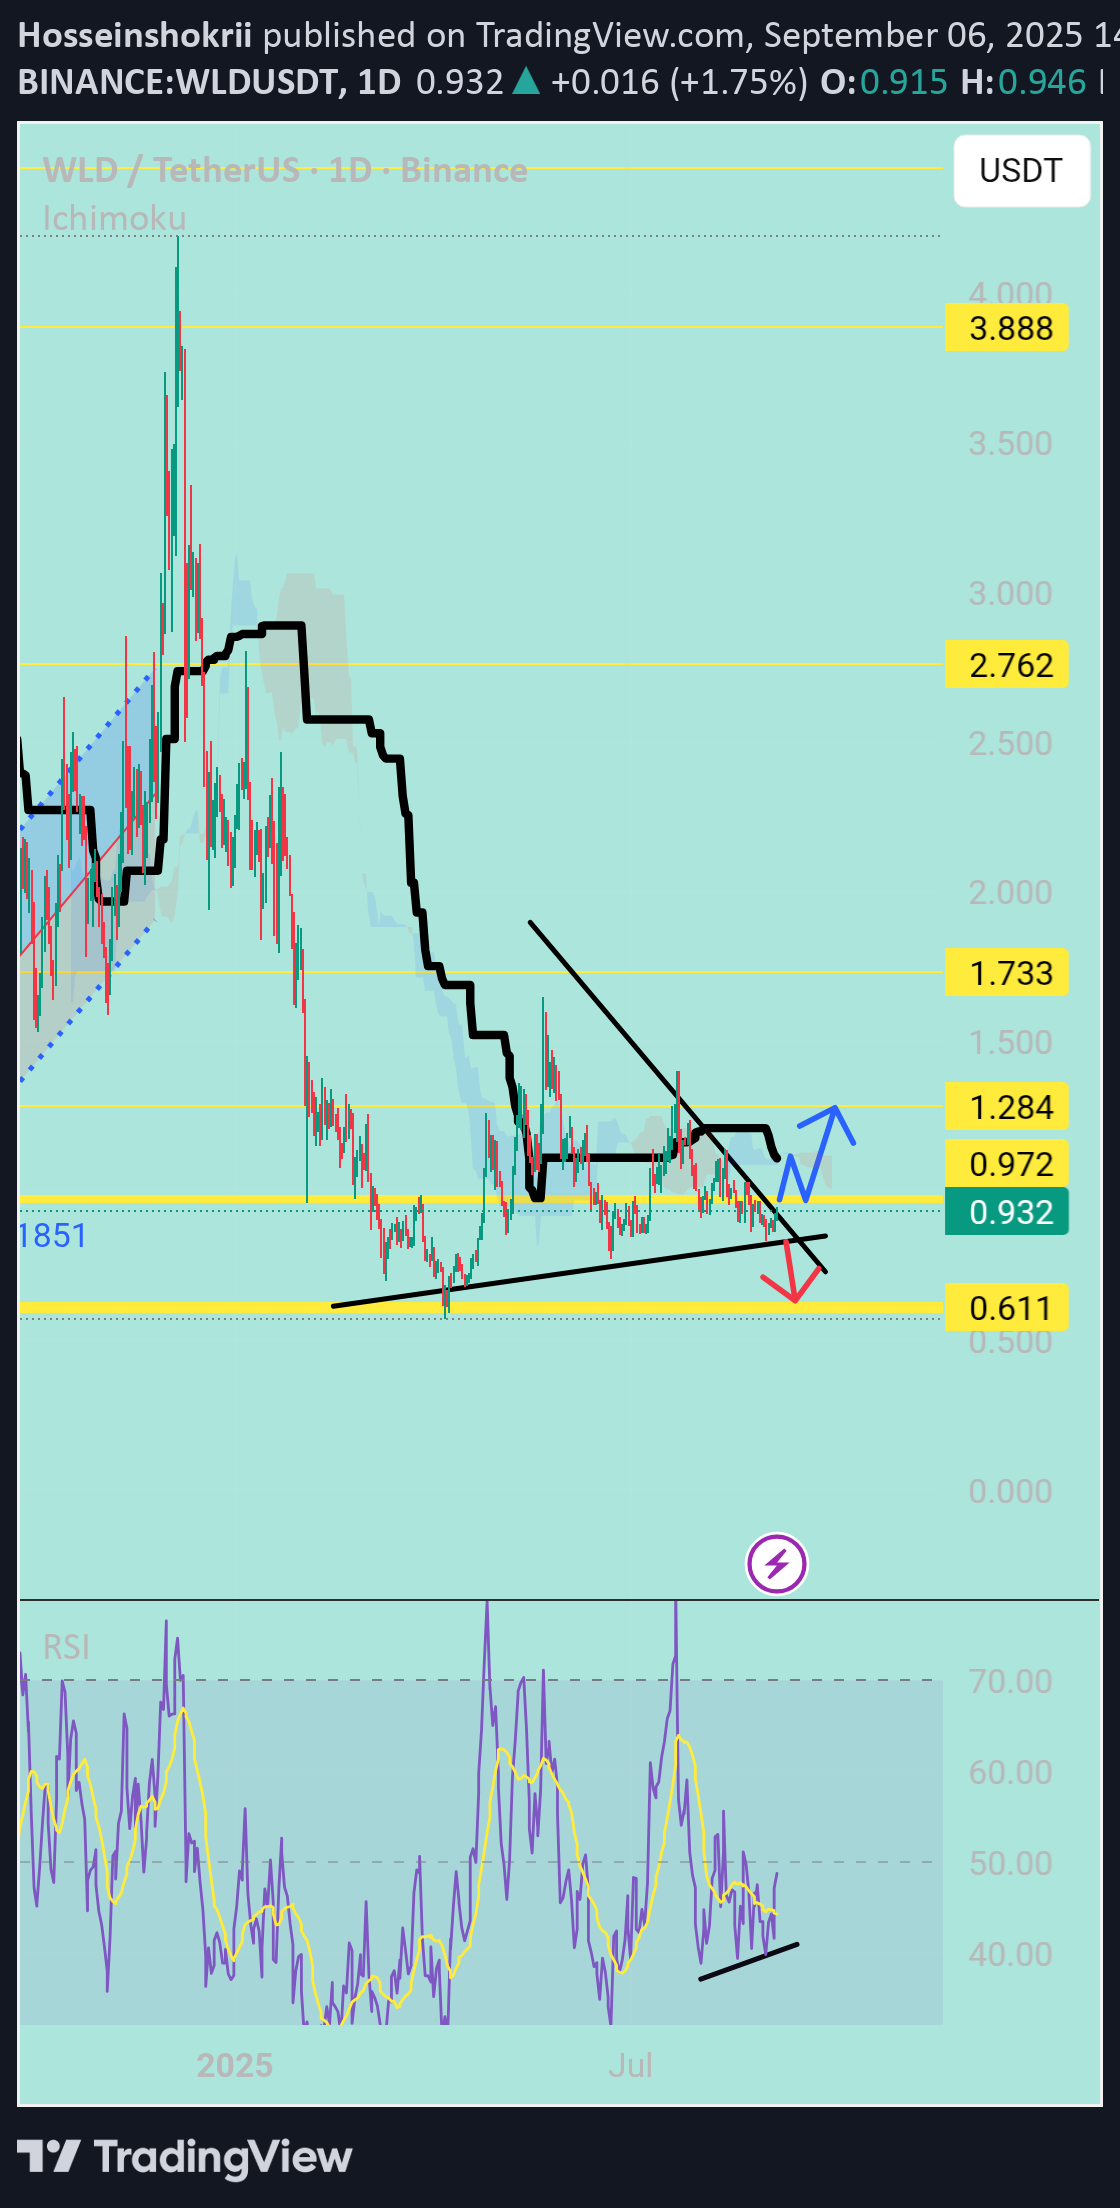
Hi snipers. On the daily time frame, after a sharp price decline in the past months and the formation of a price bottom, the price is reversing. And we are witnessing the formation of a descending triangle, which according to statistics has a 40% probability of an upward breakout and a 60% probability of a downward breakout. But here we are also witnessing a divergence. The price is moving downward, the RSI is moving upward, which is a good sign for a price increase. I am learning. This is not a buy or sell offer.
Hosseinshokrii
XRPusdt
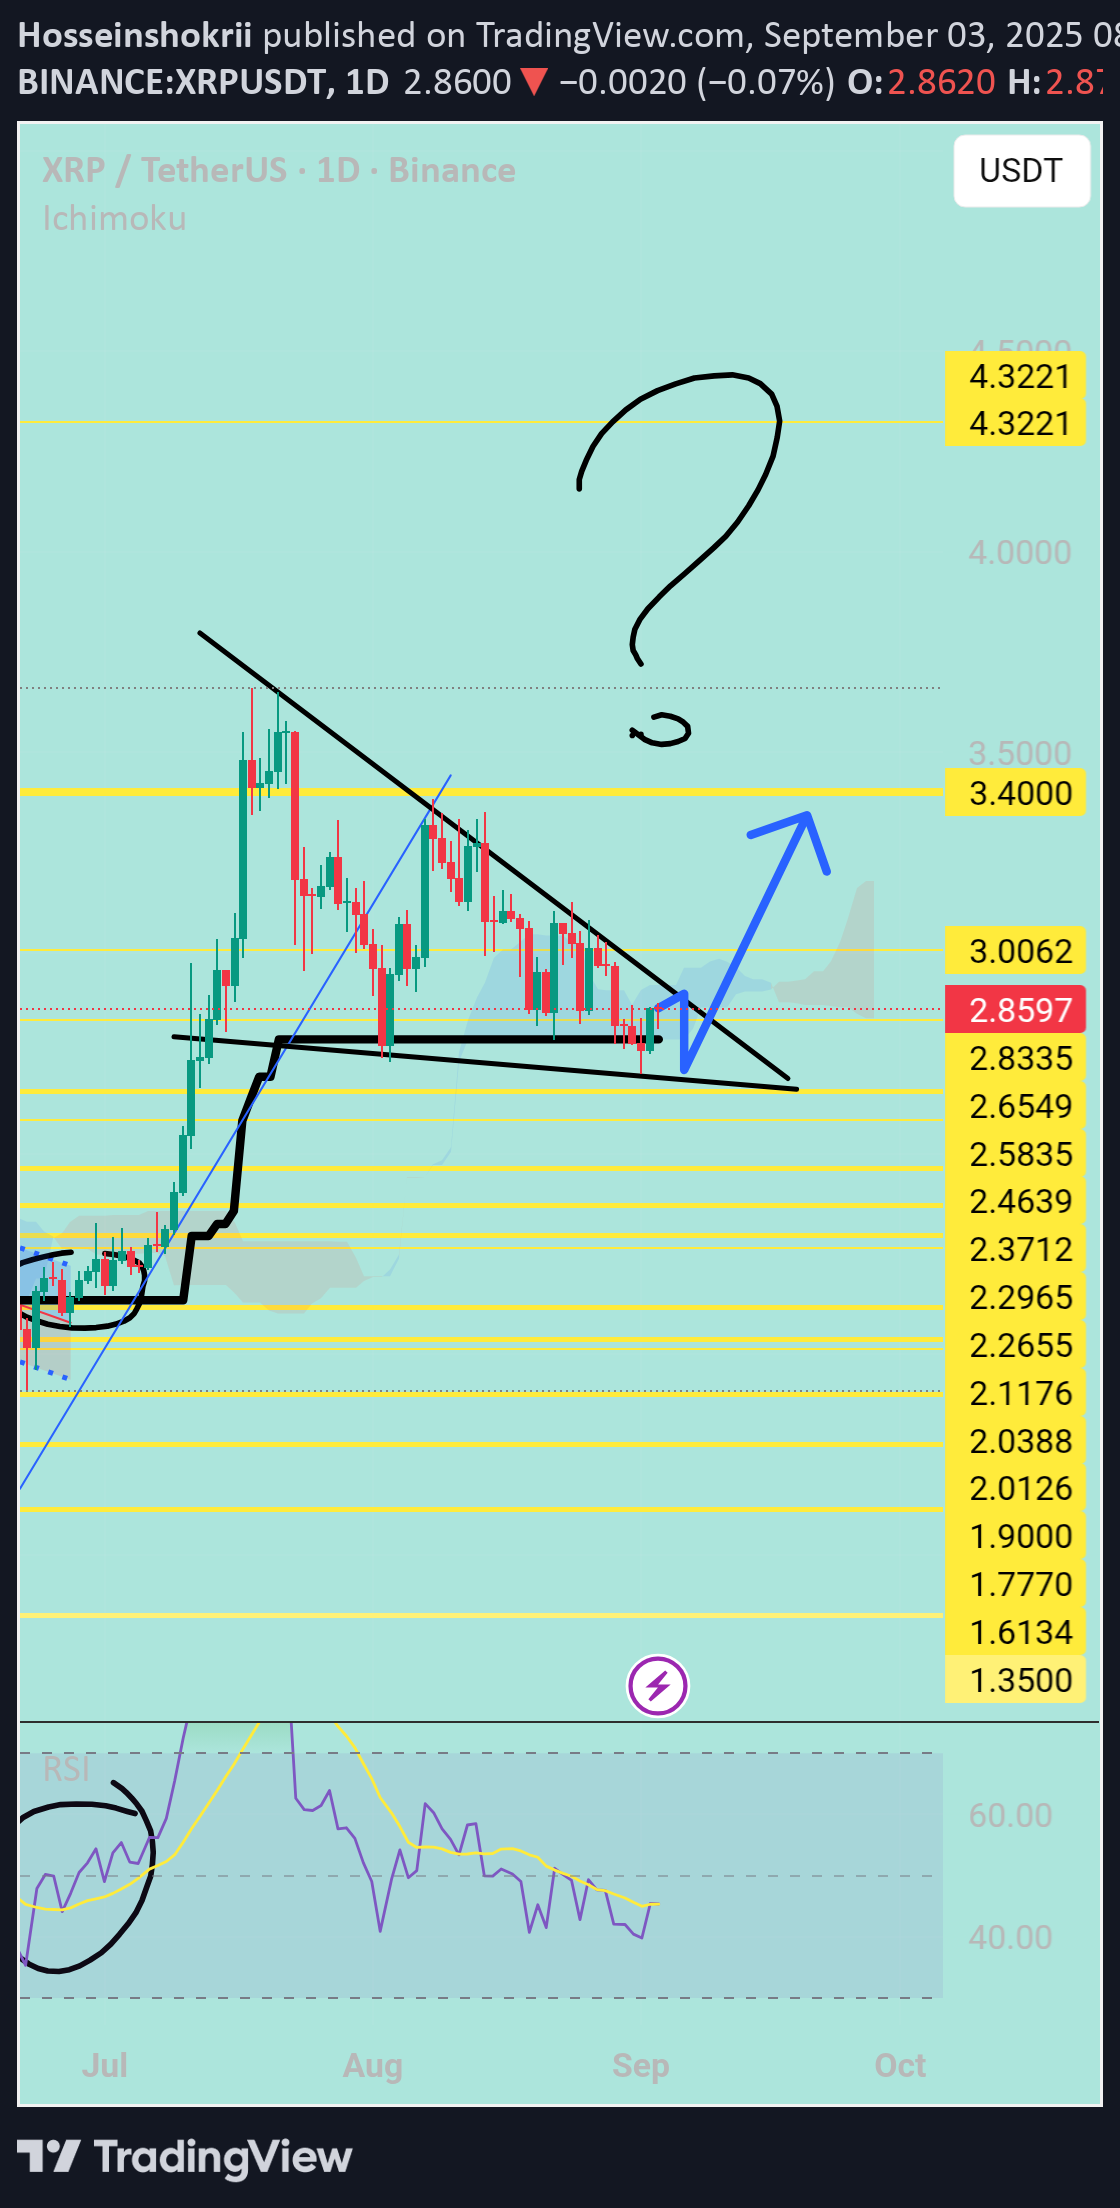
Hi snipers. On the one-day timeframe, we are witnessing the formation of a bearish pattern. If the price breaks upward, we will probably see the price reach the specified resistances. I am learning and the analysis is not a buy or sell recommendation.
Hosseinshokrii
Suiusdt
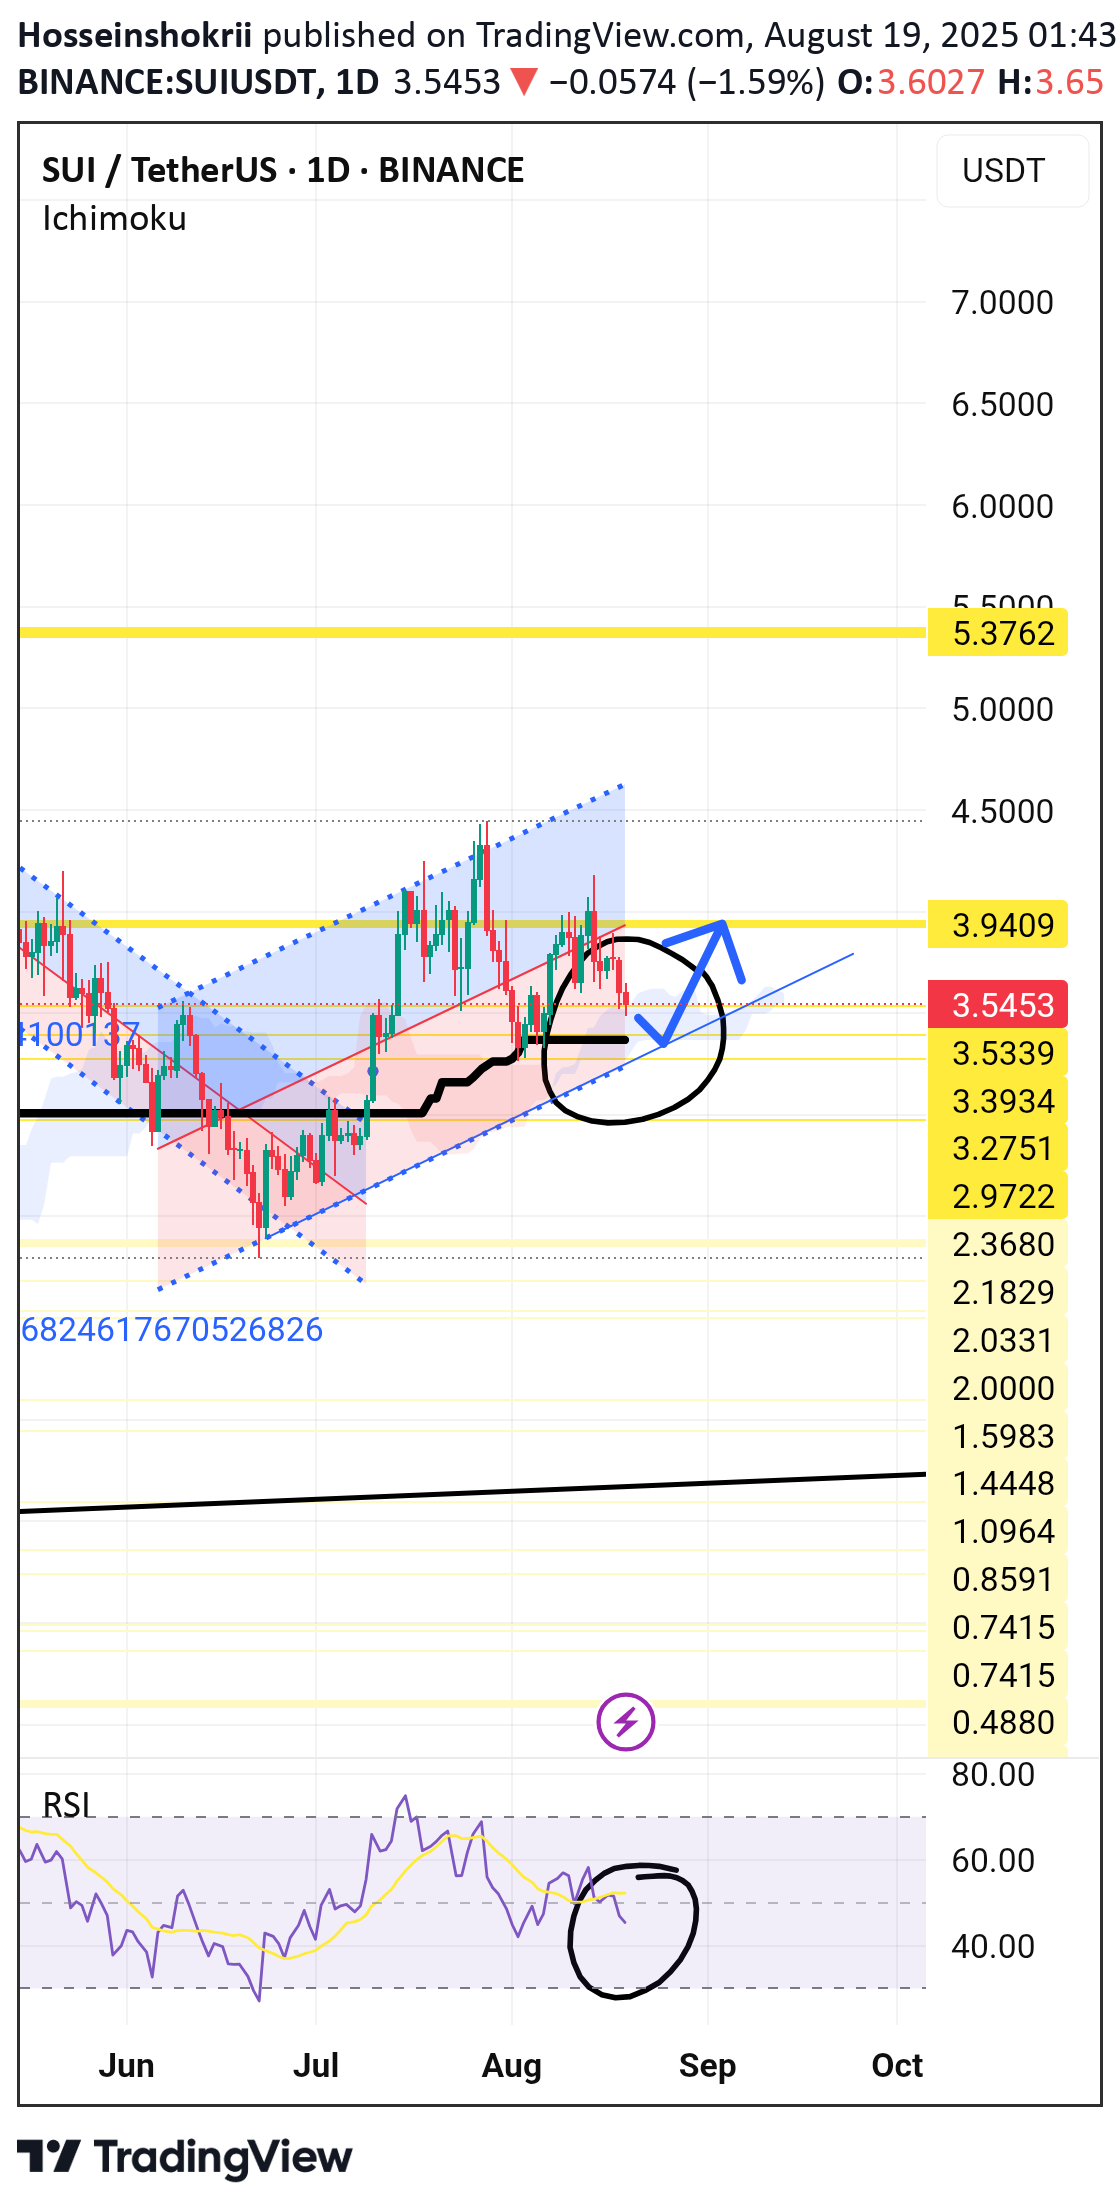
Hi snipers. Golden point. On the one-day time frame, the price is approaching the bottom of the channel, where the 103-day moving average line is in the same area as the bottom of the channel. The moving average usually plays the role of strong support at this point, so the price is expected to have a strong growth.
Hosseinshokrii
Solusdt

Hi snipers. On the one-day timeframe, the price is fluctuating in an ascending channel. It has now reached the middle line of the channel and the 103-day moving average support line is below it, which will help the price to move up again and reach the channel ceiling. If this support is broken, the price is likely to fall to the channel floor. This analysis is just a possibility. It is not a trading recommendation.
Disclaimer
Any content and materials included in Sahmeto's website and official communication channels are a compilation of personal opinions and analyses and are not binding. They do not constitute any recommendation for buying, selling, entering or exiting the stock market and cryptocurrency market. Also, all news and analyses included in the website and channels are merely republished information from official and unofficial domestic and foreign sources, and it is obvious that users of the said content are responsible for following up and ensuring the authenticity and accuracy of the materials. Therefore, while disclaiming responsibility, it is declared that the responsibility for any decision-making, action, and potential profit and loss in the capital market and cryptocurrency market lies with the trader.