Technical analysis by Hosseinshokrii about Symbol BTC: Buy recommendation (12/13/2025)

Hosseinshokrii
تحلیل بیت کوین: مثلث صعودی مرموز و راز هدف قیمتی بعدی!
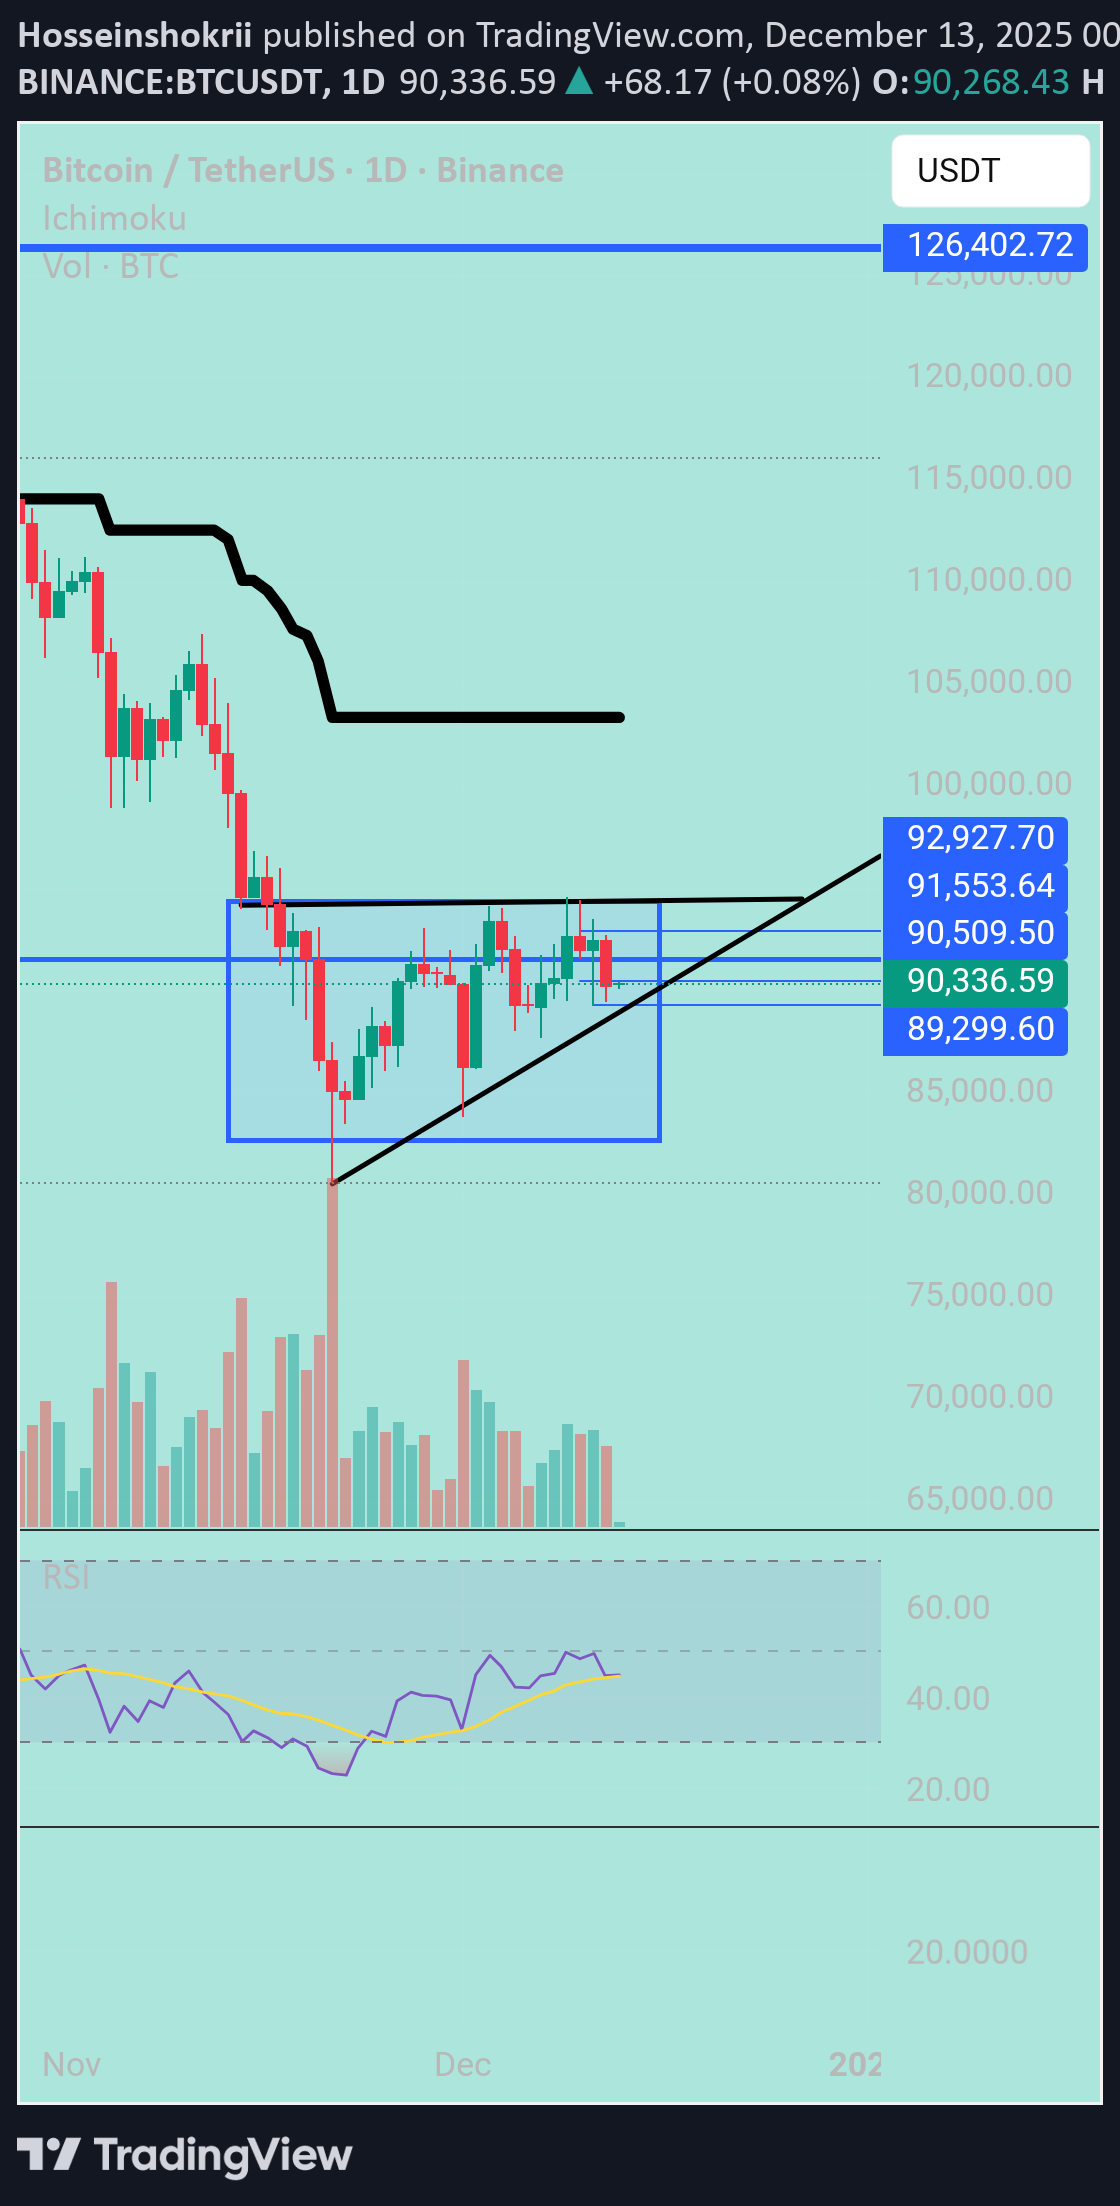
Hi snipers. Bitcoin fell from its historic high of $126,199 in the weekly timeframe and reached a low of $80,600 in 7 weeks, although it only touched this price with a shadow. During this period, the decline was on increasing volume, after which it stopped and there was a weekly bullish candle with medium volume and two doji candles. If we look at these 3 candles on the daily timeframe, we see a fixed high of 94,500 and increasing lows, which is an ascending triangle pattern. Of course! Here's the English translation of the full explanation I gave earlier: --- This pattern is most likely an **Ascending Triangle**, which typically signals a continuation of an uptrend and a potential **bullish breakout**. #### 📐 What Is an Ascending Triangle? An ascending triangle forms when: - The **resistance level (ceiling)** remains flat (in this case, at 94,000). - The **support levels (floors)** are gradually rising, indicating increasing buying pressure. This pattern often appears in uptrends and suggests that **buyers are gaining strength** and may soon push the price above the resistance. #### 📈 Key Insights from This Pattern - **Breakout Confirmation**: A valid breakout occurs when the price closes above 94,000 with strong volume. - **Price Target**: The height of the triangle (difference between the first low and the resistance) is often projected upward from the breakout point. For example, if the first low was 85,000, the target could be around 103,000. - **Beware of False Breakouts**: If the breakout happens with low volume or lacks follow-through, the price might fall back into the triangle. #### ⚠️ Cautions and Considerations - **No pattern is 100% reliable**. It's best to use additional tools like RSI, MACD, or moving averages for confirmation. - **Risk management is crucial**. Setting a stop-loss just below the last higher low can help limit potential losses. Would you like a chart of this pattern or a more detailed analysis of Bitcoin’s current setup?