
FlorinCharts
@t_FlorinCharts

What symbols does the trader recommend buying?
Purchase History
پیام های تریدر
Filter
Bitcoin: Bullish Bump‑and‑Run Pattern
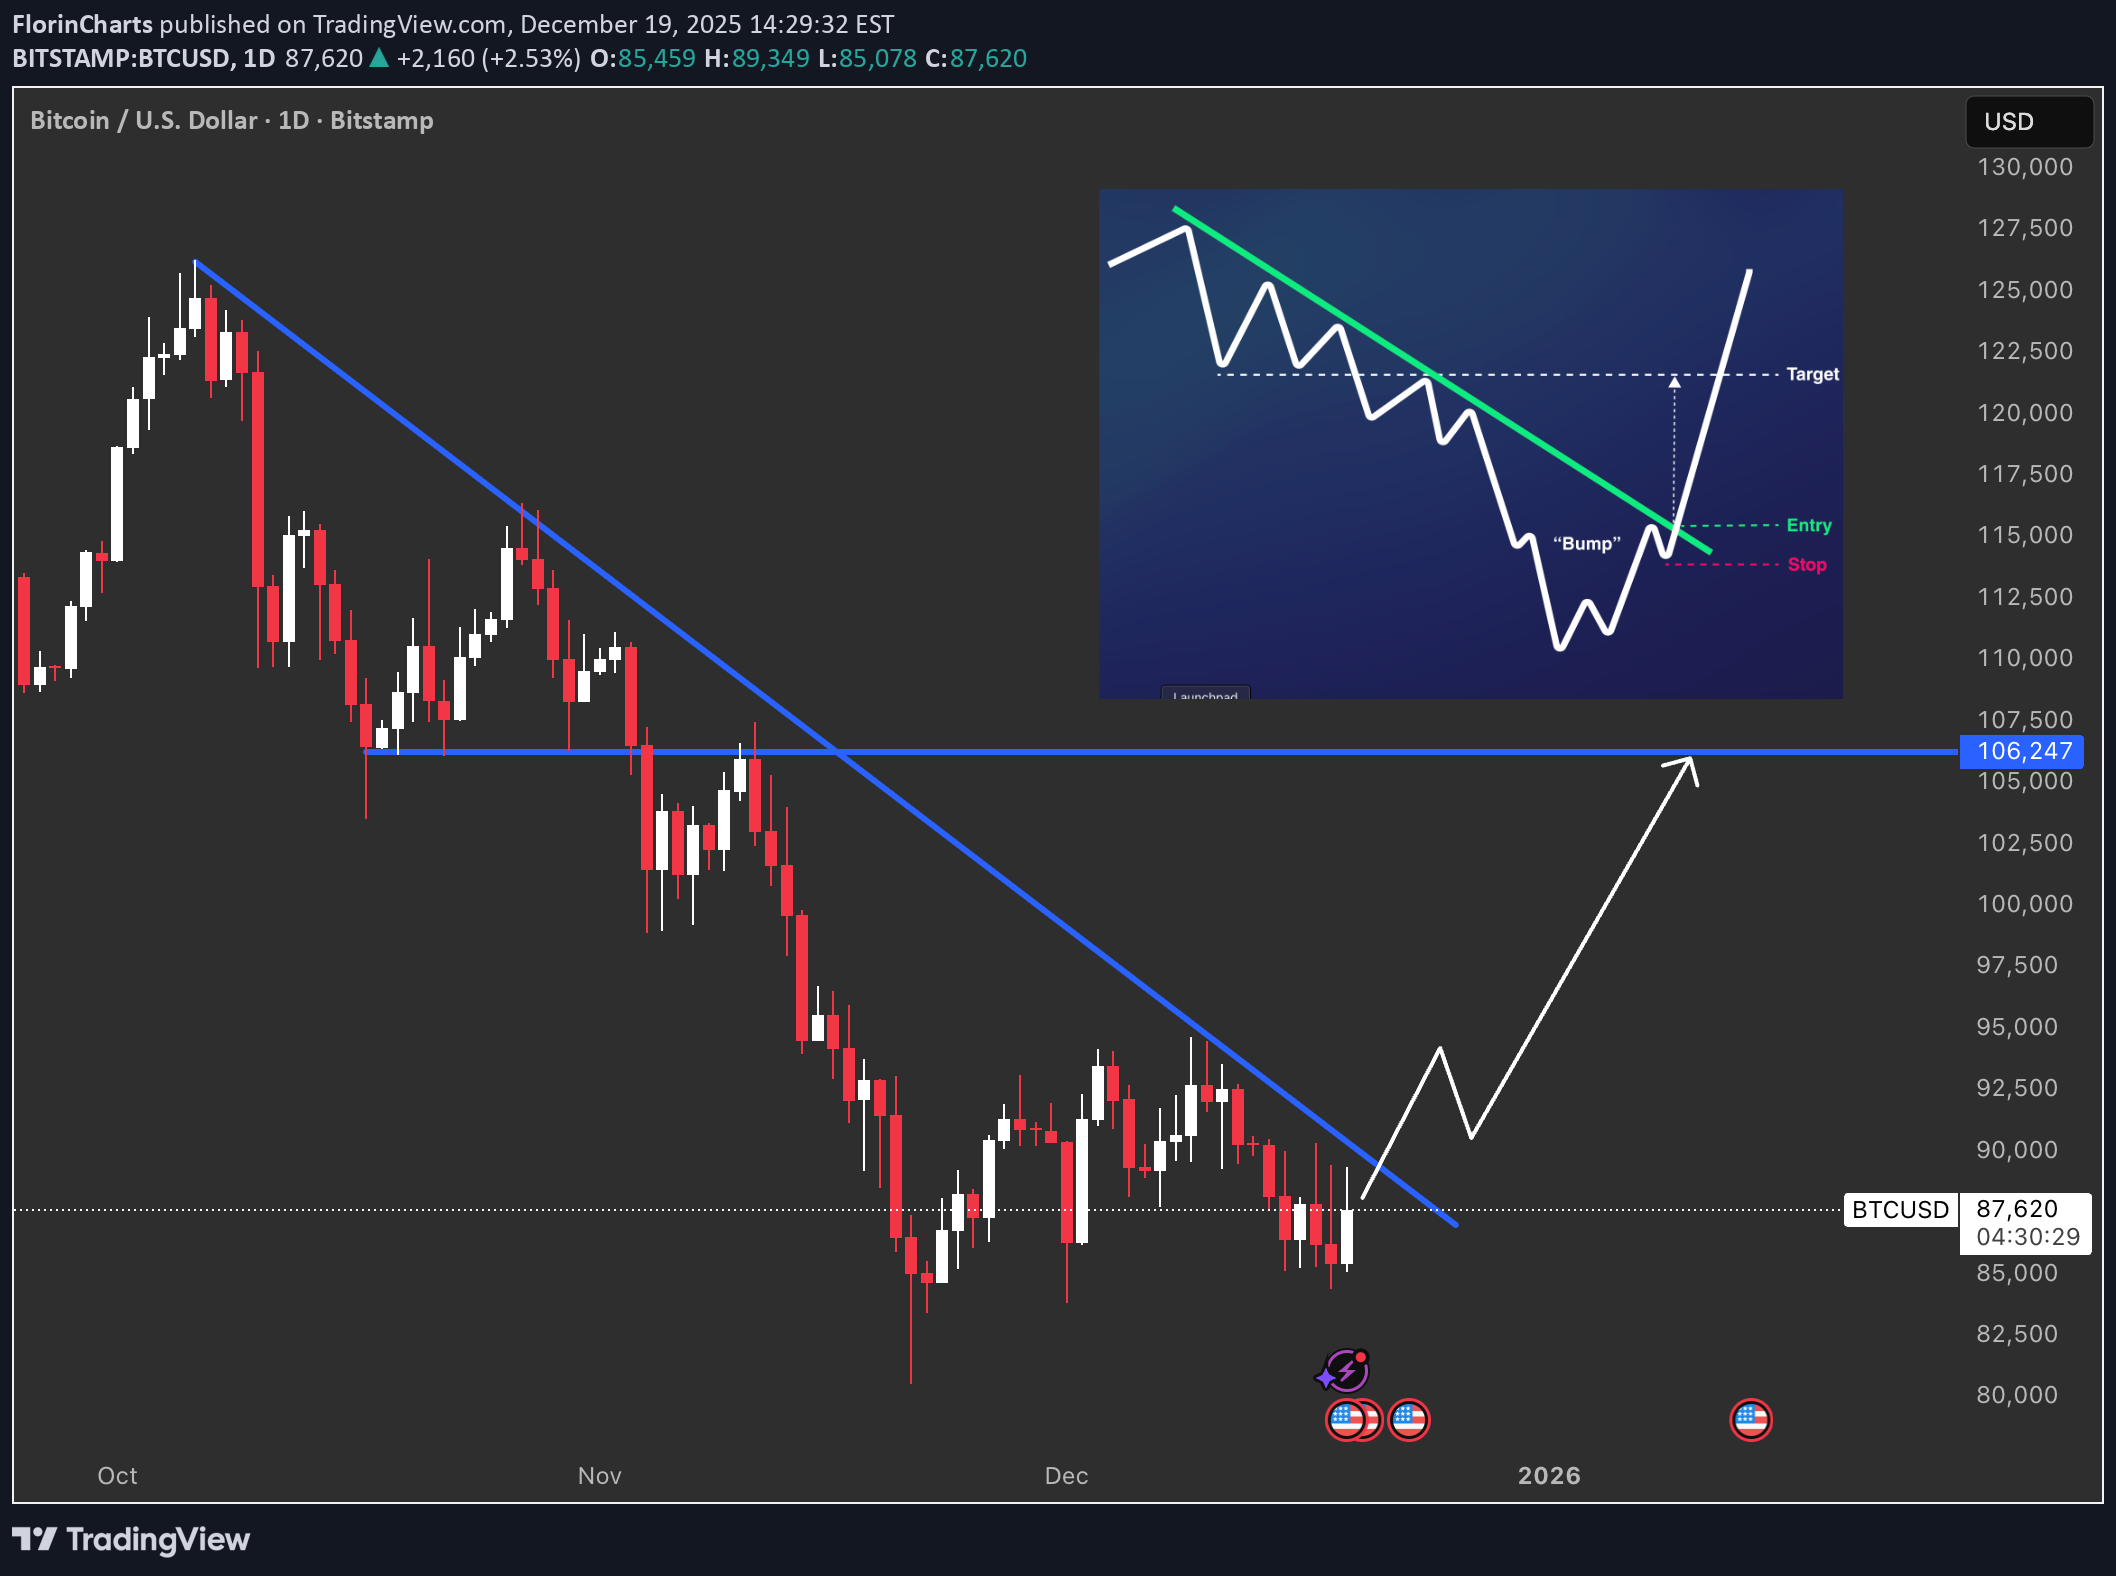
BTC is grinding down a clear descending trendline, with a possible bump‑and‑run reversal pattern. If price “bumps” below the line and then snaps back through it, the pattern calls for a strong run higher toward the 106k zone. Pattern in simple words 🧠 Lead‑in: Controlled downtrend along the trending line. Bump: Final washout + fake breakdown, trapping late bears. Run: Sharp reclaim of the trendline, then momentum push toward prior resistance What I’m watching 👀 Break and hold above the trendline = bullish trigger. First target: prior resistance area near 106k. Idea is invalidated if BTC loses the recent lows and stays under the trendline again.
When Fear Meets Fundamentals: 5 Lessons for Crypto Traders
1. Price controls your feelings, not the other way around 📉🧠 When the chart bleeds, everyone suddenly feels “certain” the future is bad. That’s just emotion chasing price. The fix: write your plan (entry, invalidation, size) *before* volatility hits, and follow that instead of your mood. 2. Stop worshipping one narrative 📊🧩 Halving cycles, “4‑year patterns,” single catalysts, none of them fully explain today’s market. Crypto is now tied to macro, flows, leverage, and tech themes all at once, so treat narratives as tools, not as gospel. 3. The Fed is the real boss 🏦⚙️ Unclear Fed policy and politics keep all risk assets on edge, so good news barely helps and bad news hits extra hard. If you trade crypto, you are indirectly trading interest‑rate expectations and liquidity too 4. Most experiments will die (and that’s normal) 💀🚀 DATs, tokens, new structures, think of them like IPOs or startups: the majority fail, a few become monsters. Don’t read every blow‑up as “crypto is dead”; focus on the handful of scaled, well‑run players that actually survive the shakeout. 5. Don’t use yesterday’s logic on tomorrow’s platforms 📱🔗 Saying “L2s and stablecoins don’t help Ethereum because fees are low” is like saying “mobile won’t help Facebook because it’s free.” Big platforms often let usage explode first and only later change the business model to capture value, your edge comes from seeing that shift *before* the old‑regime experts do.
LTC: Breakout Before Altcoin Season
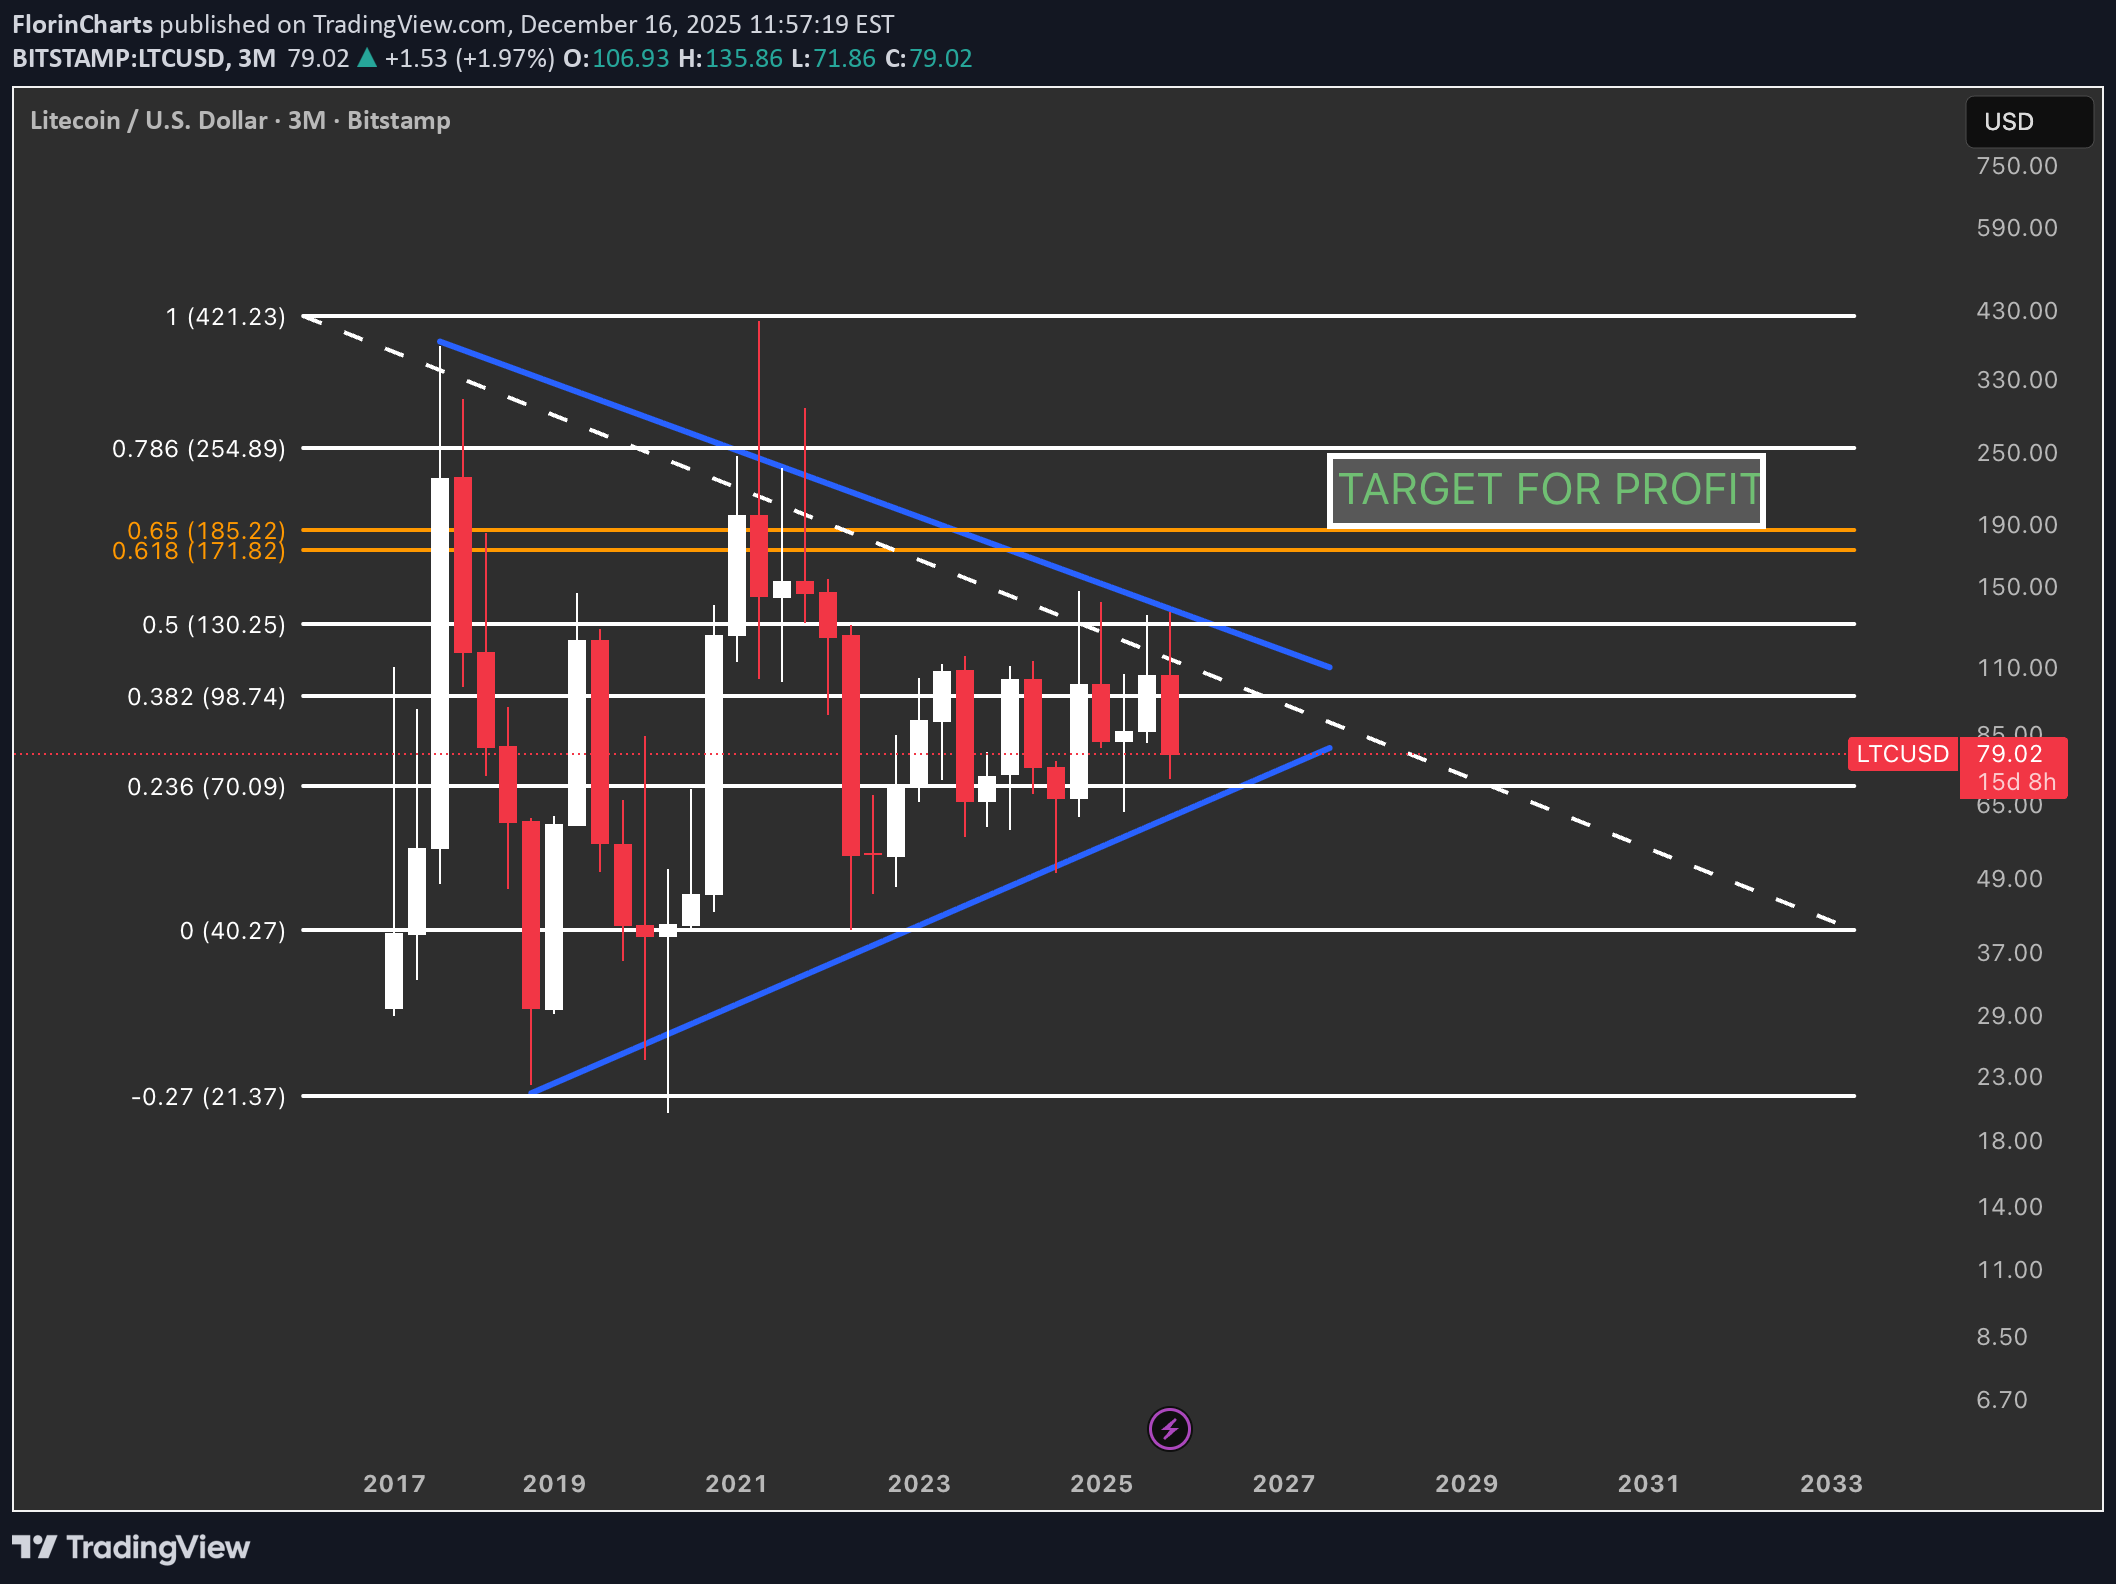
Price has been moving inside a large 3‑month symmetrical triangle, with lower highs from the 2017 peak and higher lows since the 2018 bottom. The current candle is compressing between the support and resistance trendlines, suggesting a larger move is getting closer. A confirmed breakout above the triangle resistance and the 0.5–0.618 Fib would open the way toward the marked profit zone in the 0.65–0.786 area (~185–255 USD), where previous supply sits. As long as the higher‑low structure holds, the bias remains bullish; a clean weekly/3M close back below the triangle support would invalidate this idea and shift the focus back toward the 40–50 USD zone. Litecoin often behaves as a “mid‑cap beta play” between Bitcoin and smaller alts: when BTC stabilizes and capital starts rotating out along the risk curve, LTC is one of the first large caps to wake up. A strong, high‑timeframe breakout on Litecoin can therefore be an early sign that market participants are ready to take more risk, paving the way for a broader altcoin season.
This Week’s US Data (15-20 Dec): Stocks & Bitcoin
1. Jobs report (NFP, unemployment, wages) 👷♂️ Very good / hawkish for Fed NFP: > 250k new jobs. Unemployment rate: ≤ 4.0%. Average hourly earnings YoY: ≥ 4.0%. Typical read: economy still strong, “higher for longer” rates; can pressure stocks short term and is usually negative for BTC as real yields/UST bid up. Clearly bad / dovish for Fed NFP: < 100k new jobs, or negative revision cluster. Unemployment rate: ≥ 4.4–4.5%. Wage growth YoY: ≤ 3.5%. Typical read: cooling labor market, more cuts priced; generally supportive for equities and often bullish BTC via liquidity/risk-on narrative. 2. Retail sales 🛒 Good demand signal Headline/control retail sales: ≥ +0.5% MoM and broad-based. Read: consumer still spending, growth backdrop OK; modestly positive for cyclicals but can keep the Fed cautious, mixed for BTC. Weak demand signal Headline/control retail sales: ≤ 0.0% MoM or negative, especially if previous month revised down. Read: demand softening, recession whispers; increases cut odds, usually net bullish indices if not catastrophic, mildly bullish BTC. 3. CPI / core CPI 🔥 Too hot Headline CPI YoY: > 3.0–3.2%. Core CPI YoY: > 3.0% or core monthly ≥ 0.3–0.4%. Read: disinflation stalling; markets re‑price fewer cuts, UST yields pop, typically negative for high‑beta stocks and BTC. Comfortably cool Headline CPI YoY: ≤ 2.7–2.8%. Core CPI YoY: ≤ 2.7–2.8%, monthly core around 0.2%. Read: inflation close to “mission accomplished”; supportive for risk assets and usually good for BTC as real yields drift lower. 4. Core PCE 🔥 Hawkish Core PCE YoY: ≥ 3.0% or re‑accelerating vs prior print. Read: Fed’s preferred gauge still too high; bearish for duration, a headwind for growth stocks and BTC. Conclusion for this week: markets are set up for reaction, not trend-building, and thin year-end liquidity means moves can overshoot in both directions.
From QE to QT. Reading the Fed’s Cycle from the Chart
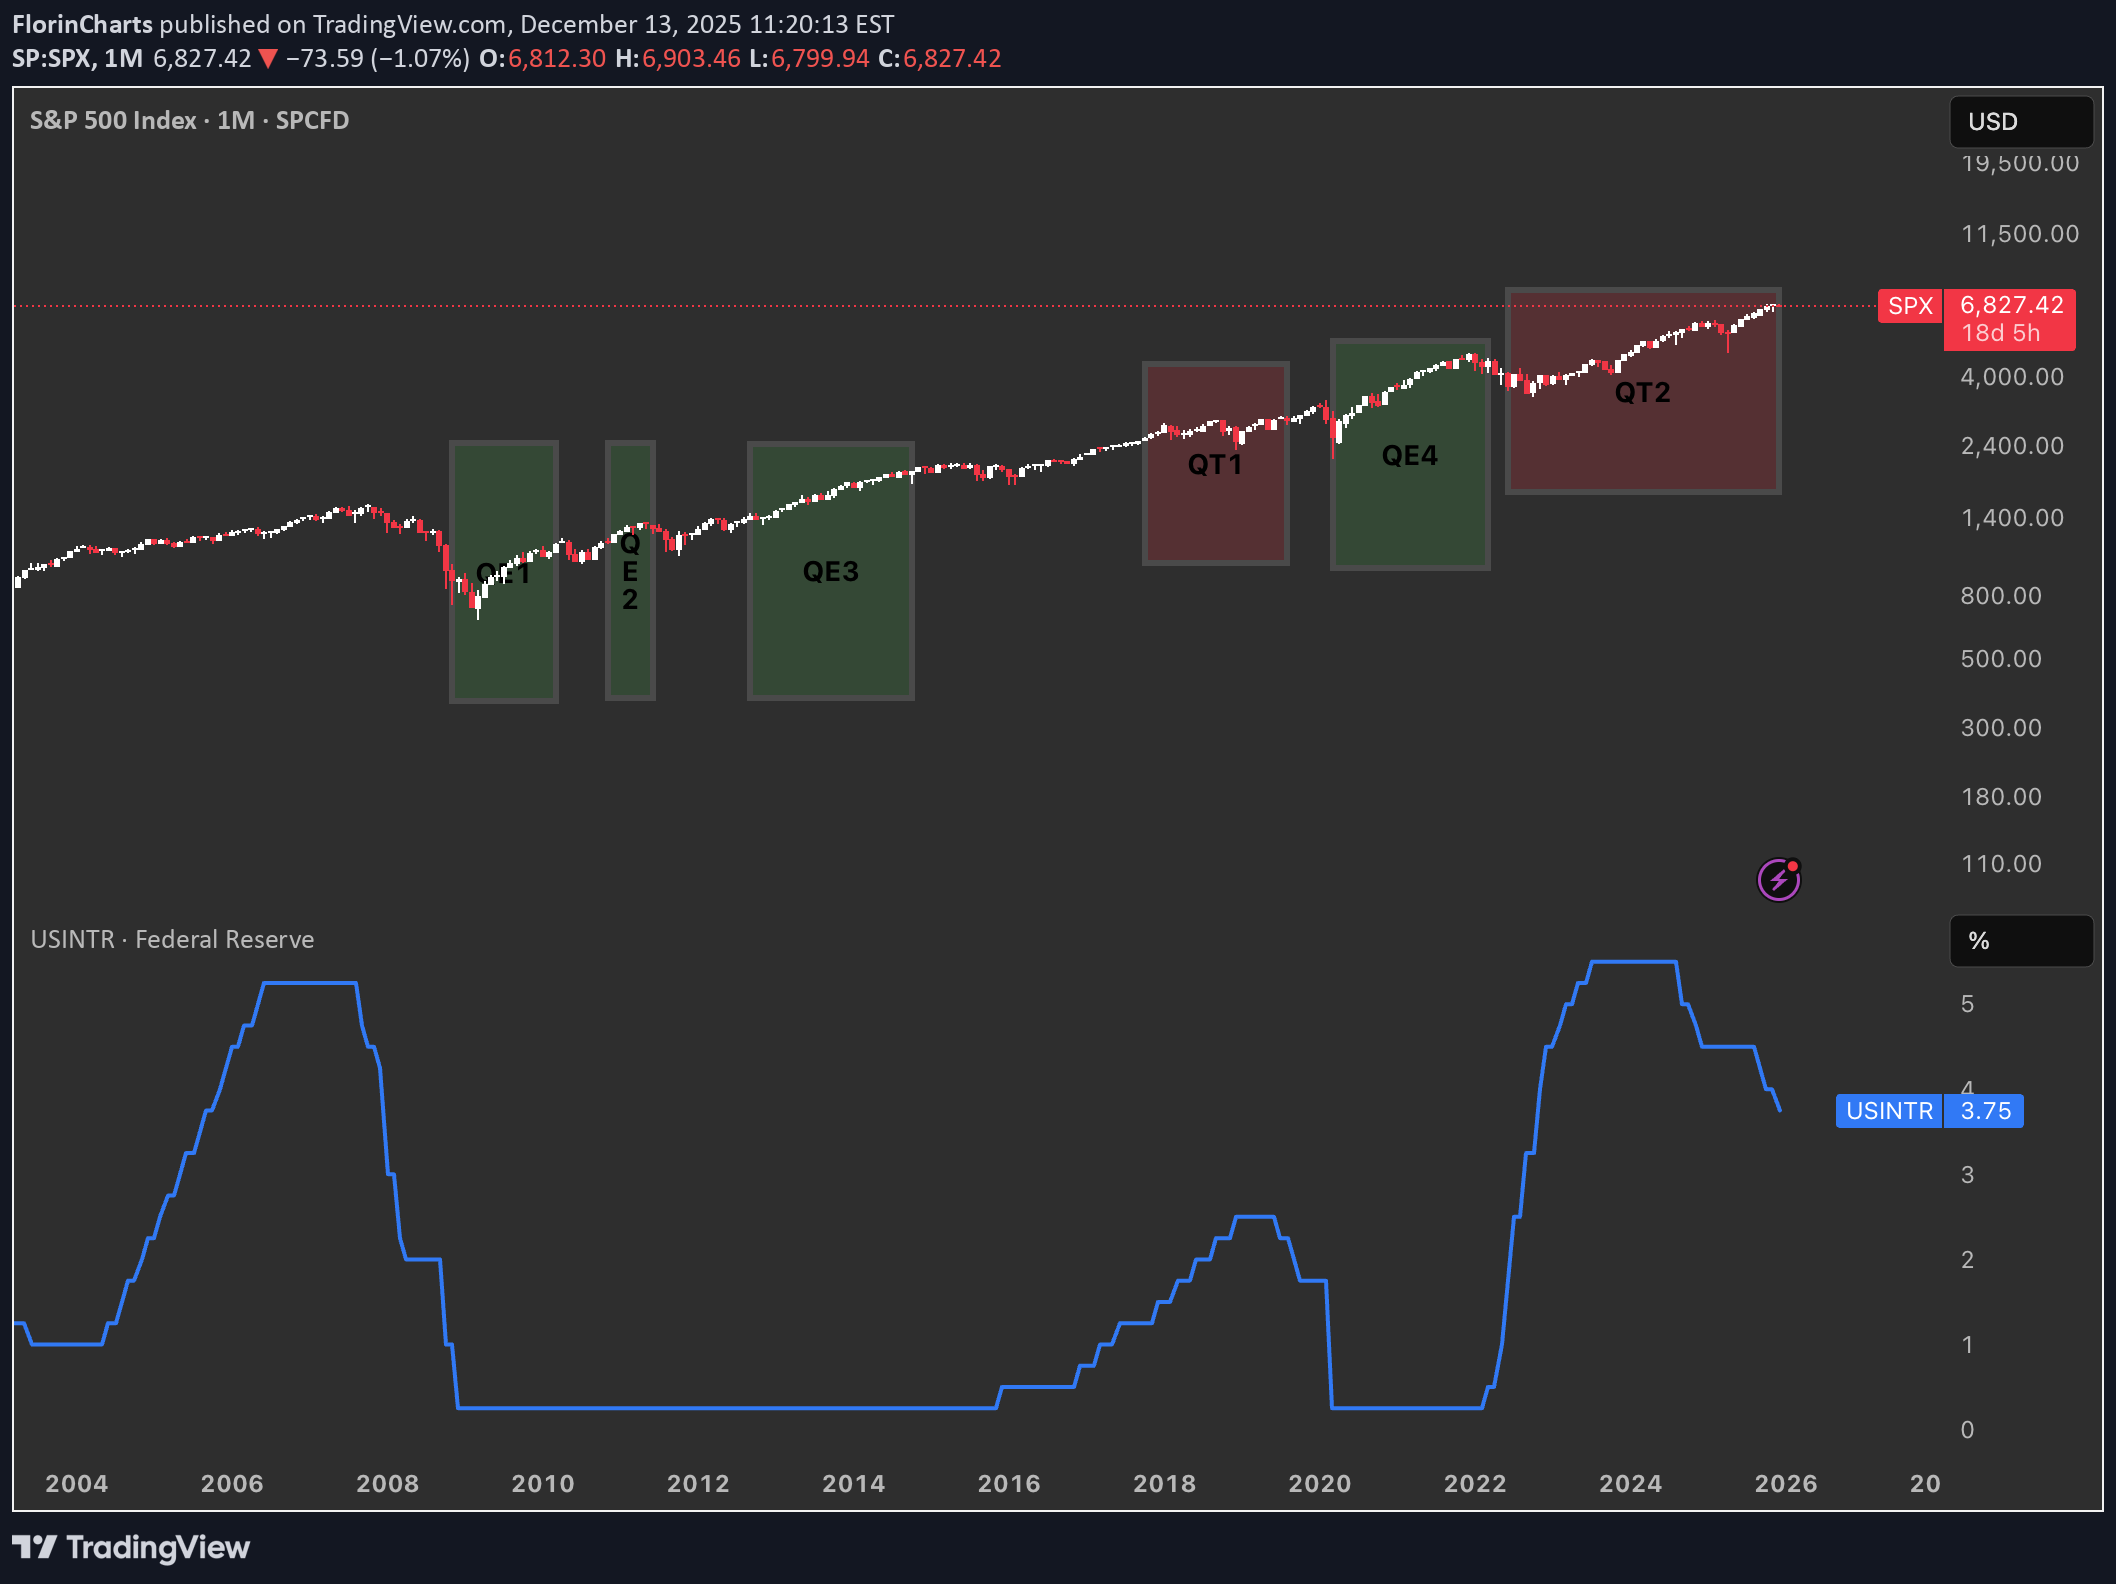
Quantitative Easing (QE) is when the Federal Reserve buys large amounts of Treasuries and mortgage‑backed securities to expand its balance sheet, inject liquidity, and push interest rates lower across the curve. Quantitative Tightening (QT) is the opposite: the Fed allows its bond holdings to roll off or sells securities, shrinking the balance sheet and tightening financial conditions. QE near zero rates Historically the Fed has only launched QE when the policy rate was pinned near zero and conventional rate cuts were basically exhausted, as in 2008–2014 and again in 2020–2022. QT at elevated rates By contrast, QT has been used only once the Fed had already hiked rates to clearly positive, “elevated” levels and wanted to normalize the balance sheet from those earlier QE waves. What ending QT in December could imply QT effectively ended around 1 December, it suggests the Fed may feel comfortable pausing balance‑sheet tightening while rates are still high, opening the door later to cuts if growth or markets weaken. In that setting, the market could start to price a shift from outright restriction toward neutrality, which often coincides with more two‑sided volatility in risk assets. Echoes of the QT1 → QE3 window The period after QT1 and before QE3 saw rates come off their highs and then a major shock (COVID-18 crysis) that helped justify easier policy again. A similar path is plausible here: a “black swan” type event in the coming year could hit growth or credit, force a rapid drop in rates, and trigger a new QE‑style response that would rhyme with the QT1‑to‑QE3 sequence your chart visually captures.
رمز ارز ساده شد: ارزش بازار، حجم معاملات و نوسانات قیمت در 3 گام کلیدی
Market cap in simple terms Market cap is the total “value” of a coin: price per coin × number of coins that exist and trade freely. If a coin has 10 million coins and each is 2 dollars, the market cap is 20 million dollars. Think of market cap as the coin’s “size,” not its safety score. Big coins (large cap) are like big companies: well known, usually easier to trade, but they can still drop a lot in bad markets. Volume as the coin’s heartbeat Volume is how much of the coin is bought and sold in a time period, usually 24 hours. If a coin has 1 billion dollars traded in a day, that means a lot of people are actively buying and selling it. High volume usually means you can get in and out more easily without moving the price too much. Low volume can mean few traders, bigger spreads, and the price can jump or crash from just a few larger orders. Price trends without the drama Price trend is simply how the price has been moving over time: up, down, or sideways. In crypto, prices can move a lot in one day or one week, so very short‑term moves are often noisy and emotional. Looking at weekly or monthly charts instead of only the 5‑minute chart helps you see whether a move is just short‑term noise or part of a bigger trend. A 10% move in a week can be normal in crypto, even for big coins. Simple rules of thumb Do not assume “big market cap = safe forever”; big coins can still fall a lot. Always check volume; avoid chasing moves in very low‑volume coins where a few trades can fake the chart. Do not overreact to minute‑by‑minute moves in a 24/7 market; focus more on the bigger trend and your own risk plan.
Why This 2022 Bitcoin Fractal Might Fail
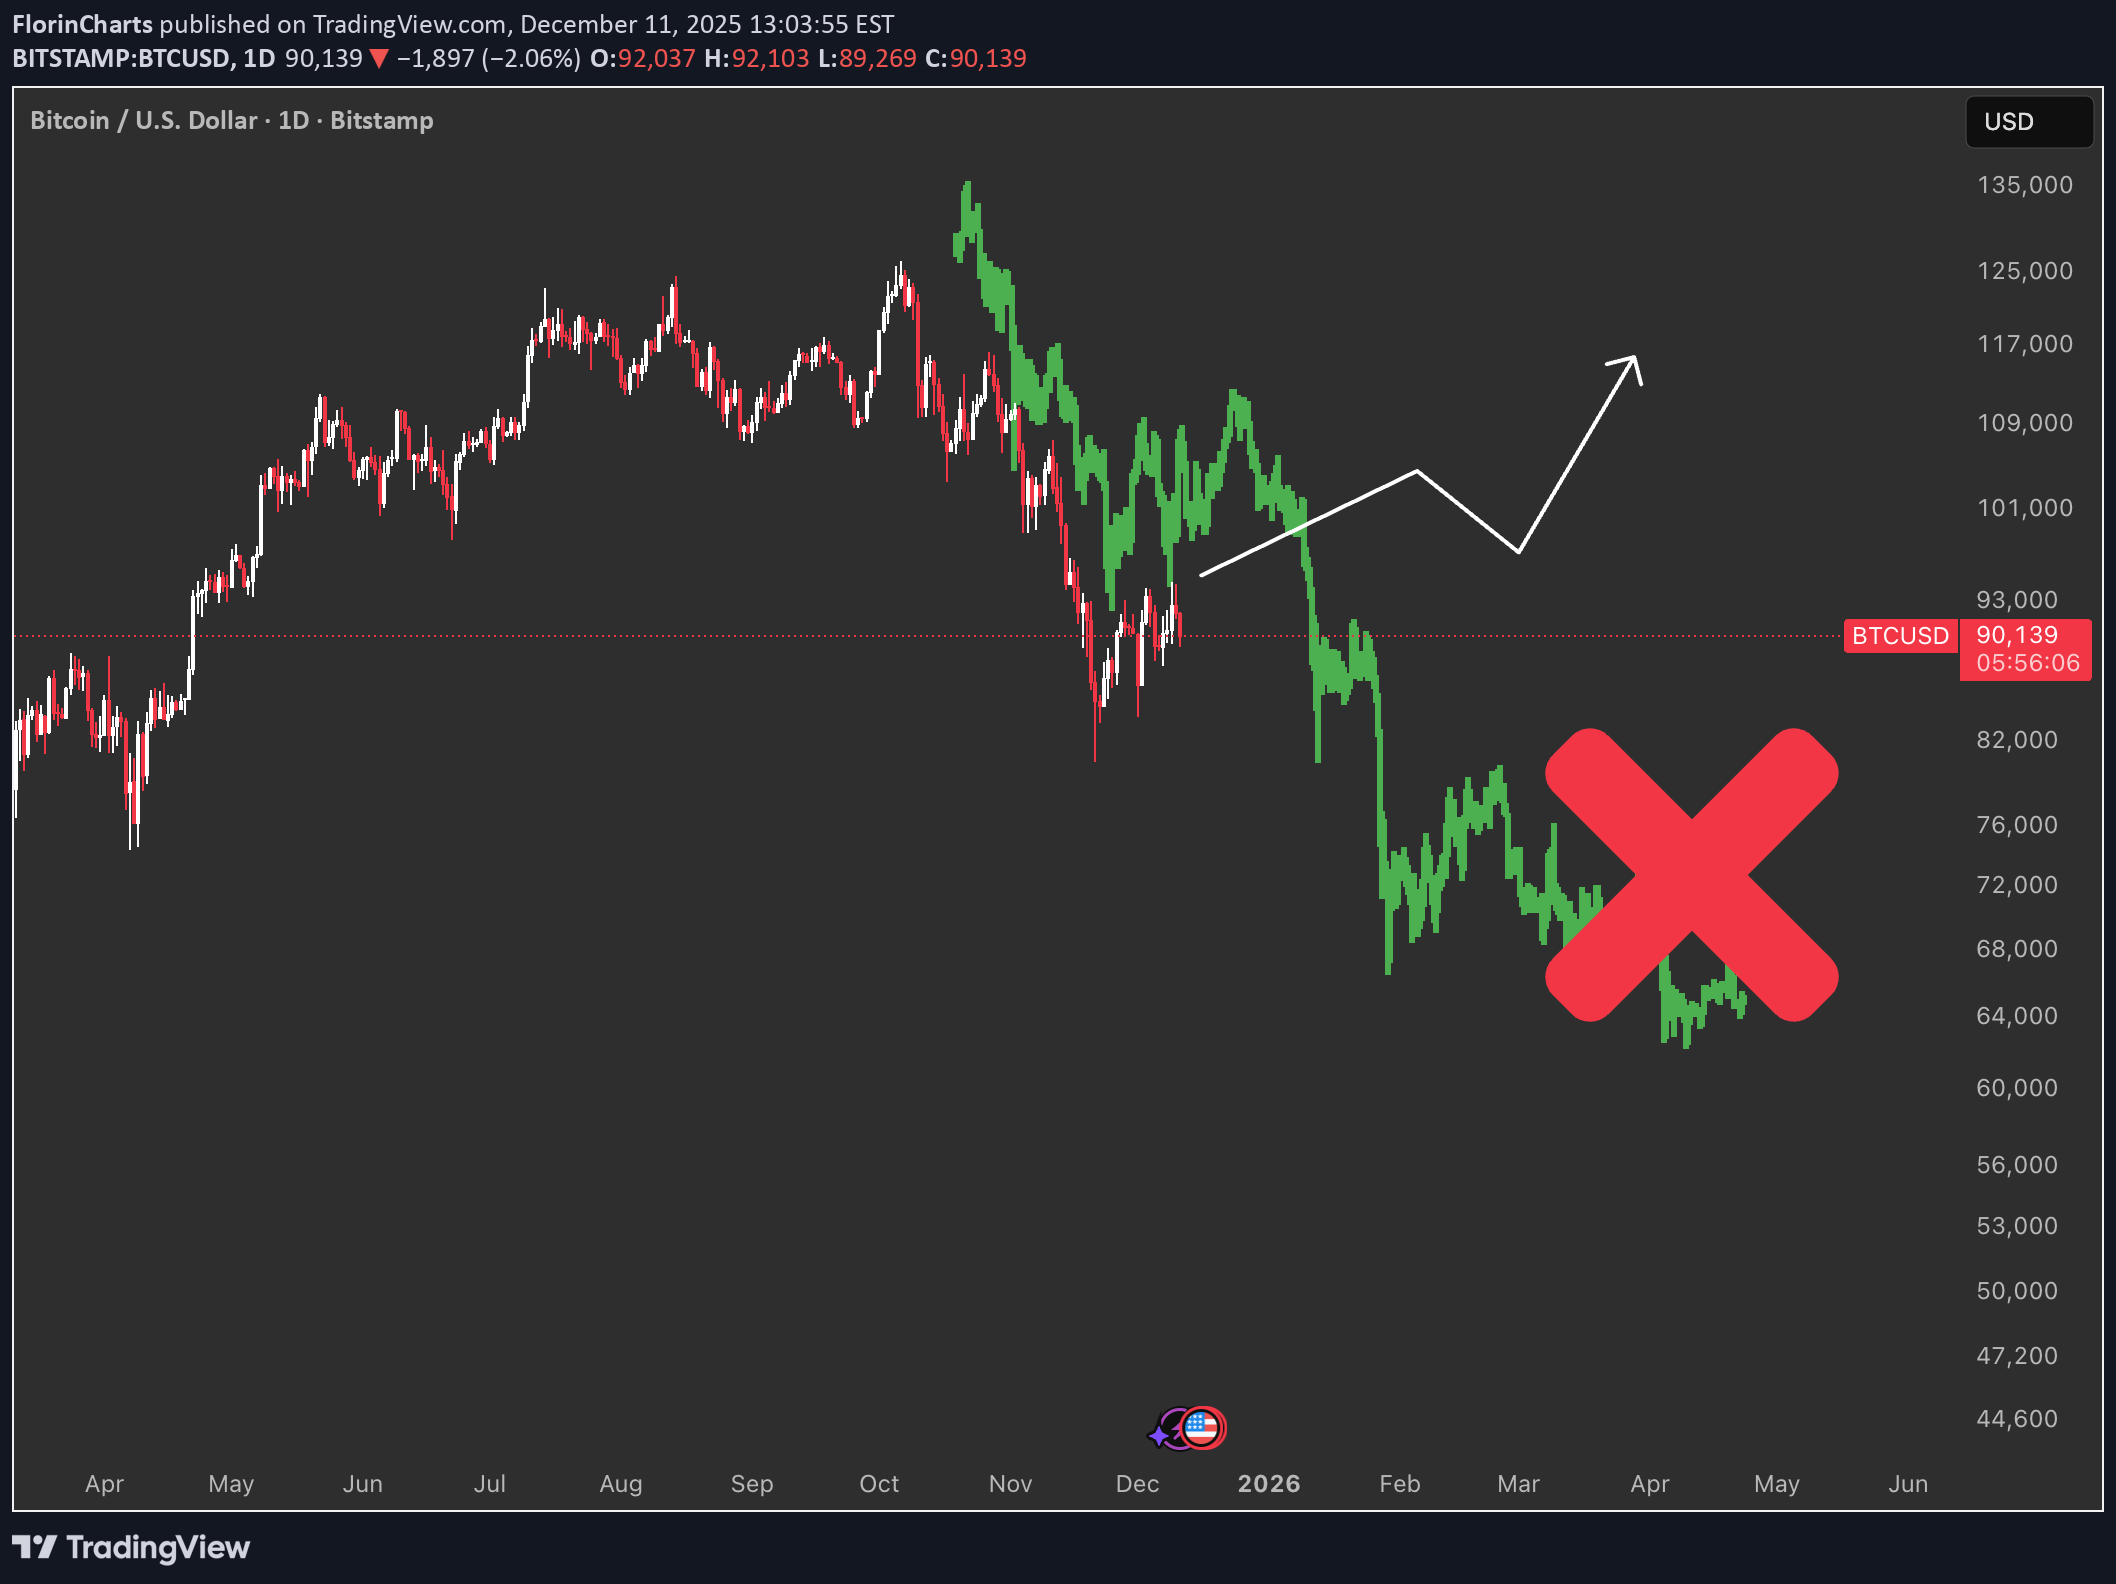
The 2022 bear‑market fractal 📉 The fractal taken from the 2022 bear market. Back then Bitcoin built a rising wedge pattern and then dropped about 60% in value from the breakdown. What “everyone” expects now 😱 Many traders now expect Bitcoin to repeat that same pattern crash. Social media, bears and even cautious bulls keep pointing to the old wedge and saying “this dump is next.” Why this time can be different 💡 Markets rarely give the majority the easy trade; when everyone leans to one side, that scenario often gets crowded and fails. If most traders are positioned for a huge crash, any sustained bid or positive macro surprise can squeeze them and send price higher instead. My view based on the chart 📊🚀 I consider an alternative path: a choppy but upward trend, driven by forced short covering and new buyers stepping in as the crash fails to appear. Key takeaway ✅ Yes, the 2022 fractal shows what could happen. But because almost everyone already sees and trades that same pattern, the higher probability play now is that Bitcoin does not repeat the exact 60% wipeout and instead grinds higher while late bears get trapped.
کاهش نرخ بهره فدرال رزرو: جرقه رالی بزرگ در بازار سهام و رمزارزها!
Fed move and backdrop 📉➡️📈 The Fed just cut rates by 25 bps. Markets now have slightly easier policy but still “careful” Fed messaging. Yield curve and small caps 🏦📊 Short‑term rates are lower, but longer‑term yields can stay higher because of how the Fed manages its bond portfolio. That steeper curve helps banks lend more and is usually good for small‑cap and cyclical stocks. QT, QE and liquidity 💧 QT is ending, so the Fed is no longer shrinking its balance sheet. For crypto traders, that feels like “QE‑lite” because liquidity is no longer being drained from the system. Easier policy plus steady liquidity tends to support risk assets like tech and crypto. ISM, Bitcoin and the cycle 🪙📈 The ISM production index is back above 50, which signals economic expansion. Bitcoin has often made big upside moves when ISM turns up and policy is easing. What’s next for traders ⚔️ - Stocks: Better setup for small caps as banks can lend more and the curve steepens. - Crypto: Macro is shifting to “risk‑on,” so Bitcoin and Ethereum could challenge or make new highs earlier than a strict four‑year cycle would suggest.
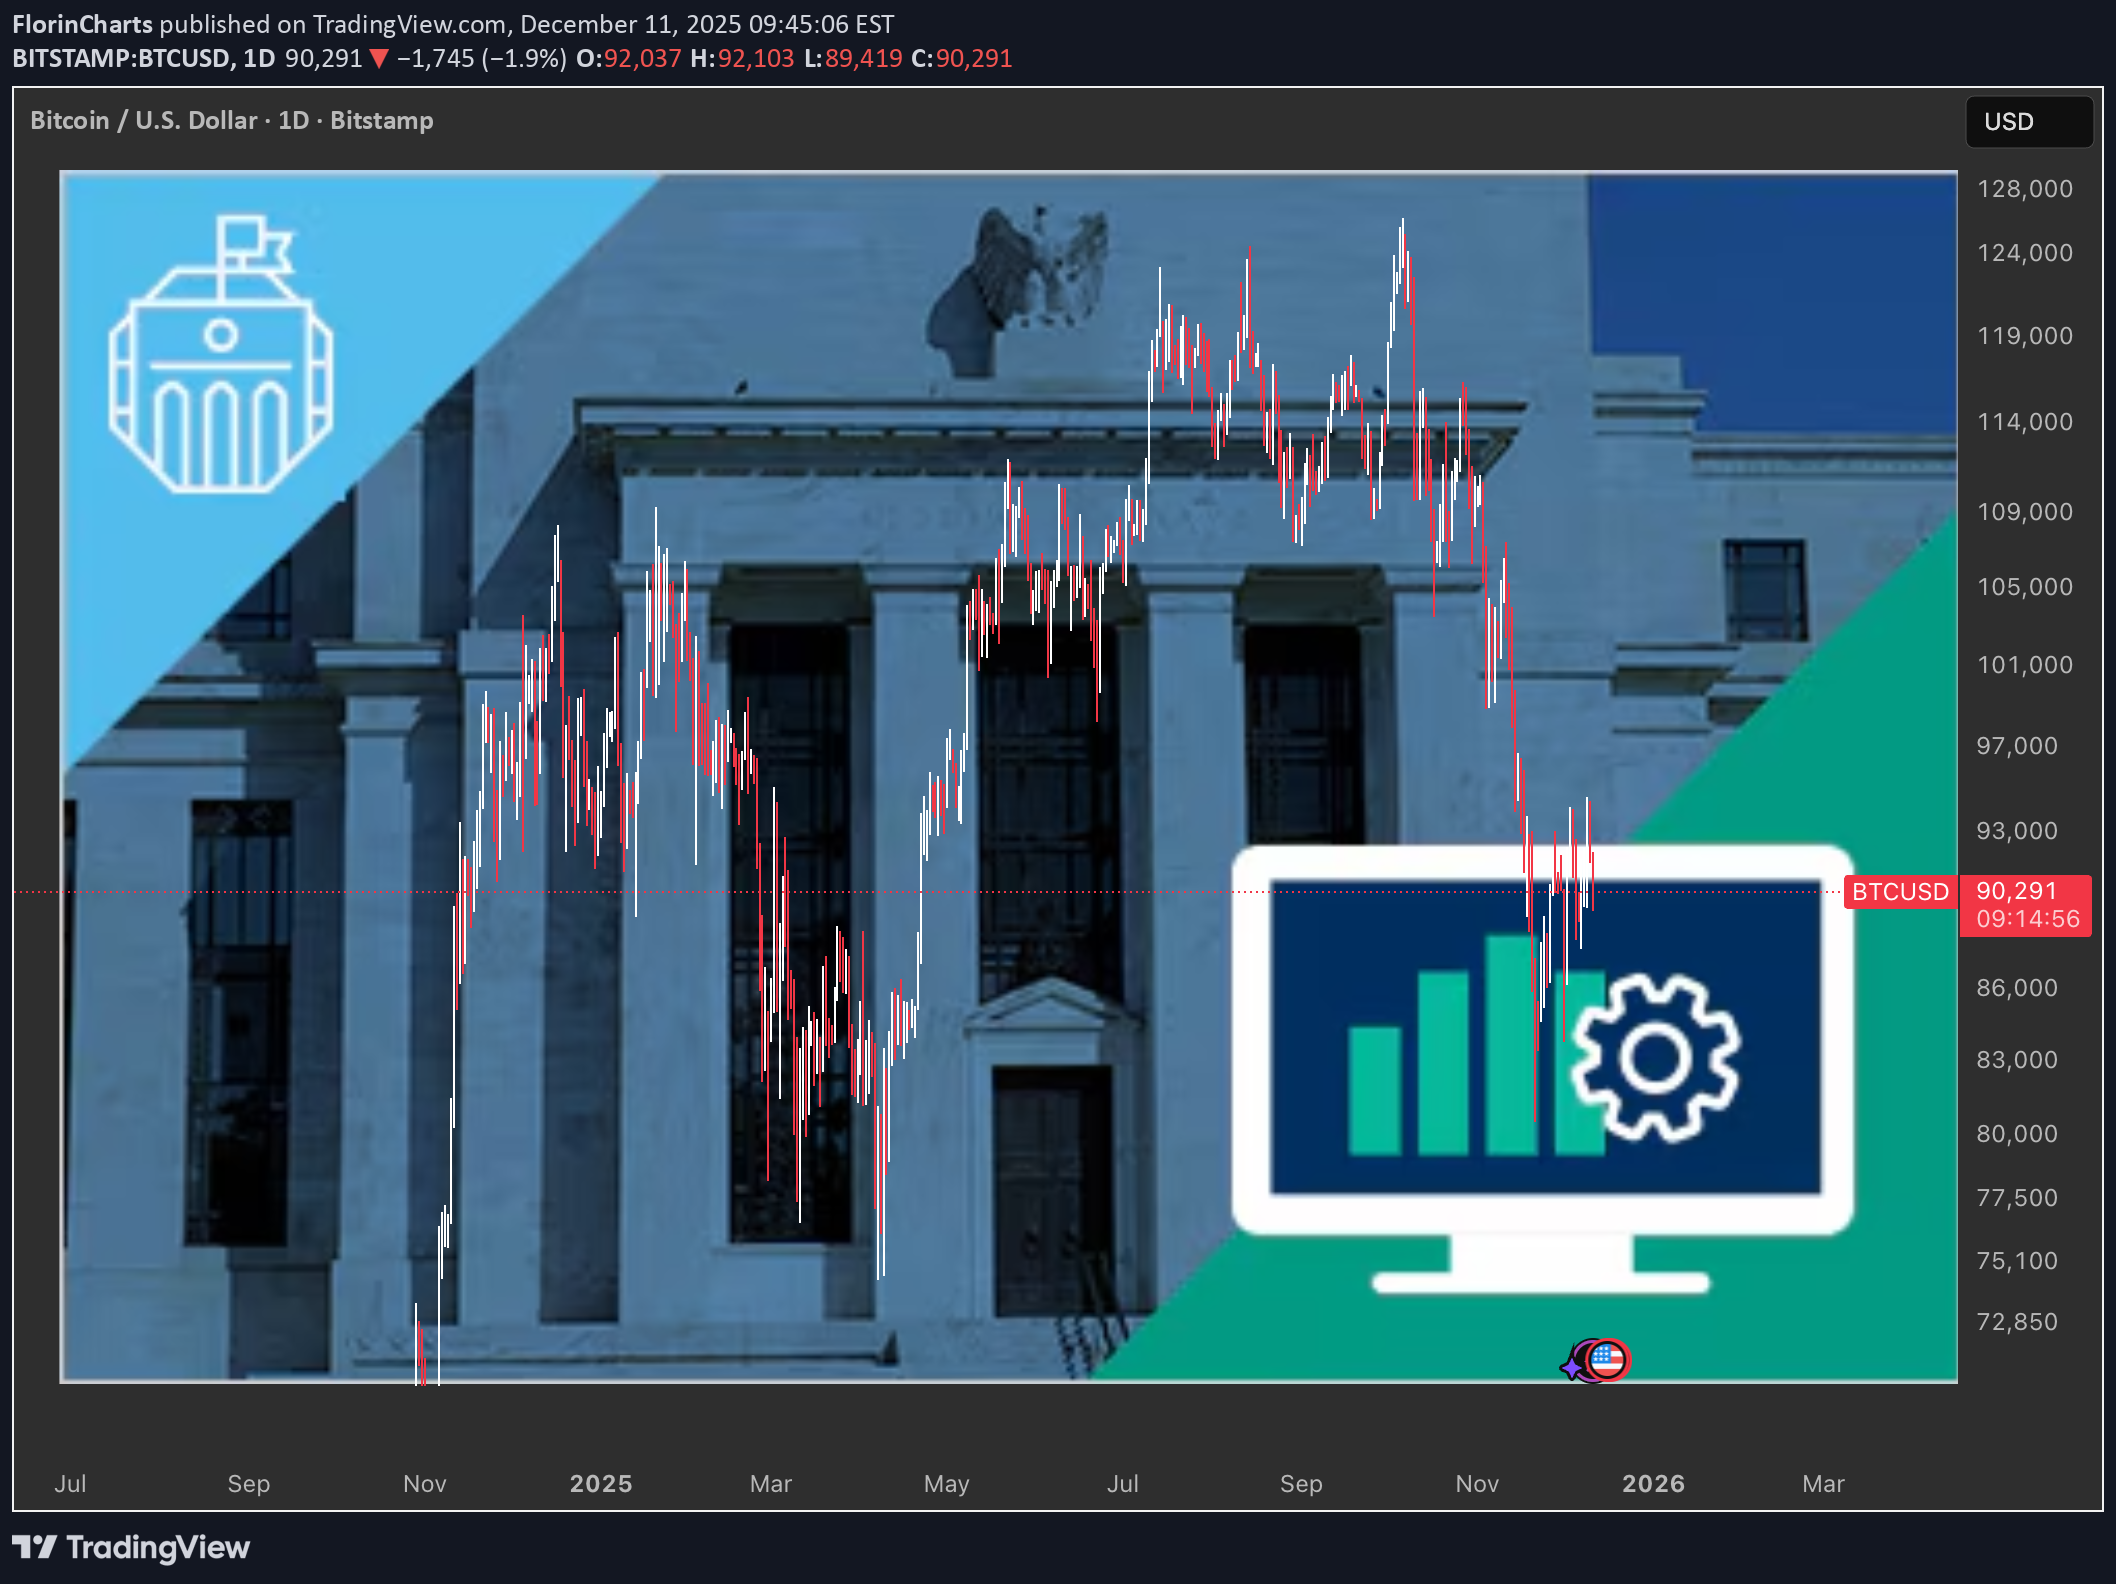
How the Fed’s Next Move Could Reshape Stocks, Gold and Bitcoin
Powell’s Big December Decision 🏛️ The December 2025 Fed meeting is a big deal because the US economy is in a tricky spot: Inflation is still a bit too high 📈 Growth and jobs are starting to weaken 📉 Most traders expect the Fed to cut interest rates by 0.25%, but not everyone at the Fed agrees. If Jerome Powell does something different from what markets expect, we could see either a strong rally in risk assets or a nasty risk‑off move. What the Fed might do ⚙️ The Fed has three main options: 1. Cut rates and sound “dovish” 🕊️ They cut 0.25% and say they’re ready to help the economy more if needed. Markets usually like this: cheaper money, easier credit. 2. Cut rates but sound “hawkish” 🦅 They cut, but Powell keeps warning a lot about inflation. This sends a mixed signal: some good news, some bad news. 3. No cut (a pause) 😐 This would surprise markets because most people expect a cut. Could scare investors and cause a quick sell‑off in risk assets. What it could mean for gold and Bitcoin 1. Gold Loves lower real yields and weaker dollar. A clear cut with a dovish message could push gold to new highs. A surprise pause or hawkish tone could trigger a quick pullback. 2. Bitcoin & crypto Rate cuts usually mean more liquidity and more risk‑taking, which helps crypto. If the Fed delivers the cut and hints at more easing in 2026, BTC could break out of its correction and start a new leg up. If Powell disappoints (no cut or very hawkish talk), crypto can dump first as traders de‑risk. Bottom line ✅ This meeting is important because it sets the tone for 2026: A friendly, dovish Fed = more chances for a risk‑on environment in stocks, gold and Bitcoin 🚀 A cautious or hawkish Fed = more volatility and possible corrections before any new uptrend 🔁 Traders should watch not just what the Fed does with rates, but also how Powell talks about inflation, growth and future cuts.
بیت کوین در دوراهی مرگ و زندگی: تست حیاتی میانگین متحرک 50 هفتهای!
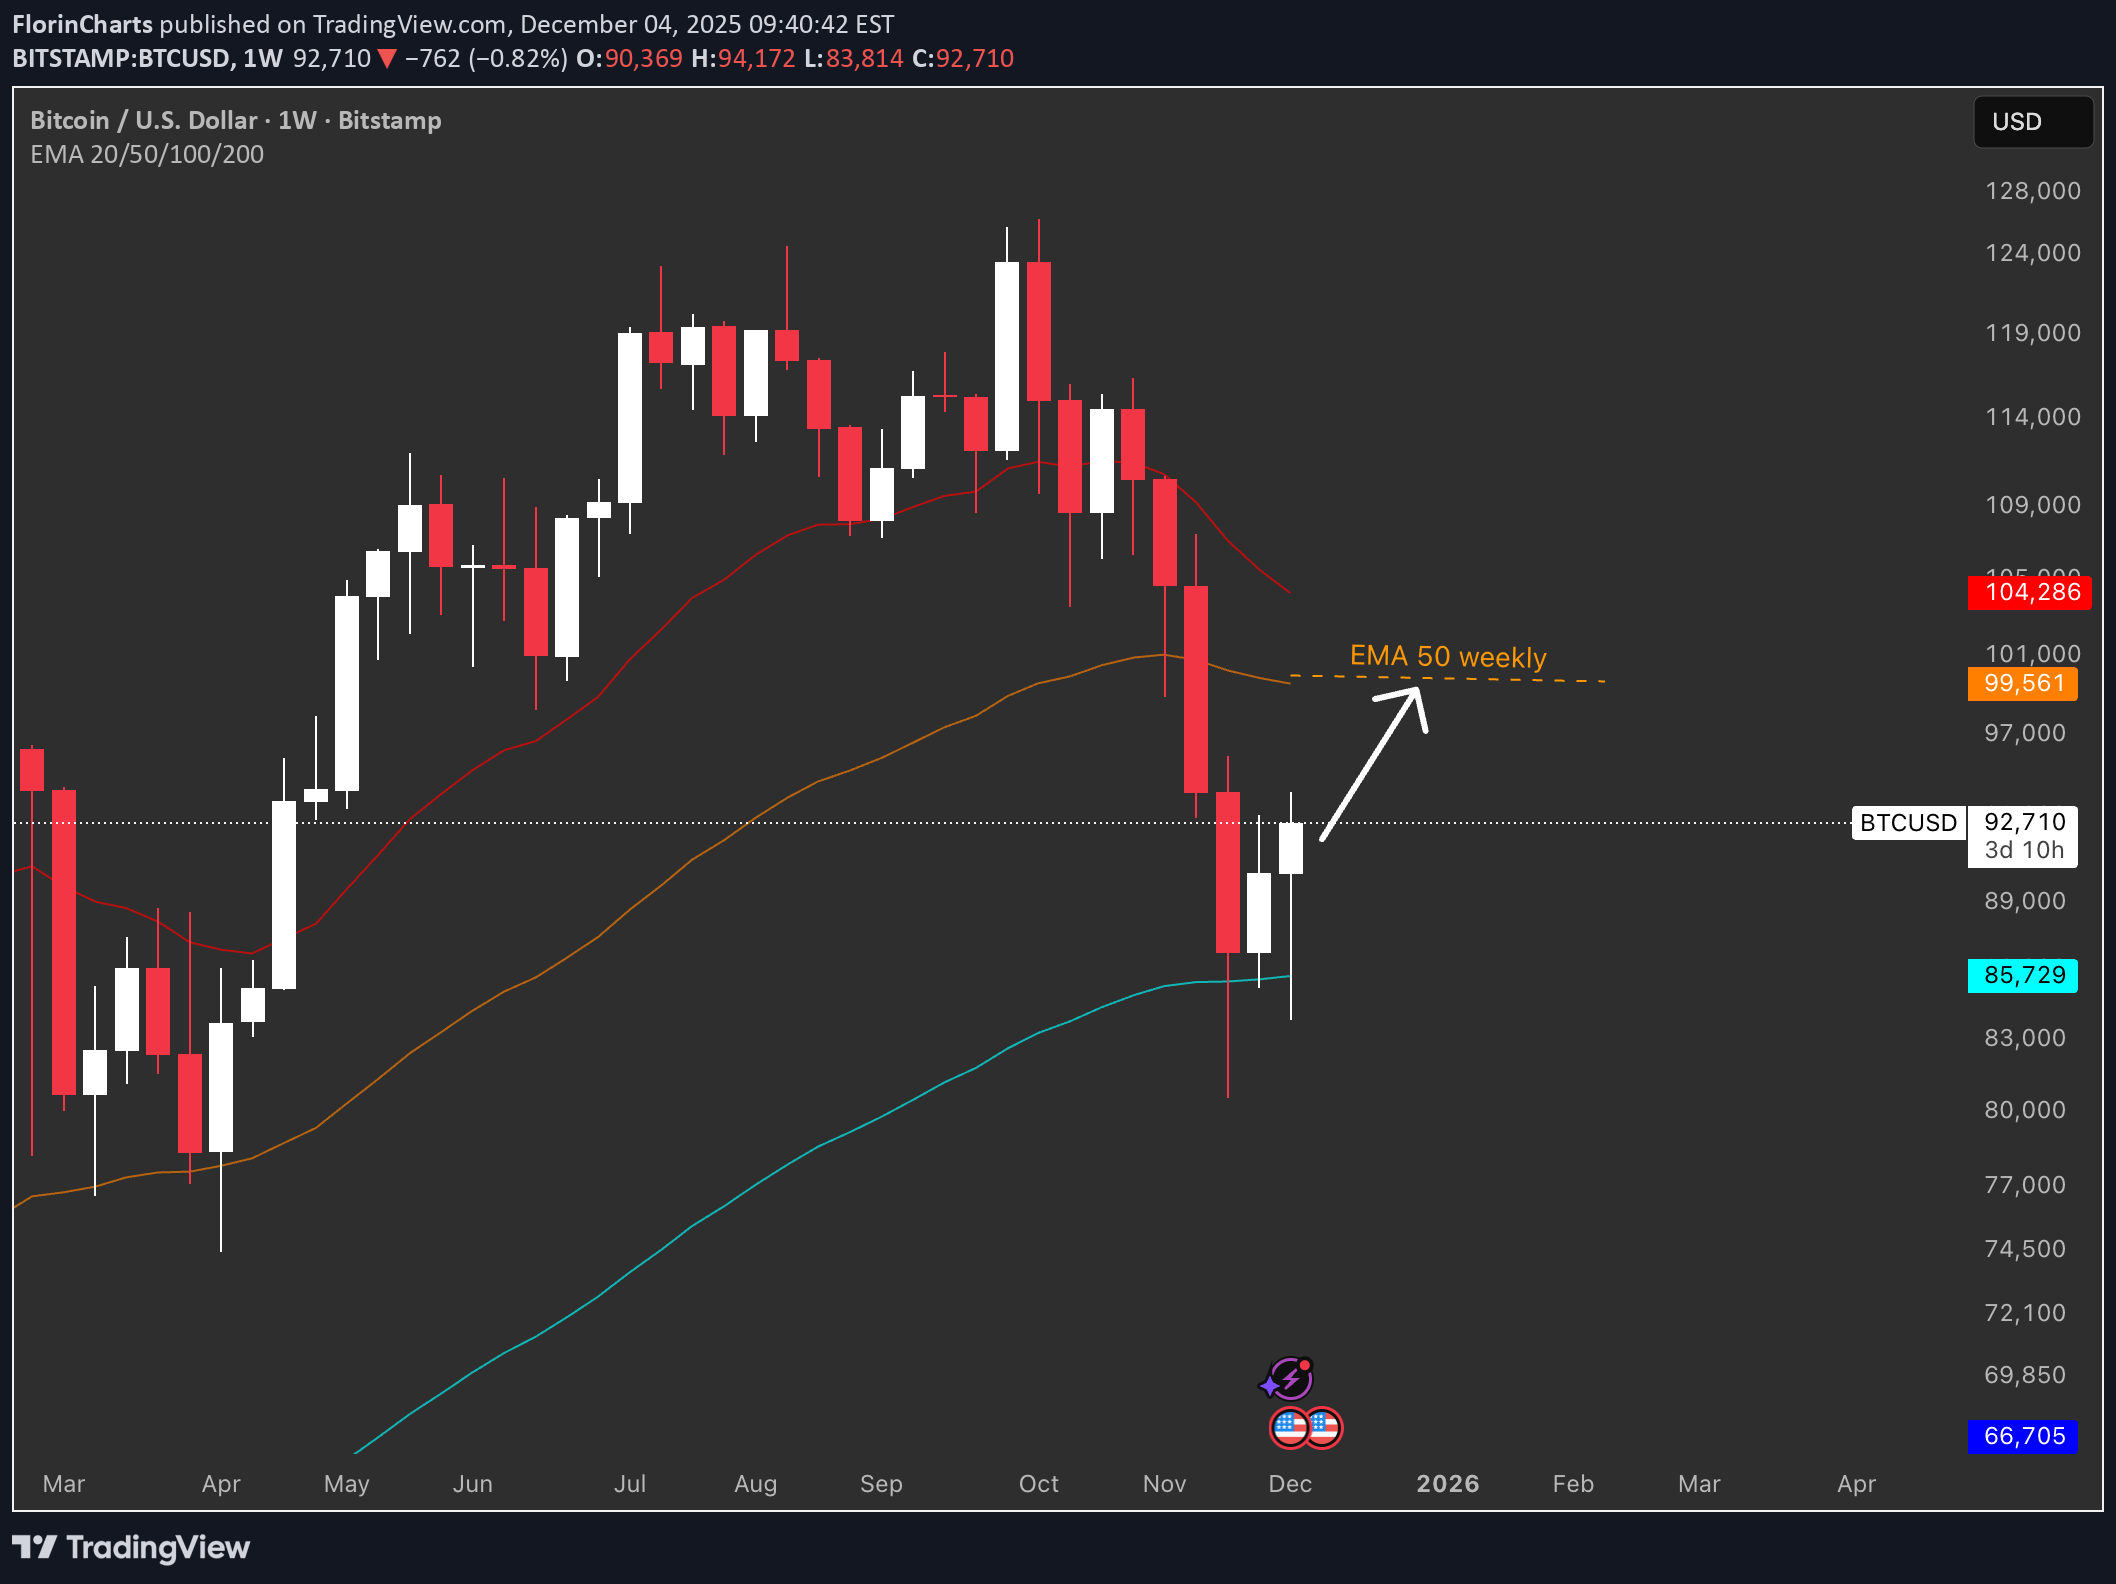
🎯 Why the EMA 50 Matters The 50-week moving average is a simple trend line that traders watch: ✅ Trend signal – If price stays above it, the trend is up. Below it, the trend is down. ✅ Support/Resistance – It acts like a magnet that price bounces off. ✅ Everyone watches it – When many traders use the same level, it becomes real support. 📈 Scenario 1: REJECT (Price Goes Down) Bitcoin bounces down from the EMA 50 Price falls back to ~$85–92K Trend weakens temporarily What to look for: Weekly close below $99,553 Lower highs on daily chart Selling pressure increases 📉 Scenario 2: BREAK (Price Goes Up) Bitcoin closes above EMA 50 with strength Price continues toward $120–128K Trend stays strong What to look for: Weekly close above $99,553 Strong volume on the push up Higher lows forming 🔮 Most Likely Outcome: DOWN FIRST, THEN UP Probability: Reject now: ext 1–2 weeks Eventually breaks higher: ~70% (next 1–2 months) 📌 Simple Trade Plan If you're bullish: Buy dips near $85–87K (the blue line) Stop loss below $83K Target $120K+
Disclaimer
Any content and materials included in Sahmeto's website and official communication channels are a compilation of personal opinions and analyses and are not binding. They do not constitute any recommendation for buying, selling, entering or exiting the stock market and cryptocurrency market. Also, all news and analyses included in the website and channels are merely republished information from official and unofficial domestic and foreign sources, and it is obvious that users of the said content are responsible for following up and ensuring the authenticity and accuracy of the materials. Therefore, while disclaiming responsibility, it is declared that the responsibility for any decision-making, action, and potential profit and loss in the capital market and cryptocurrency market lies with the trader.