Technical analysis by FlorinCharts about Symbol SPYX on 12/13/2025

From QE to QT. Reading the Fed’s Cycle from the Chart
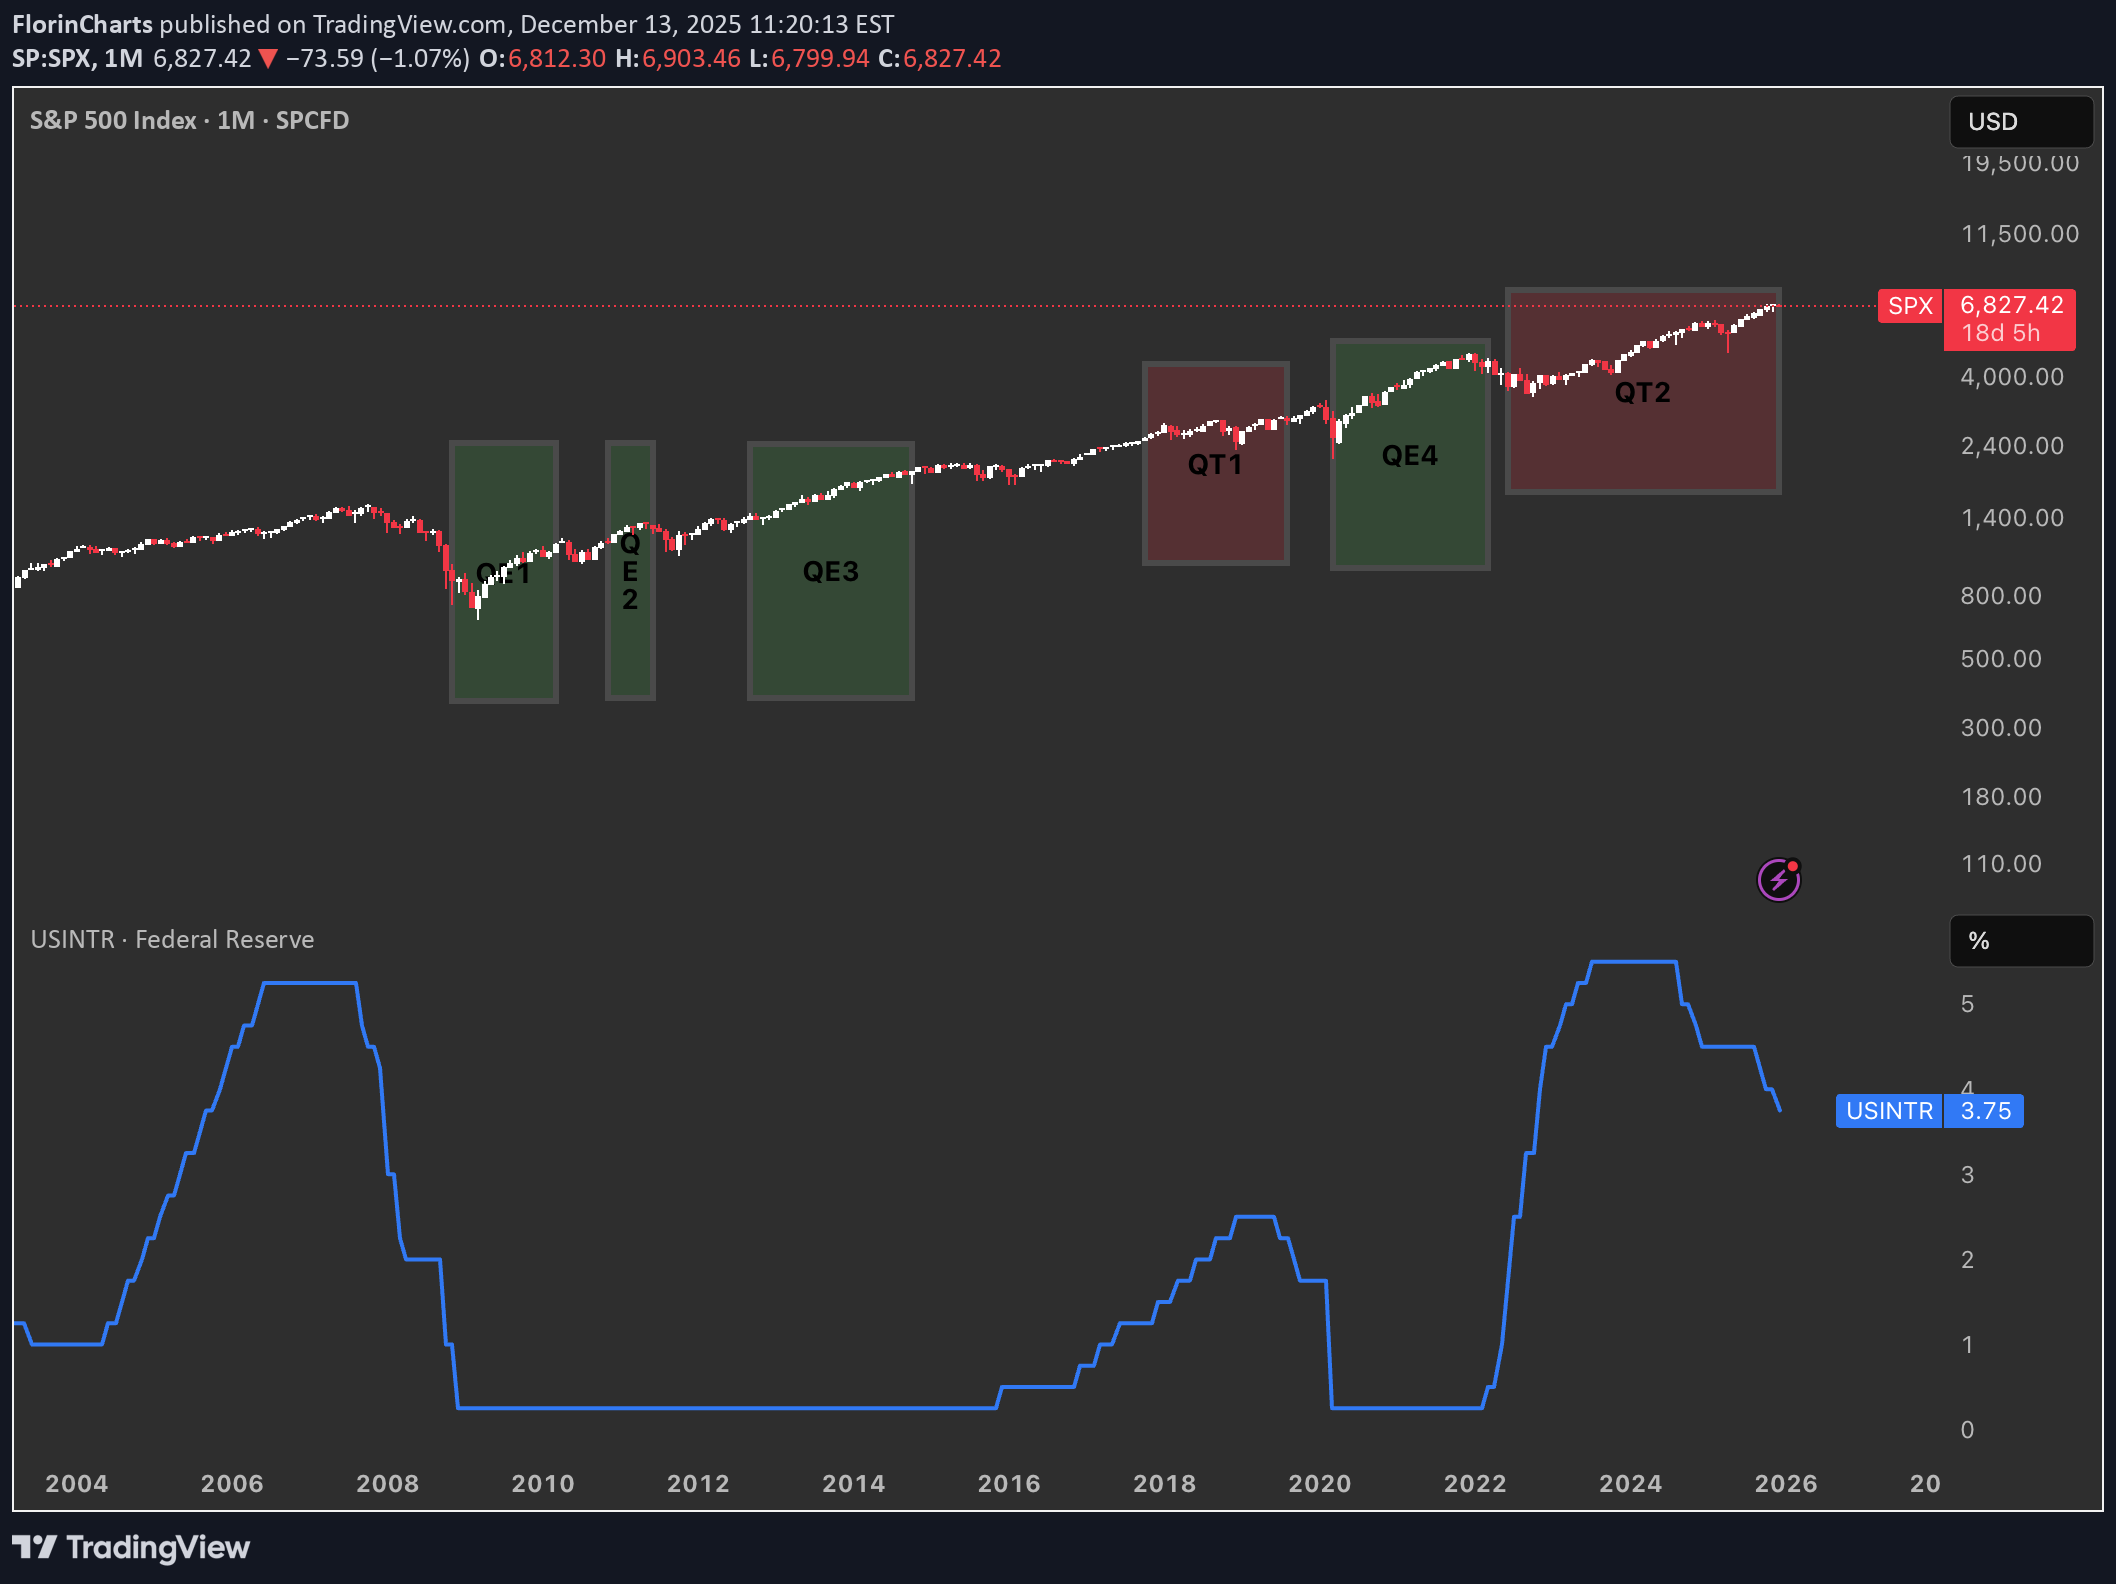
Quantitative Easing (QE) is when the Federal Reserve buys large amounts of Treasuries and mortgage‑backed securities to expand its balance sheet, inject liquidity, and push interest rates lower across the curve. Quantitative Tightening (QT) is the opposite: the Fed allows its bond holdings to roll off or sells securities, shrinking the balance sheet and tightening financial conditions. QE near zero rates Historically the Fed has only launched QE when the policy rate was pinned near zero and conventional rate cuts were basically exhausted, as in 2008–2014 and again in 2020–2022. QT at elevated rates By contrast, QT has been used only once the Fed had already hiked rates to clearly positive, “elevated” levels and wanted to normalize the balance sheet from those earlier QE waves. What ending QT in December could imply QT effectively ended around 1 December, it suggests the Fed may feel comfortable pausing balance‑sheet tightening while rates are still high, opening the door later to cuts if growth or markets weaken. In that setting, the market could start to price a shift from outright restriction toward neutrality, which often coincides with more two‑sided volatility in risk assets. Echoes of the QT1 → QE3 window The period after QT1 and before QE3 saw rates come off their highs and then a major shock (COVID-18 crysis) that helped justify easier policy again. A similar path is plausible here: a “black swan” type event in the coming year could hit growth or credit, force a rapid drop in rates, and trigger a new QE‑style response that would rhyme with the QT1‑to‑QE3 sequence your chart visually captures.