ChazzyFreshh
@t_ChazzyFreshh
What symbols does the trader recommend buying?
Purchase History
پیام های تریدر
Filter
Signal Type
ChazzyFreshh
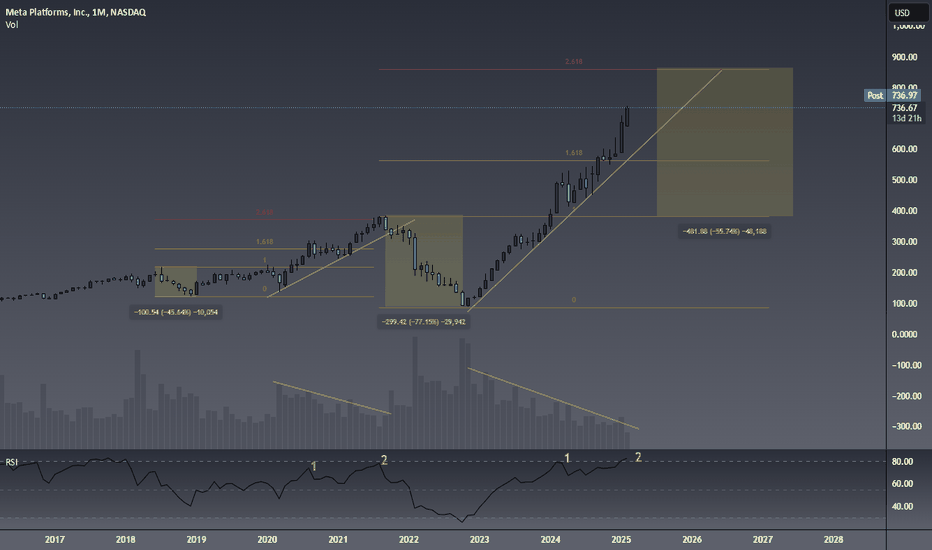
Was just having a little fun before bed and brainstorming on the META chart. Our darling as of late. I love trying to find similarities and patterns between macro swings and cycles. Human psychology and business cycles have a way of repeating themselves pretty often. As they say, history doesn't repeat, but it rhymes. This recent melt up reminds a lot of the price action META saw in 2021-2022. RSI overbought both times, currently approaching the 2.618 fib when connecting them to major high and low points. Decreasing volume on the moves up. There's a lot of other data to support a bear market may be on the horizon: Weak housing data/stocks (I do see some outlier stocks in the housing sector). The yield curve un-inversion which typically precedes major bear markets 6-12 months after un-inversion. The dollar seems to want to keep going higher. However it has shown a lot of weakness here lately which could help fuel the rest of the bull market. The unwinding of the Japanese Yen carry trade has seemed to play a big factor in U.S equities as of late. Every time the BOJ hikes interest rates, a lot of U.S. equities see pretty sizable bearish volatility shortly after. Being the darling that META has become, once this trend line breaks it will be a signal that everyone should be taking note of in my opinion. I think the risk of a bear market increases dramatically. Maybe we get a shallow or 2022 style bear market next year and continue to make one last lag into new highs in 2027. Here are some ideas that could support that theory: China seems to be coming out of a depression-style bear market and is beginning to inject liquidity into their economy. This could help give U.S. equities a little more juice to run higher for longer chips could make a major comeback and fuel SPY/QQQ higher for longer. Names like Google, Tesla and Amazon can continue to show strength and we could see a rotation into them. Maybe we get some more significant quantum breakthroughs with the help of AI. These are things to keep in mind, but I think the probabilities of this this bull market we've enjoyed since 2008 is A LOT closer to the end than the beginning. I base most of my sentiment off the 18.6 year real estate/land cycle theory that I have been following since 2022. I also give a lot of credibility to U.S. yield curve un-inversions sending shockwaves through the global economic system. What do you guys and gals think?
ChazzyFreshh
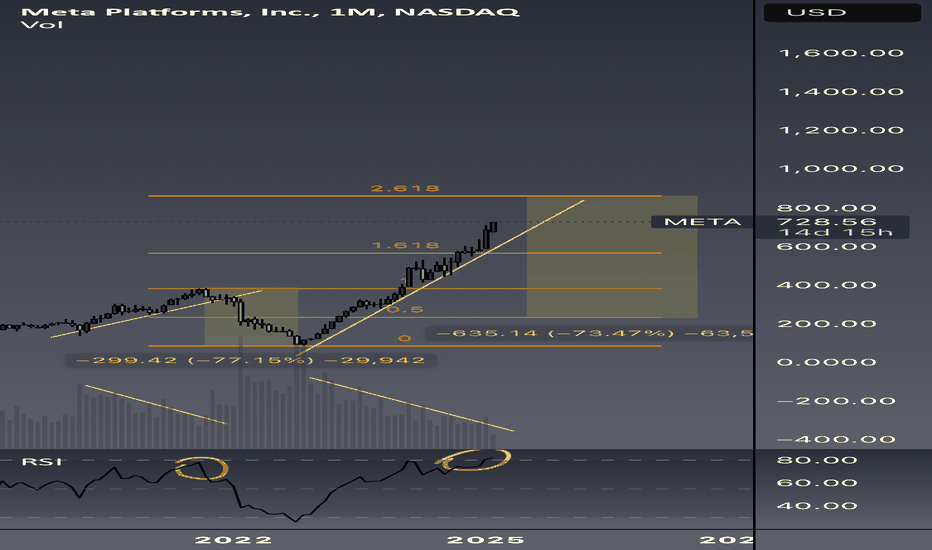
Just a little fun and brainstorming with higher time frame charts. Utilizing RSI, patterns, and time cycles. Lots of similarities between now and the 2020-2021 bull run. Not to mention a lot of good data suggesting we are close to a recession at best. (Weak housing data/stocks, yield curve uninversion) What are your thoughts?
ChazzyFreshh
ChazzyFreshh
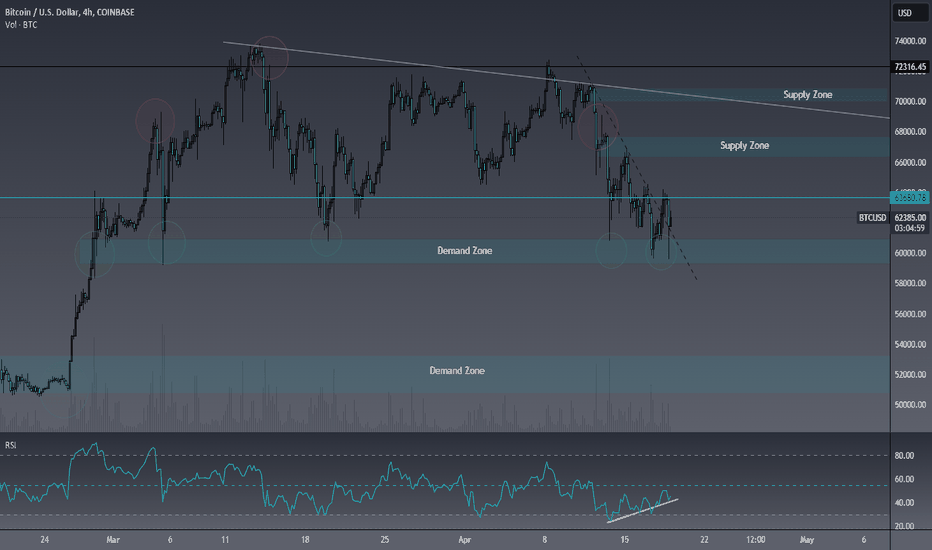
What are our thoughts on Bitcoin and the overall market/market sentiment? I have too many words right now for the markets. So many things converging as far as the dollar, rates, equities, and crypto. This chart is gorgeous and I love seeing the false breakdown over the Iran/Israel headlines. The bullish divergence on the RSI is also lovely. The SPY has finally filled a CME gap back from February. I think we will see a bottom begin to form from here, and whether or not this is the end of the downtrend remains to be seen. I think the probabilities of one more leg down are decent, but same with this being the end of the bear. PS: Elon Musk just tweeted a photo of a missile heading straight up.. and I'm not so sure it had anything to do with war ;)
ChazzyFreshh
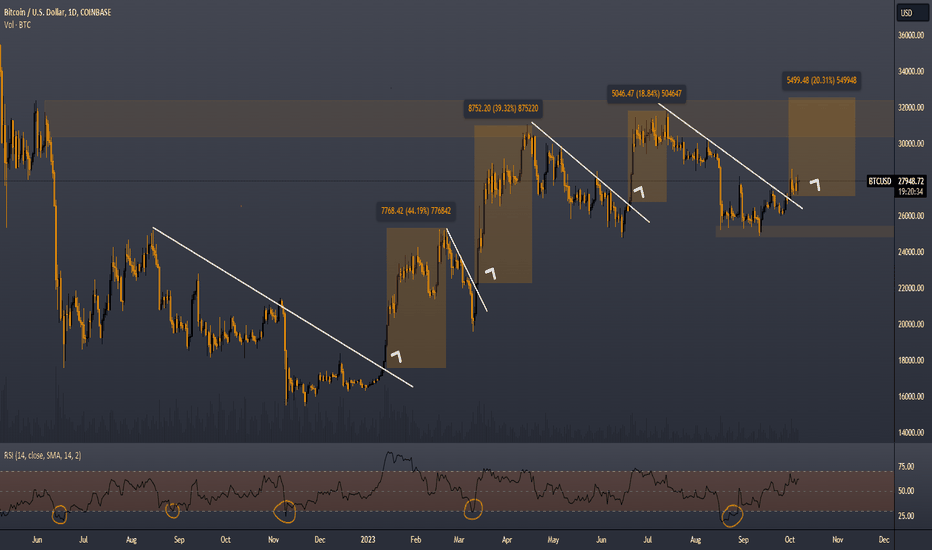
BTC BULLISH BRAINSTORM Happy Spooky Season boys and girls! Here is just a mock up of how I have been navigating Bitcoin. I am currently short term bullish and possibly long term bullish due to the season and recent price action across major indexes, commodities, the dollar, and Treasury yields. However that is remain to be seen and I will adjust my theses when necessary. Cool side note: If you had been dollar cost averaging every time BTC went oversold on the daily RSI over the last 12-18 months, you would have an average price per Bitcoin somewhere in the ballpark of $20,000. As of today you would be up 37% on that strategy.
ChazzyFreshh
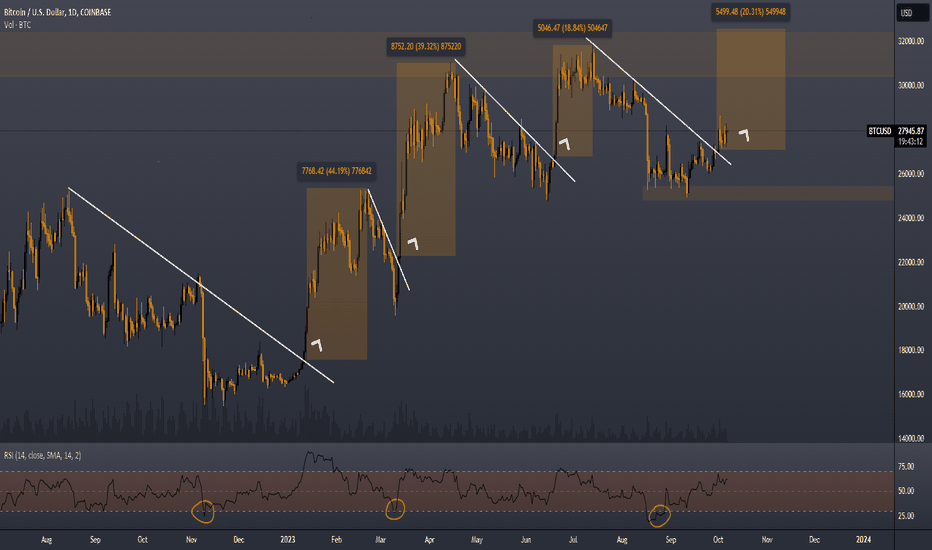
BTC BRAINSTORM Happy Spooky season boys and girls. I am currently short term bullish across the major indexes and commodities due to trecent price action on the DXY and 10Y. Possibly even long term bullish if these freshly formed lows can hold over the next several weeks. Let me know what you guys think.
ChazzyFreshh
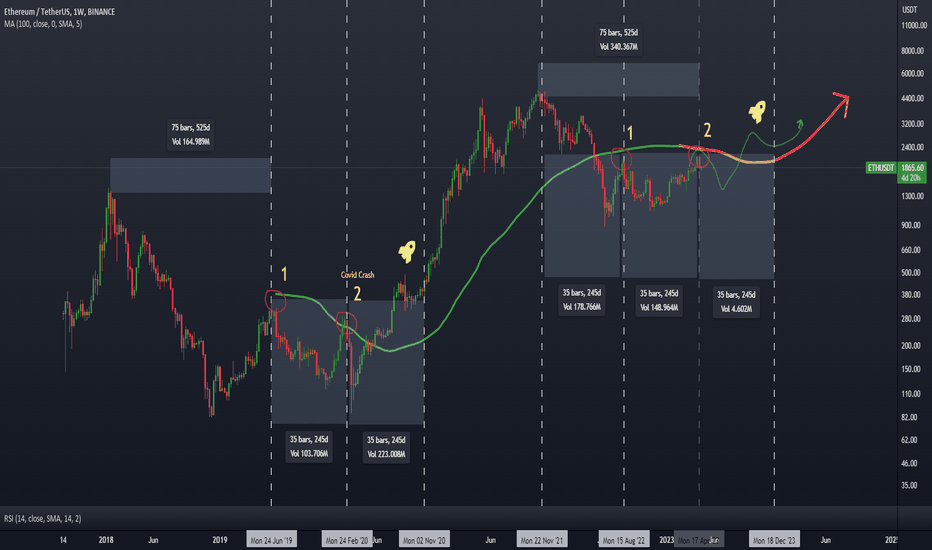
Just an update to my time based series. Refer to my previous Ethereum time based ideas below if you haven't checked them out yet. Looking forward to watching how this plays out the rest of the year.
ChazzyFreshh
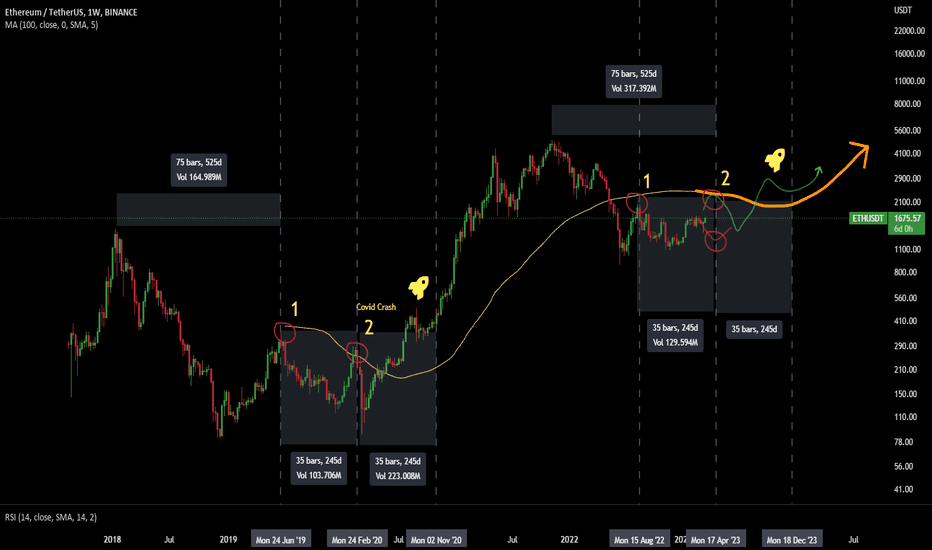
My time based theory is still in play, and with CPI print being released tomorrow, I think the probabilities are pretty reasonable that Ethereum is going to get extremely volatile, get close to one of these two key levels, and do so roughly around the date I have plotted with a vertical line. This theory is based on bitcoin having the same type of time based volatility over the last year. Let me know if you would like more details on bitcoins time based volatility. It is truly fascinating.
ChazzyFreshh
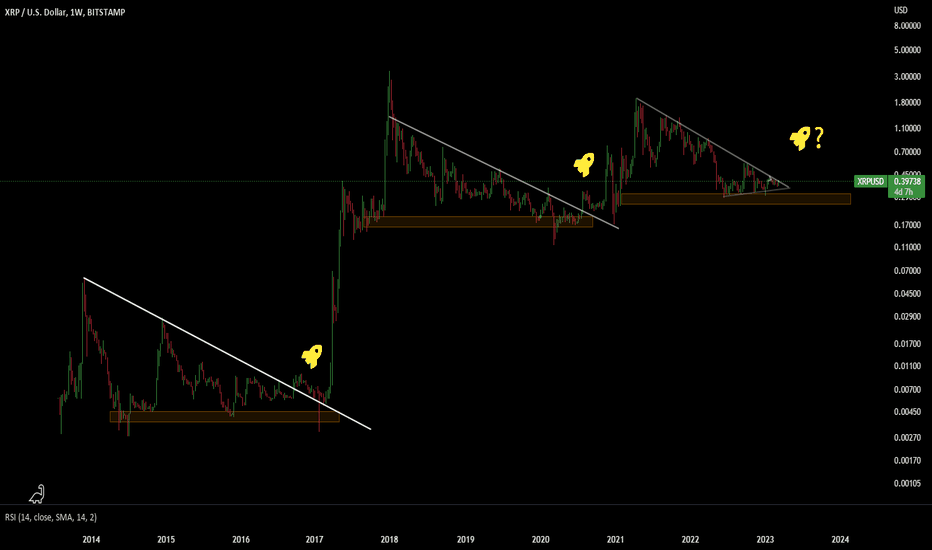
XRP weekly log chart is showing some interesting price action. Wanted to keep the chart clean and simple to display the obvious demand zones and breakouts. Is it coiling up for another explosive run? What are your thoughts?
ChazzyFreshh
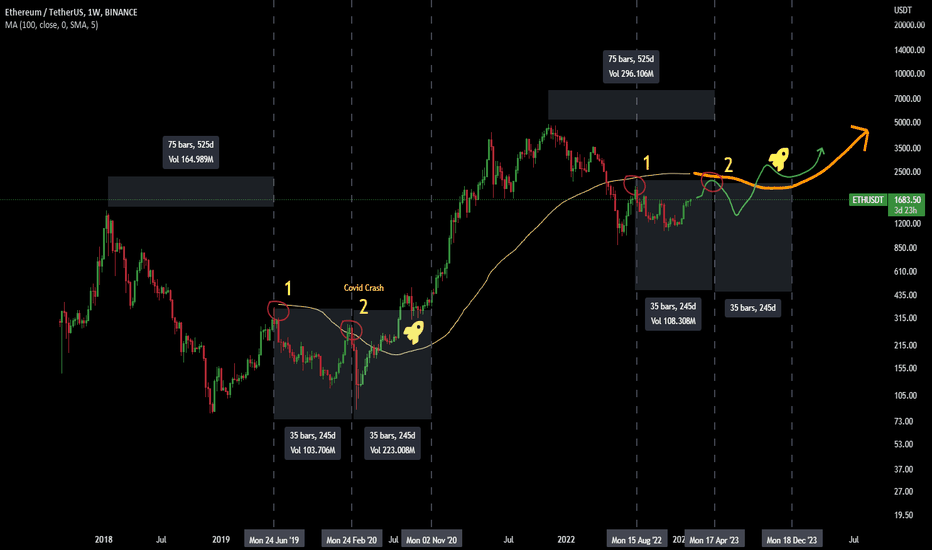
Is history repeating itself once again?Can the crypto market give us price action similar to last cycle?Bitcoin did something very interesting in 2022 where the first major peak, all time high, UST collapse, and the most recent breakout from lows were all separated by exactly 210 days.Here on Ethereum , I theorize it could be doing roughly the same thing in it's own way. I don't find it unlikely that the price action plays out much differently because the covid crash was a unforeseen black swan event. Had that crash not happened, crypto may have otherwise broken and held above the 100 weekly MA. Without a black swan event, could Ethereum pull something like that off?I'm not sure which outcome is most probable at this moment, the point is there could be a lot of volatility waiting at these future points in time marked on the chart.What do you think?Could Ethereum could break above 2k soon and test the 100 weekly MA?
Disclaimer
Any content and materials included in Sahmeto's website and official communication channels are a compilation of personal opinions and analyses and are not binding. They do not constitute any recommendation for buying, selling, entering or exiting the stock market and cryptocurrency market. Also, all news and analyses included in the website and channels are merely republished information from official and unofficial domestic and foreign sources, and it is obvious that users of the said content are responsible for following up and ensuring the authenticity and accuracy of the materials. Therefore, while disclaiming responsibility, it is declared that the responsibility for any decision-making, action, and potential profit and loss in the capital market and cryptocurrency market lies with the trader.