
CHILL_TRADER99
@t_CHILL_TRADER99

What symbols does the trader recommend buying?
Purchase History
پیام های تریدر
Filter
CHILL_TRADER99
SUI impulse wave!

I would consider this as high risk entry price has already moved and in the middle zone. we might see some short-term pull back before it continue to move up to retest resistance zone
CHILL_TRADER99
CHILL_TRADER99
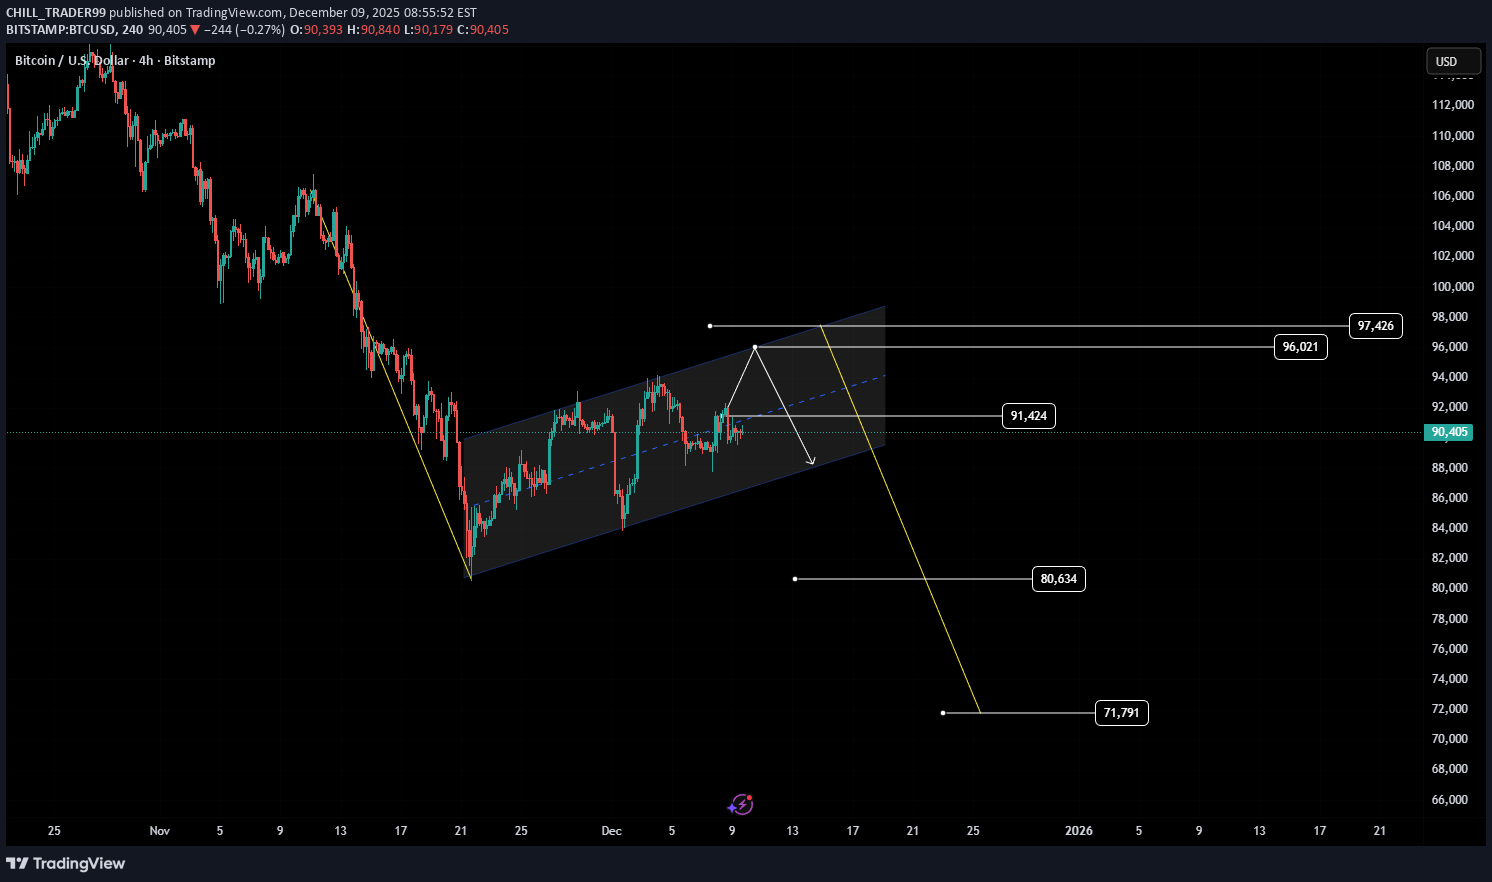
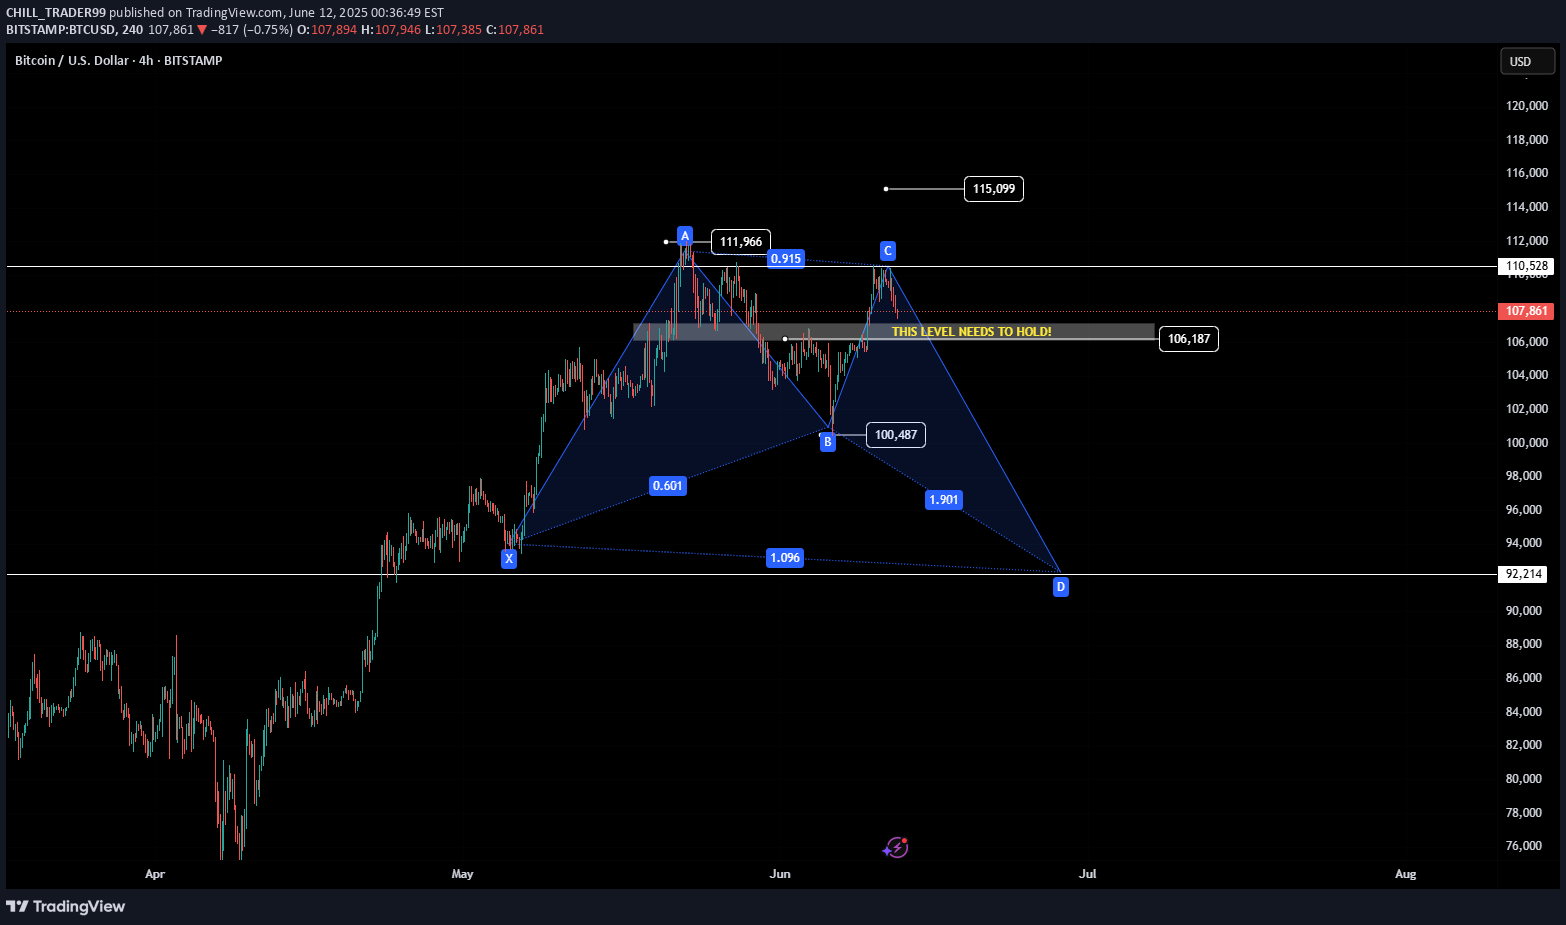
Bitcoin is forming an inverse cup & handle!

Bitcoin is forming an inverse cup & handle! ⚠️ Neckline/support at 107K – if this breaks, price could slide toward 100K. Expect possible short-term bounces at support levels 1, 2 & 3.
CHILL_TRADER99
$VIRTUAL BULLISH BAT PATTERN.

Price is hovering on the critical support zone. If the price manages to hold this level, this could be a fantastic entry. IMO 40% chance that this will play out.
CHILL_TRADER99
$JASMY ascending triangle pattern
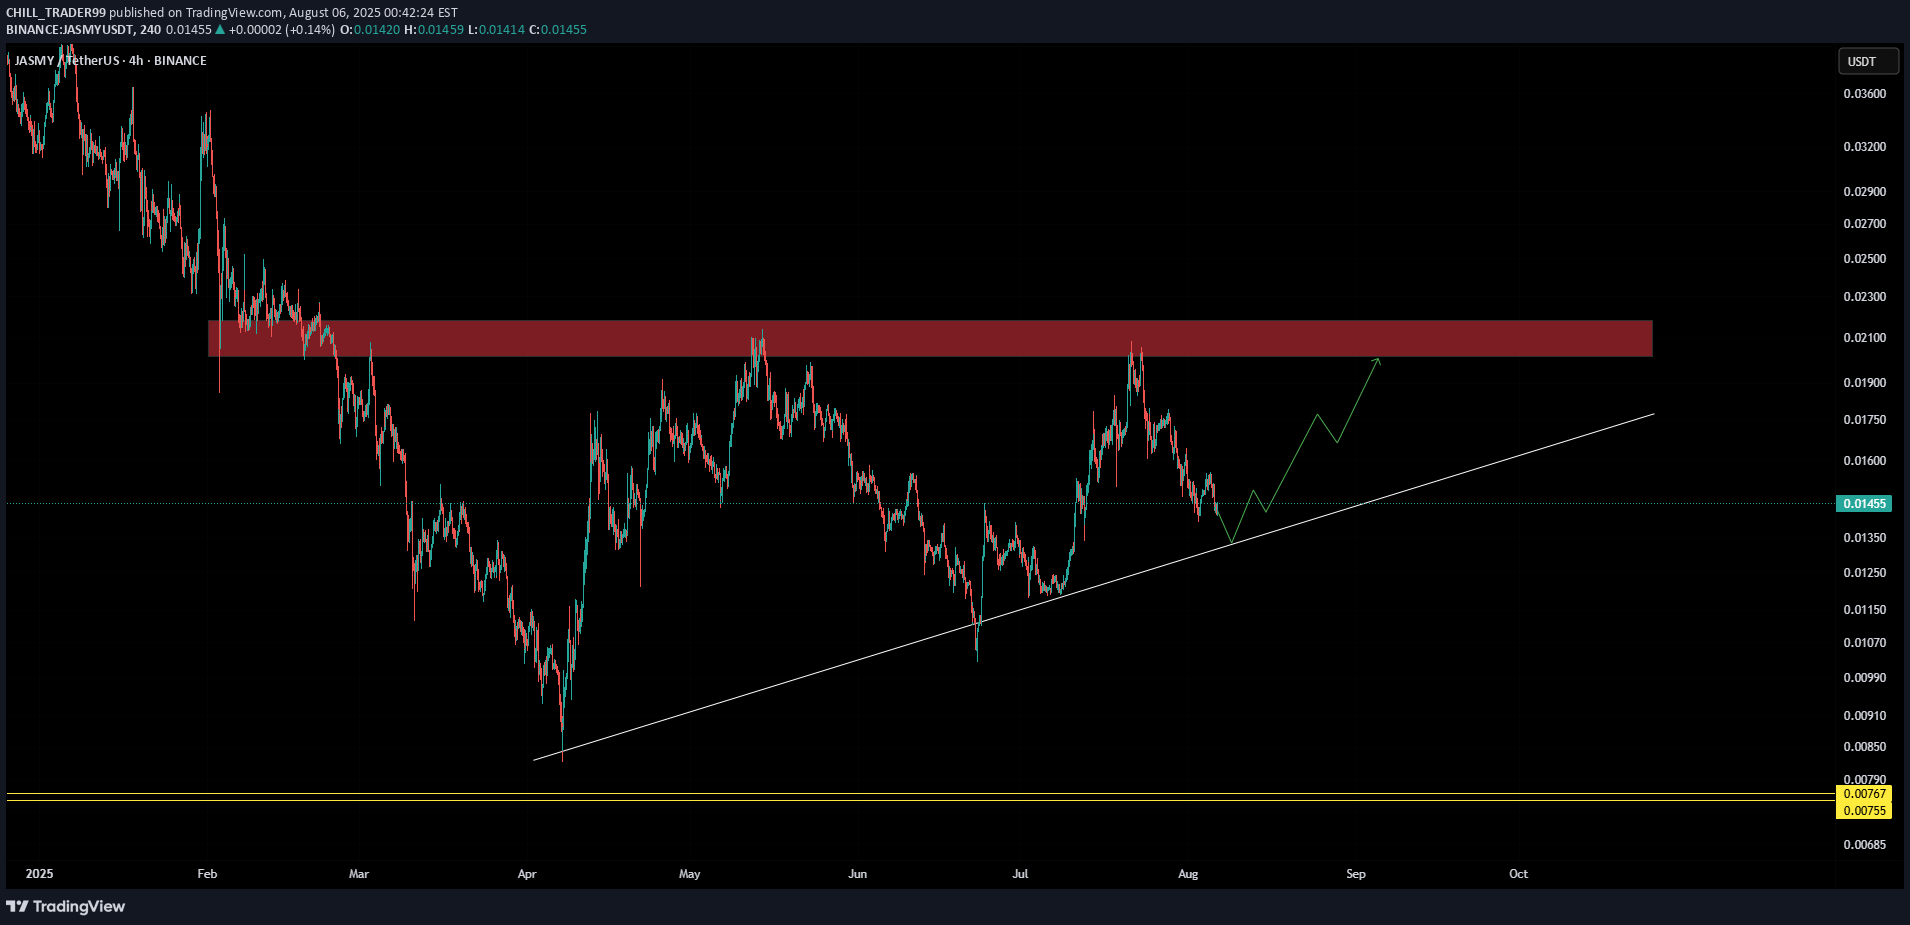
J JASMY price is hovering near the support trendline, and the chart is forming a bullish structure with consistent higher lows. If the price manages to hold, this could be a good buy zone near support IMO.
CHILL_TRADER99
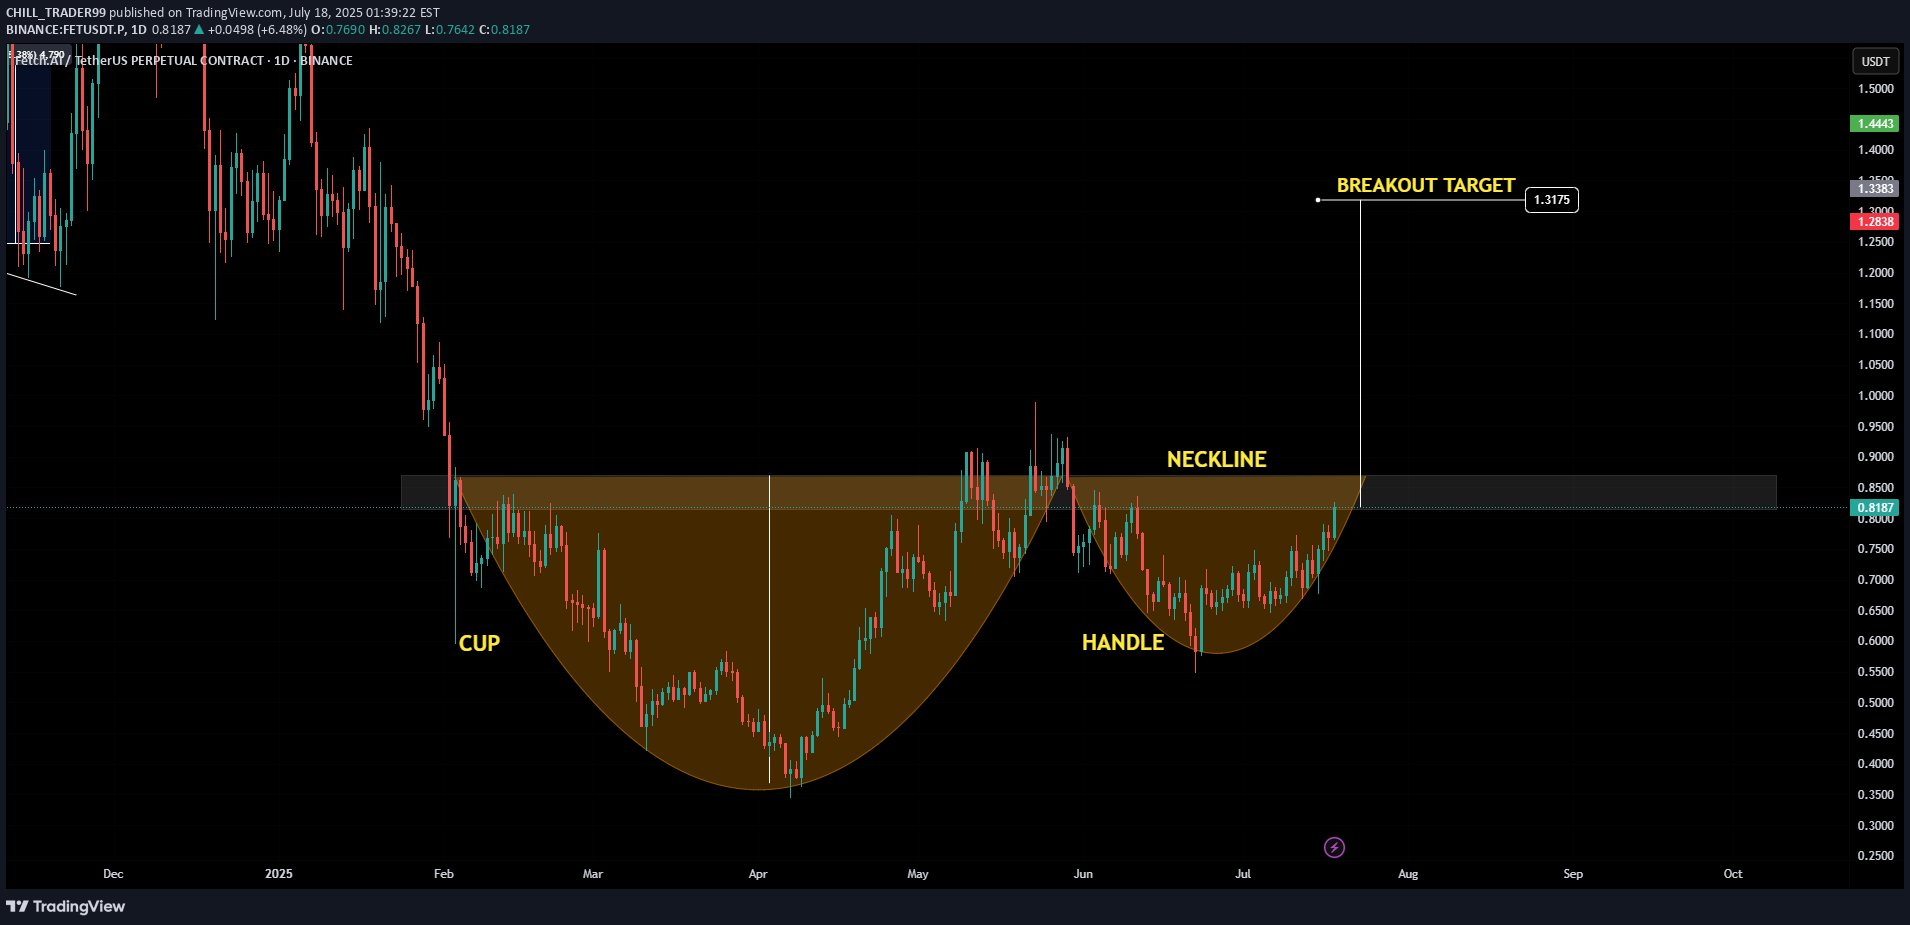
$FET possible Cup & Handle pattern forming!
CHILL_TRADER99
$APT could still rebound to $10.
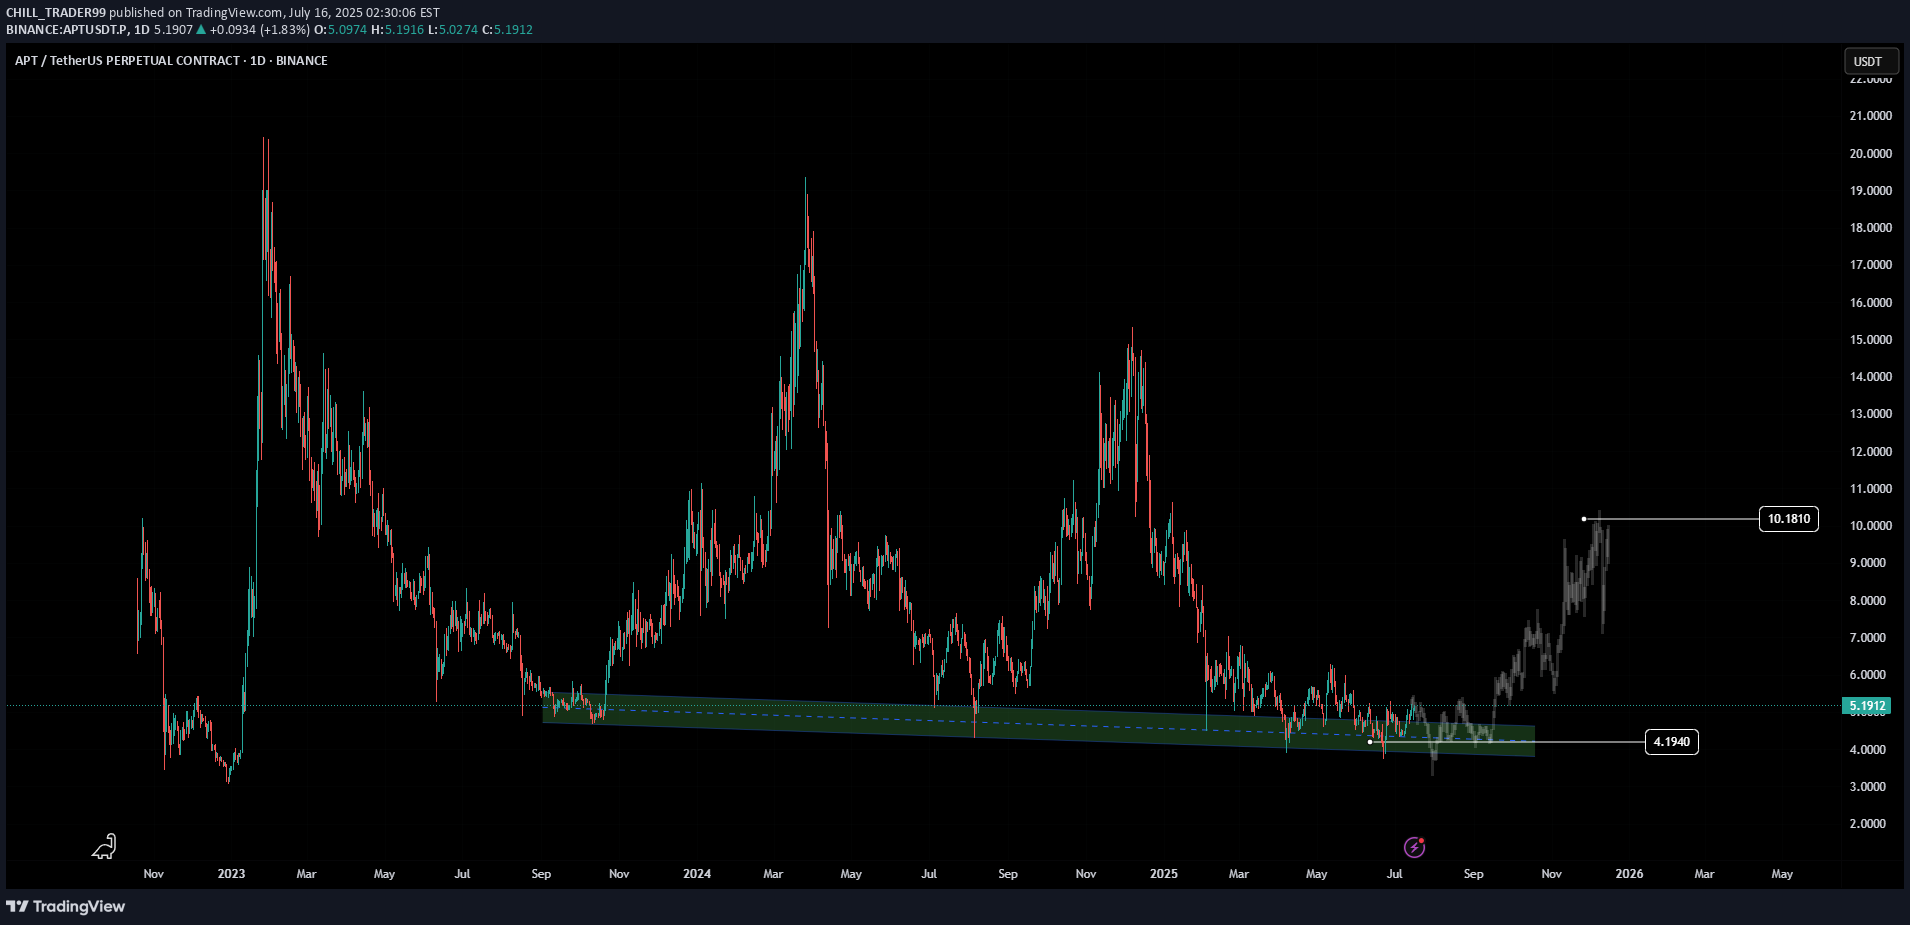
APT could still rebound to $10 if it repeats its previous price action. History doesn’t repeat, but it often rhymes. Disclaimer: This is not financial advice. Always do your own research before investing.
CHILL_TRADER99
CHILL_TRADER99
$XRP is forming an inverse cup and handle pattern

XRP is forming an inverse cup and handle pattern 👀 Price is hovering around a critical support level — a breakdown here could get ugly. ⚠️
CHILL_TRADER99
Gold forming a Head & Shoulders pattern on the 1H chart.

🟡 Gold forming a Head & Shoulders pattern on the 1H chart. Eyes on the breakout confirmation — this could be the move. 🎯
Disclaimer
Any content and materials included in Sahmeto's website and official communication channels are a compilation of personal opinions and analyses and are not binding. They do not constitute any recommendation for buying, selling, entering or exiting the stock market and cryptocurrency market. Also, all news and analyses included in the website and channels are merely republished information from official and unofficial domestic and foreign sources, and it is obvious that users of the said content are responsible for following up and ensuring the authenticity and accuracy of the materials. Therefore, while disclaiming responsibility, it is declared that the responsibility for any decision-making, action, and potential profit and loss in the capital market and cryptocurrency market lies with the trader.