
AnonymousTraderAcademy
@t_AnonymousTraderAcademy

What symbols does the trader recommend buying?
Purchase History
پیام های تریدر
Filter
AnonymousTraderAcademy
دیجیبایت: آیا الگوی الماس معکوس پس از ۱۱ سال شکل میگیرد؟ (احتمال رشد ۴۰ برابری!)
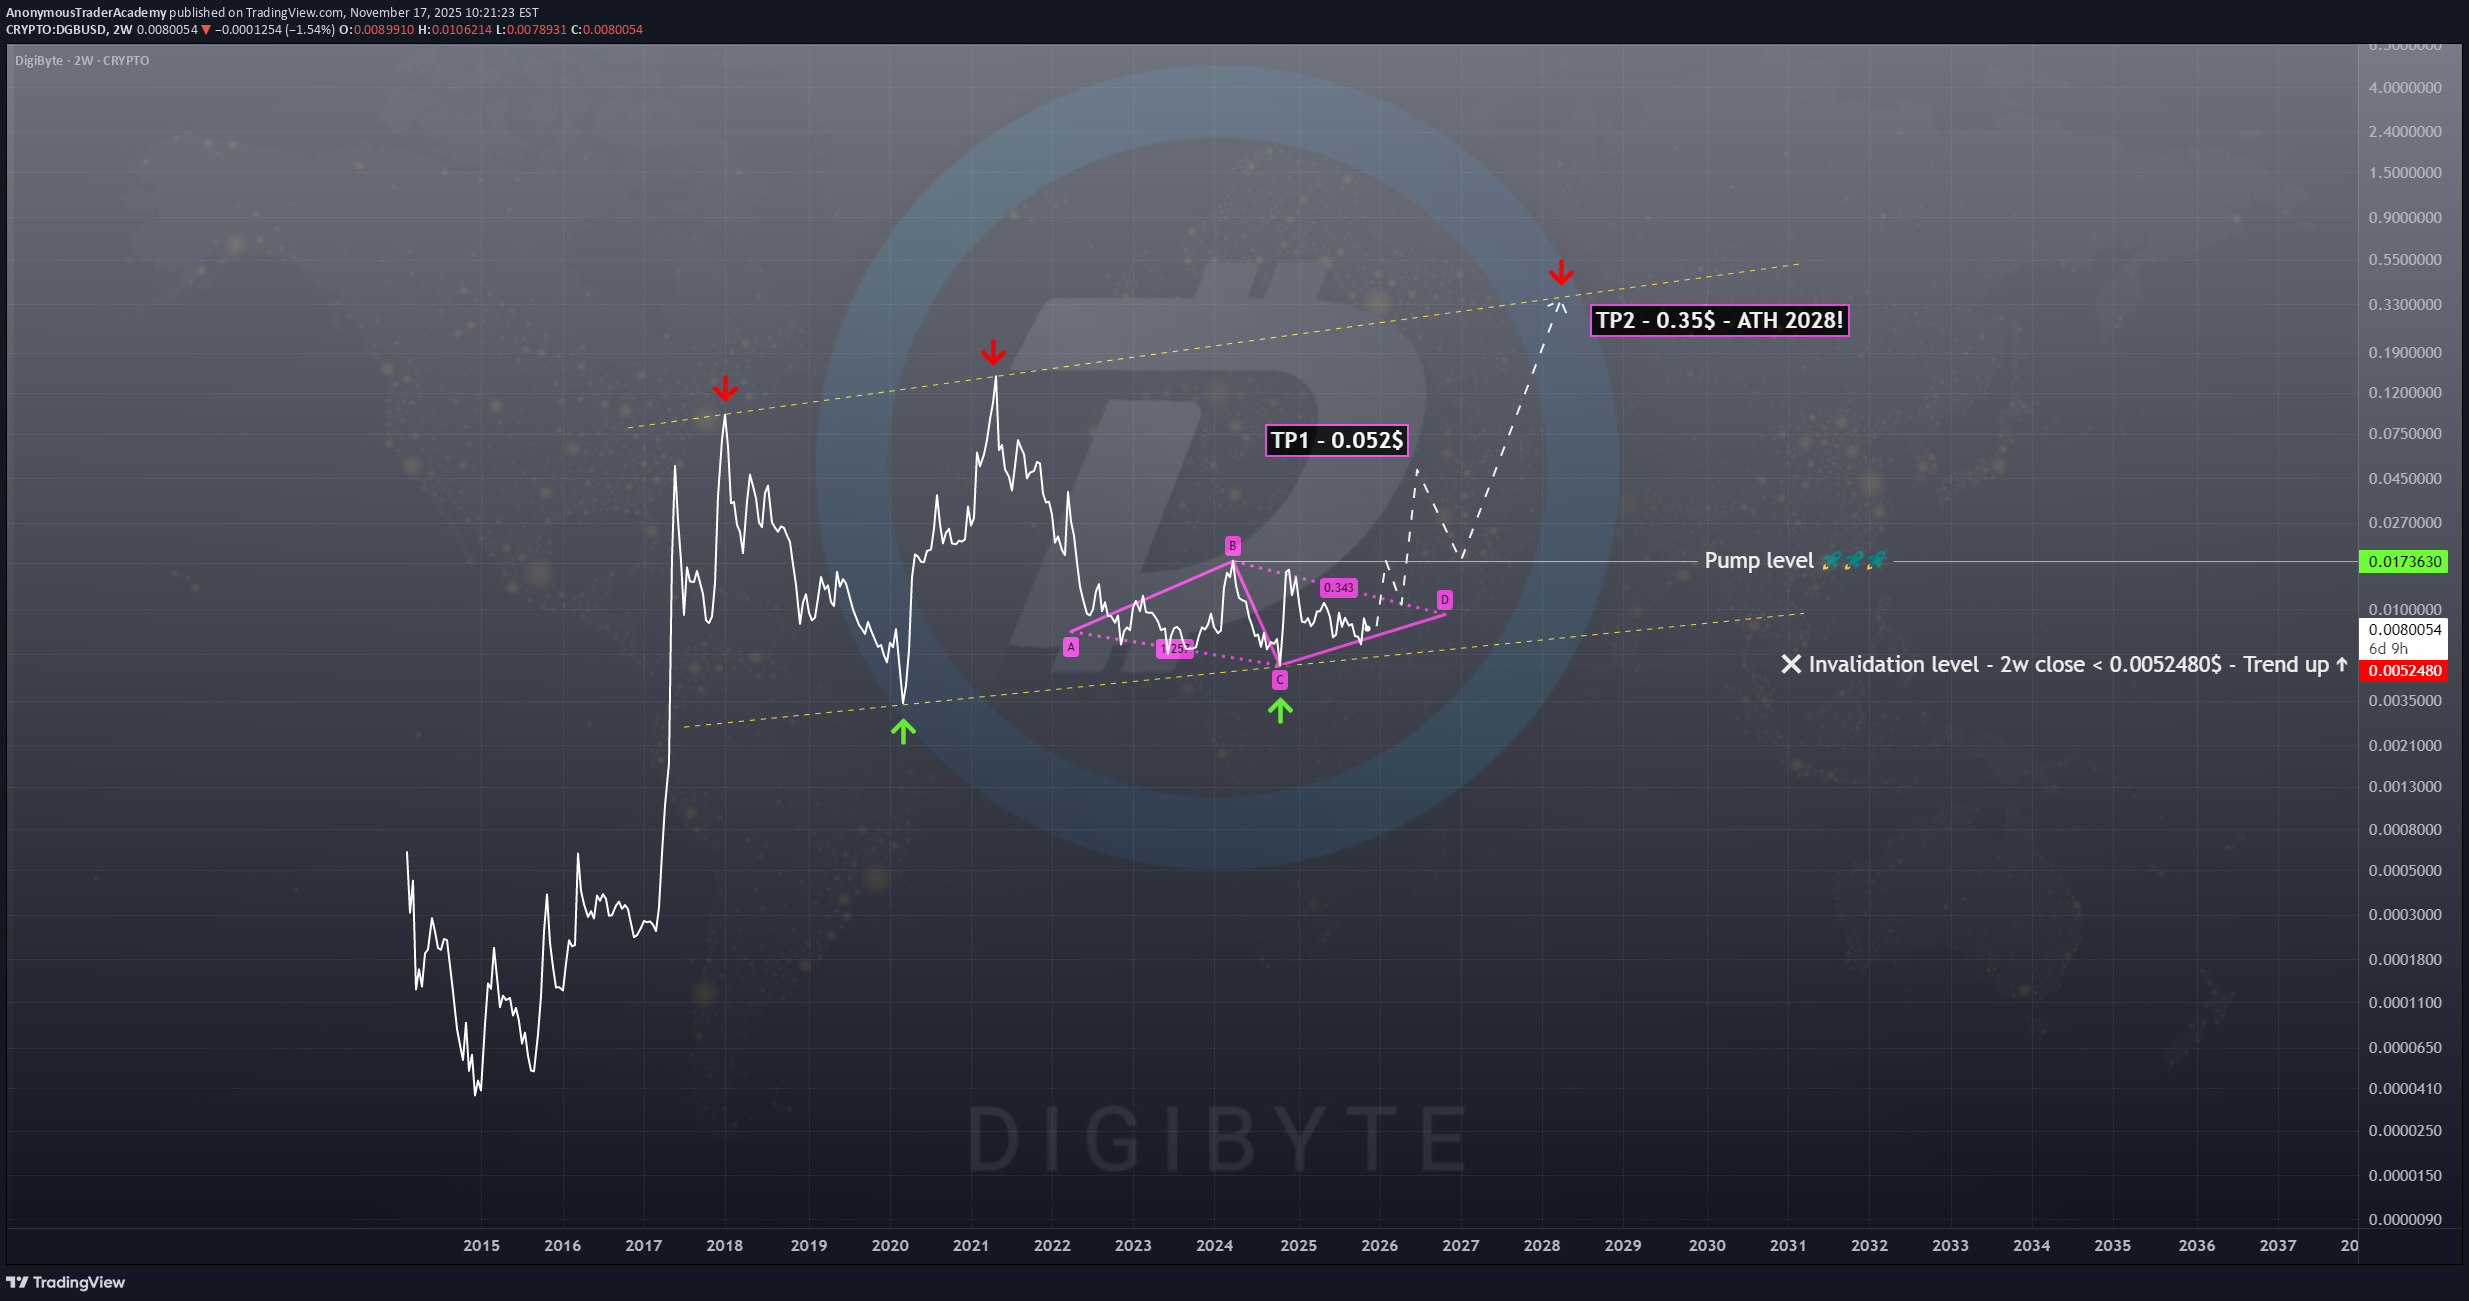
📣 Hello everyone! DigiByte is a fast-growing open source blockchain created in late 2013 and released in early 2014. After 11 years of thoughtful development, DigiByte has become one of the safest, fastest, longest, and most decentralized UTXO blockchains in the world. Starting to use DigiByte is even easier than sending an SMS. You can send and receive DigiBytes using devices that you already know and love. All you need to do is install a DigiByte-supported Wallet, then click scan, scan the QR code, and send DigiByte. As simple as 1..2..3. DigiByte has never been funded through an ICO or through a significant number of pre-minted coins (0% remaining). The project does not have a CEO or a company controlling the DigiByte blockchain. Developers and the community are unpaid volunteers who eliminate the risk of bankruptcy. DigiByte transactions are confirmed within about 15 seconds, which is 40 times faster than Bitcoin and 10 times faster than Litecoin. SegWit allows for up to 1,066 transactions per second within the network, and low fees make DigiByte an ideal currency for daily payments. DigiByte was created based on the non-breakable Bitcoin blockchain technology and various advanced enhancements were implemented, such as DigiShield protection, MultiAlgo mining, and the Odocrypt algorithm. In addition, the Dandelion++ privacy protocol helps protect you by hiding your IP and physical location. To learn more. Compared to 21 million Bitcoins, 21 billion DigiBytes (a ratio to BTC of 1,000 to 1) were designed to be ready for mass adoption. DigiByte block rewards decrease by 1% each month, instead of halving every 4 years. All 21 billion DigiBytes will be mined by 2035. After 2035, miners will rely only on commission fees. DigiByte is not just a fast digital currency. It is an innovative blockchain that can be used for digital assets, smart contracts, decentralized applications, and secure authentication. __________________________________________ Technical information: 1. I believe a 3-year-long Diamond reversal pattern is forming on the chart, and we will soon see confirmation or refutation of my hypothesis! 2. The long-term goal is to test the global trend resistance, which is about 40x of the current price!!! _________________________________________ Total: You can try cautious long-term purchases in installments according to your RM, strengthen your position after the pattern is biased! That's all for today, I wish you good luck in making independent trading decisions and profit. Please analyze the information you receive from me, always think only with your head! Goodbye! ✊
AnonymousTraderAcademy
DASH در آستانه اوج تاریخی؟ چرا اصلاح قیمت اجتنابناپذیر است!
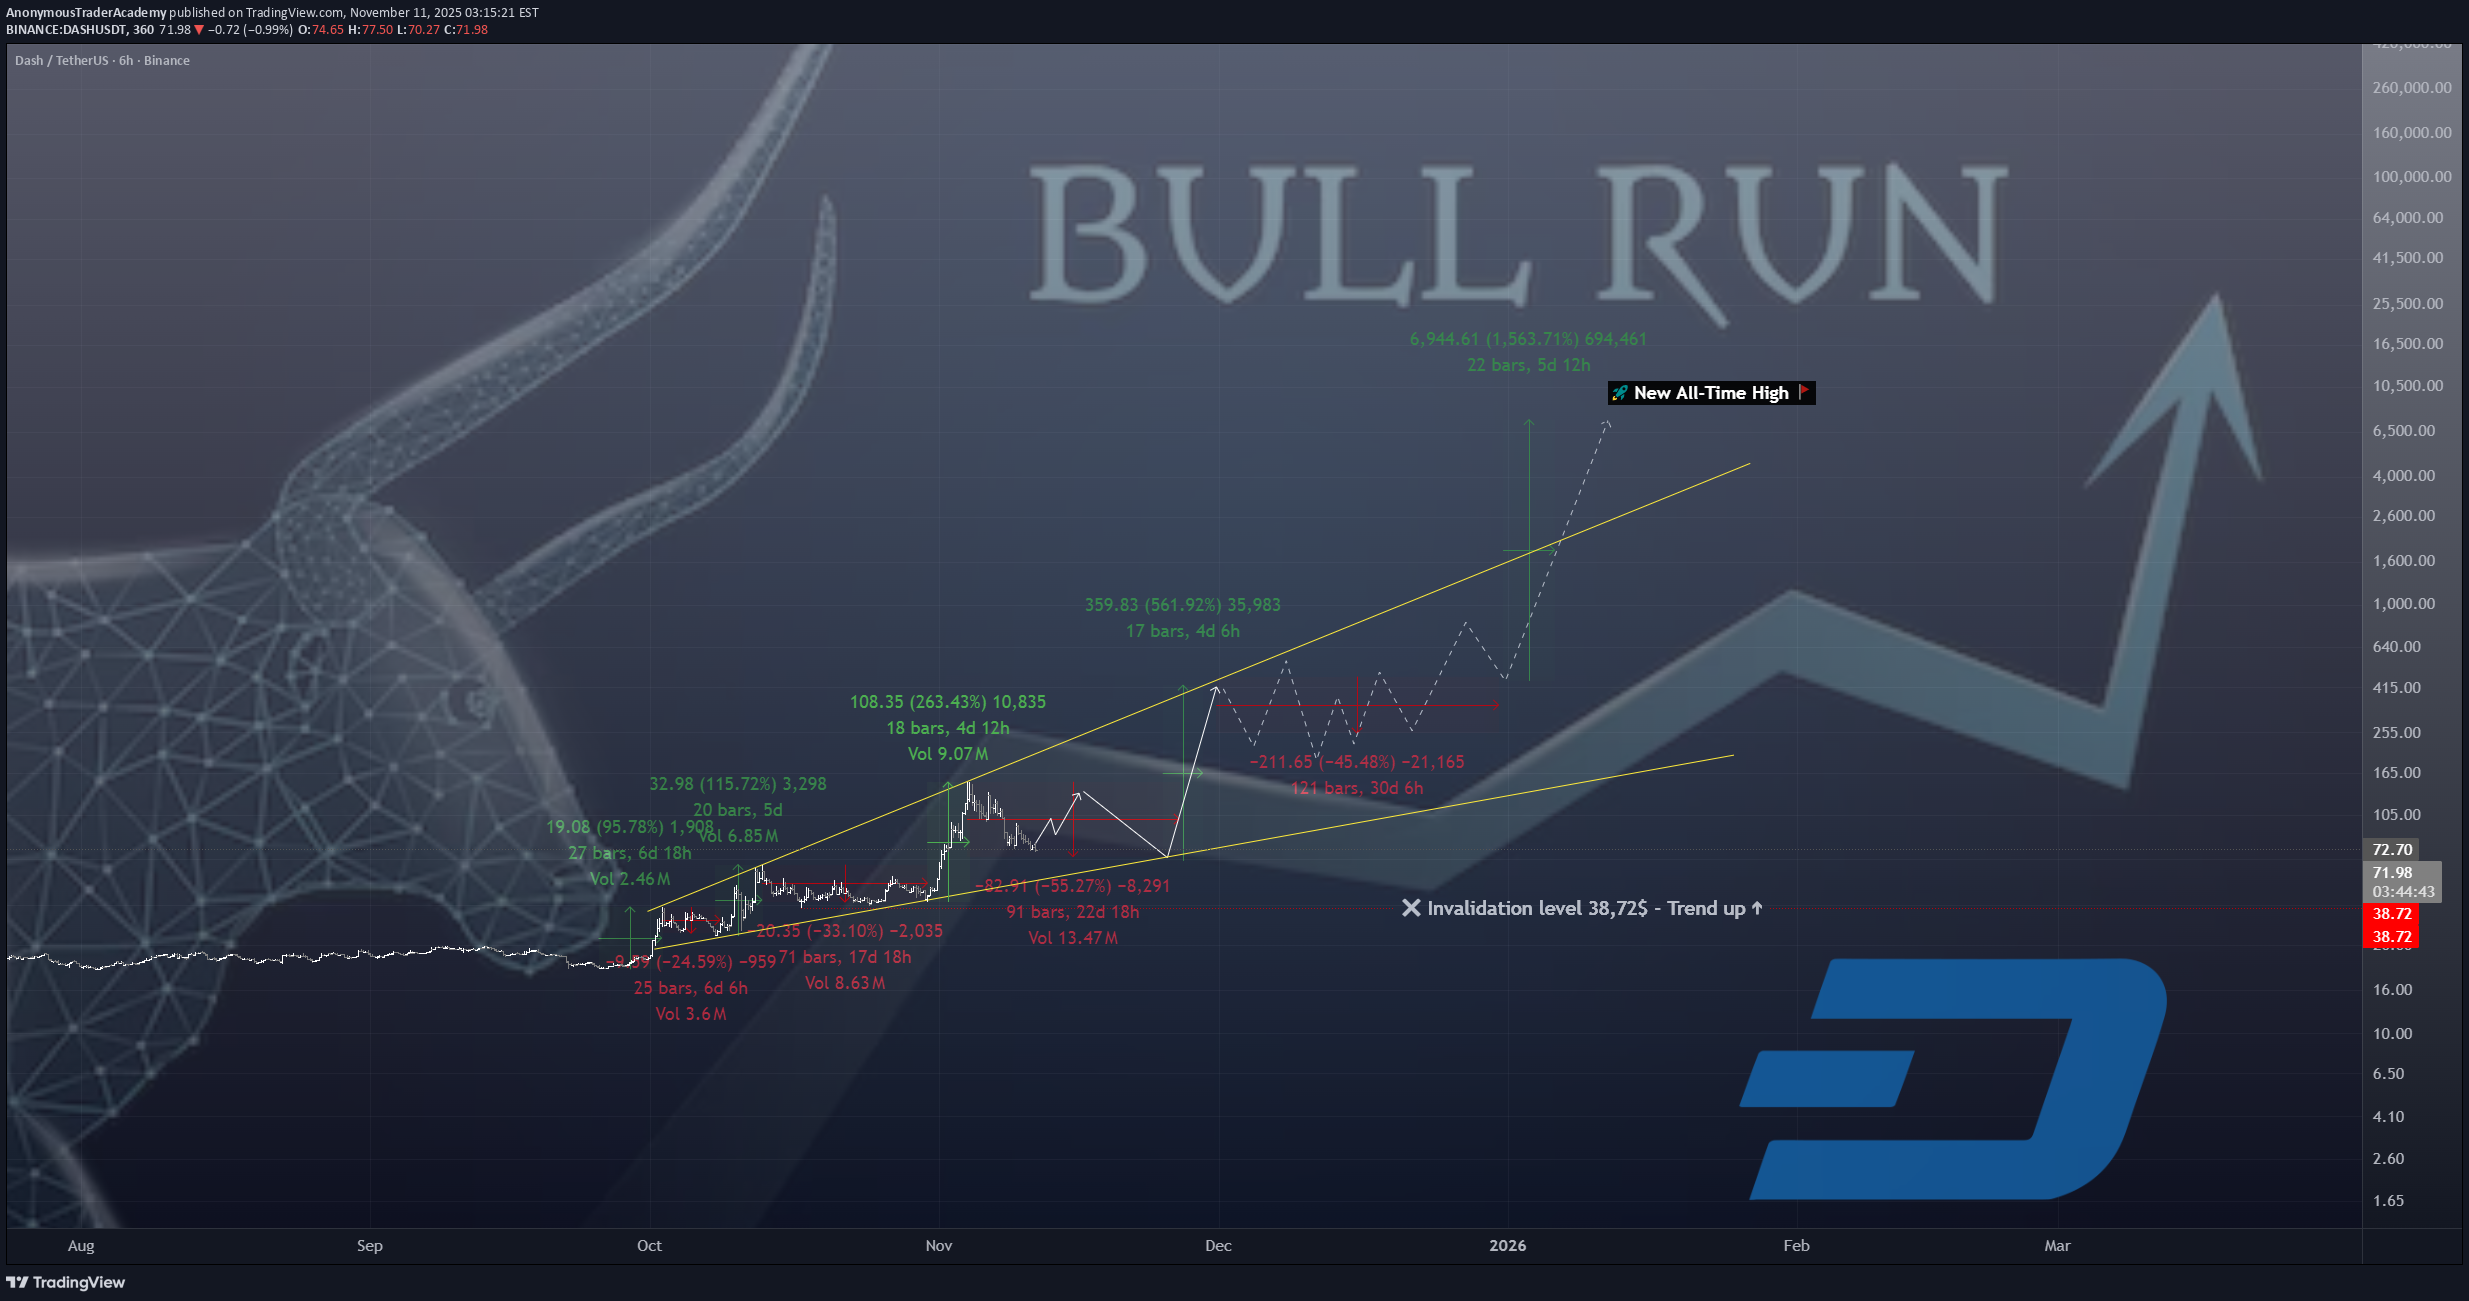
📣 Hello everyone! 1. DASH currently has an ideal bull market structure. Microphases of growth are impulsive and lightning-fast: In September, in 6 days +95%, in October in 5 days + 115%, in November in 5 days +263% The correction microphases grow proportionally over time, which is the absolute norm: 6 days, 17 days, and the current correlation can probably stretch to 21-28 days! 2. If the bull market structure is maintained until the end of 2025, the DASH price may test the 2021 maximum in the region of $476!! _________________________________________ Total: while the minimum of the last consolidation of $ 38.72 has not been violated, I believe that we should remain cautiously optimistic about DASH and give the bulls time to prove themselves once again. I believe that this time we are dealing with a breakdown of the 8-year bearish trend and now is the earliest phase of the long-term bull market in this coin. That's all for today, I wish you good luck in making independent trading decisions and profit. Please analyze the information you receive from me, always think only with your head! Goodbye! ✊
AnonymousTraderAcademy
DASH: آغاز یک بازار گاوی 5 ساله پس از 7 سال رکود! (پیشبینی صعودی تا 500 دلار)

📣 Hello everyone! The private coin sector is experiencing a rapid rise in 2024-2025. Interest in anonymous transactions is returning, and Zcash and Monero have become the growth leaders. - Zcash has grown by 1061% since the beginning of September and has become the main driver of the private coin sector (growth from $38.62 to $448.71) - Monero has been in a steady uptrend since February 2024, with growth of +316% - DASH from October 1 to November 3 soared by an impressive +333% ___________________________________________ The total capitalization of the three oldest anonymous cryptocurrencies (ZEC, XMR, Dash) has exceeded $13 billion, and interest in privacy is rapidly returning! ___________________________________________ From a fundamental point of view, this growth is absolutely understandable to me - in the context of increased government control over digital assets, users are looking for ways to preserve the privacy of their financial transactions. And if XMR has privacy embedded in the code and Monero has been deleted from exchanges in many places, then ZEC and Dash can manage this option. FUNDS, WHALES, AND LARGE INVESTOR PHYSICISTS ARE INCREASINGLY EVALUATING ALTCOINS BASED ON FUNDAMENTAL INDICATORS. THE CRYPTO MARKET IS OVERESTIMATED, WHICH MEANS THAT COINS AND TOKENS THAT STILL DO NOT HAVE A WORKING PRODUCT OR ARE FED ONLY WITH PROMISES WILL EVENTUALLY BE DEVALUED BY -99.99%. BUYBACKS TOKENS ARE ALSO FLOURISHING, SUCH AS THE #BNB DEFLATIONARY MODEL. THIS IS THE INSTITUTIONALIZATION OF CRYPTOCURRENCIES - IN THIS CYCLE OF 2022-2025, THE FOCUS IS NOTICEABLY SHIFTING TO REAL PRODUCTS AND WORKING MODELS THAT HAVE VALUE FOR INVESTORS. (This is great news for veterans of the crypto industry who have proven their usefulness and applicability in the real world, but at the same time it is a very sad bell for meme coins and all kinds of speculative coins with only a beautiful legend) __________________________________________ Technical information: 1. DASH confirms a unique "bullish divergence within the divergence" on the 2H frame. This means that for a very long time we have been observing a strong discrepancy between the dynamics of the price and the indicators of the indicator, and if the instrument is NOT a SCAM, then the culmination will be a potentially sharp trend reversal. I believe that in the next 1-3 months, the DASH price may soar to $500 and test the 2021 high - an important confirmation will be the breakdown of the bullish wedge in November 2025! 2. After rising by 333% in just a month, many speculators are making profits, especially inexperienced retailers - but few people really realize that DASH is likely to start a bull market for the next 5 years after a 7-year correction! 3. Fundamentally, this is an interesting working story, I even downloaded my wallet on iOS and was pleasantly surprised. _________________________________________ Bottom line: I think it's not worth starting to think about a bull or bear market for BTC in 2026 and wondering what will happen to DASH. For example, on October 10, when the entire alta flew to HELL, ZEC performed very well and then increased in price from the lows by more than +230%. From the point of view of TA, after the breakdown of the wedge up and rising to $ 500, there is a <10% chance of seeing the price of $ 20 again, even in a potentially bearish BTC market, from the point of view of TA, I think only with some incredible "Black Swan". That's all for today, I wish you good luck in making independent trading decisions and making a profit. Please analyze the information you receive from me, always think only with your head! Goodbye! ✊
AnonymousTraderAcademy
پیشبینی عجیب بیت کوین تا پایان ۲۰۲۵: مثلث معاملاتی و سقوط غافلگیرکننده!
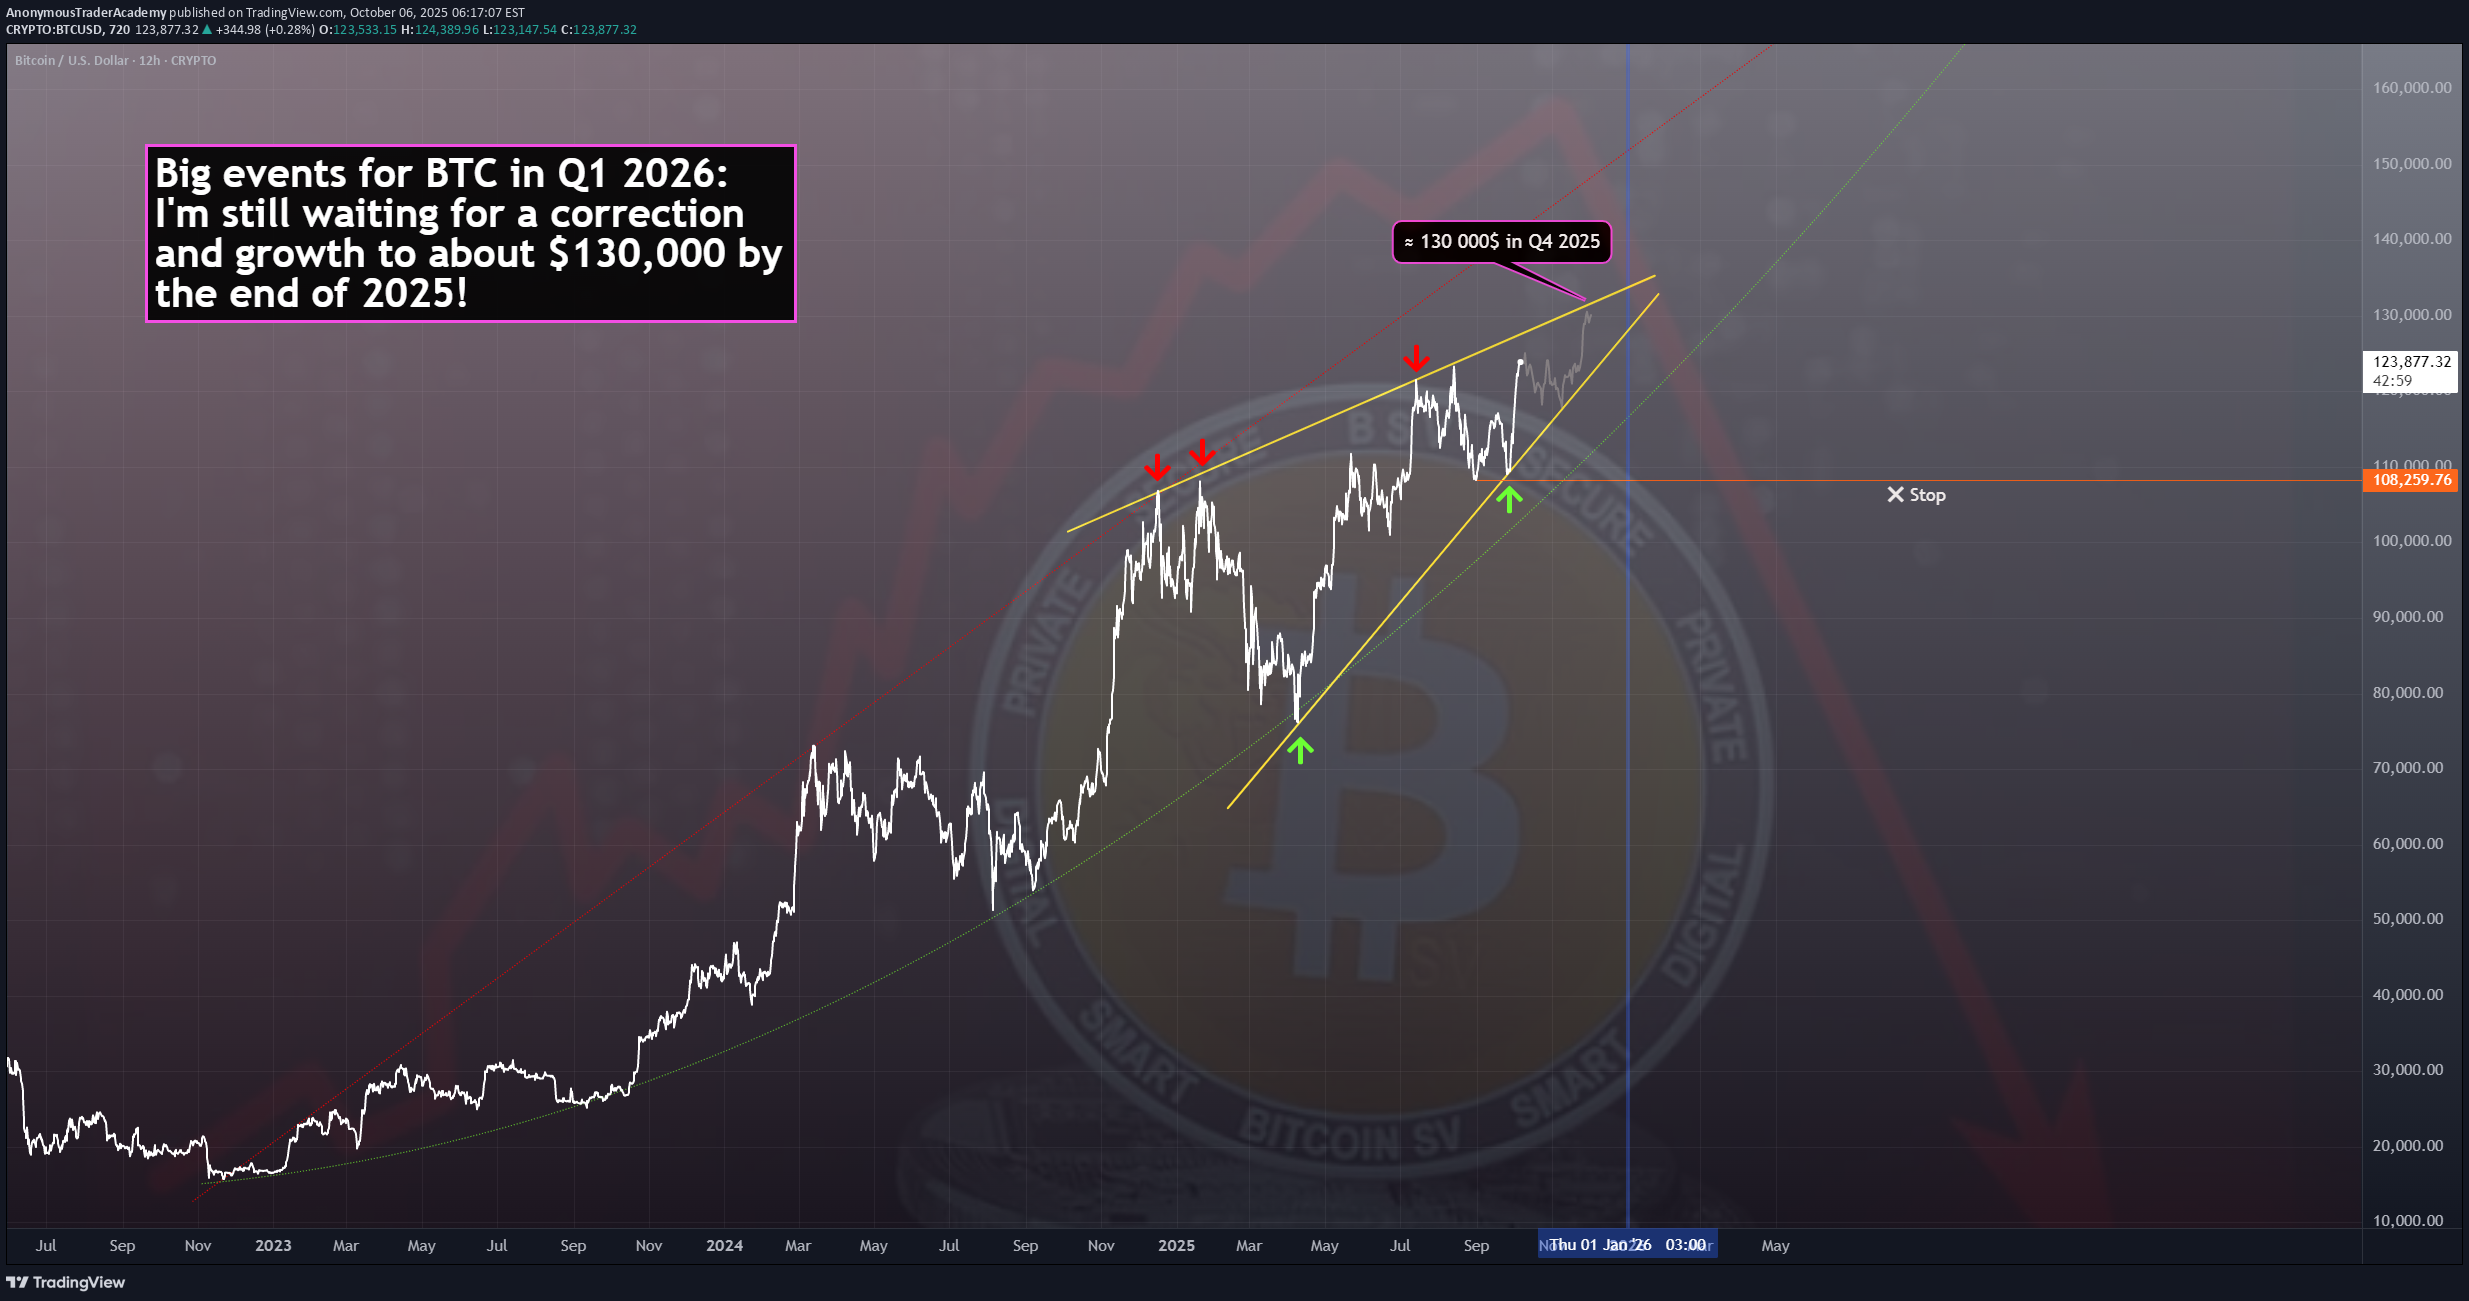
📣 Hello everyone! I bring to your attention my medium-term view until the end of 2025 within the framework of this Bitcoin trading idea solely from the point of view of TA and my understanding of the chart. 🔹 Briefly and to the point: 1️⃣ I believe that Bitcoin's growth in October will be limited and right now the price is already close to local highs. 2️⃣ I expect an unexpected, disappointing drop in the BTC price after the recent ATN upgrade to $125,000 at the beginning of the month. 3. Anyone who flew into a long breakout will be thrown out of the market, many will believe in the beginning of a bear market and prematurely open short positions. 4️⃣ In November-December, I expect another small wave of growth, which will push the price of BTC a little over $130,000 5️⃣ I expect big events for Bitcoin in Q1 2026, but more on that later. That's all for today, I wish you good luck in making independent trading decisions and making a profit. Please analyze the information you receive from me, always think only with your head! Goodbye! ✊
AnonymousTraderAcademy
Bitcoin 1 000 000$ then 0$ !? // A Look into the Future...
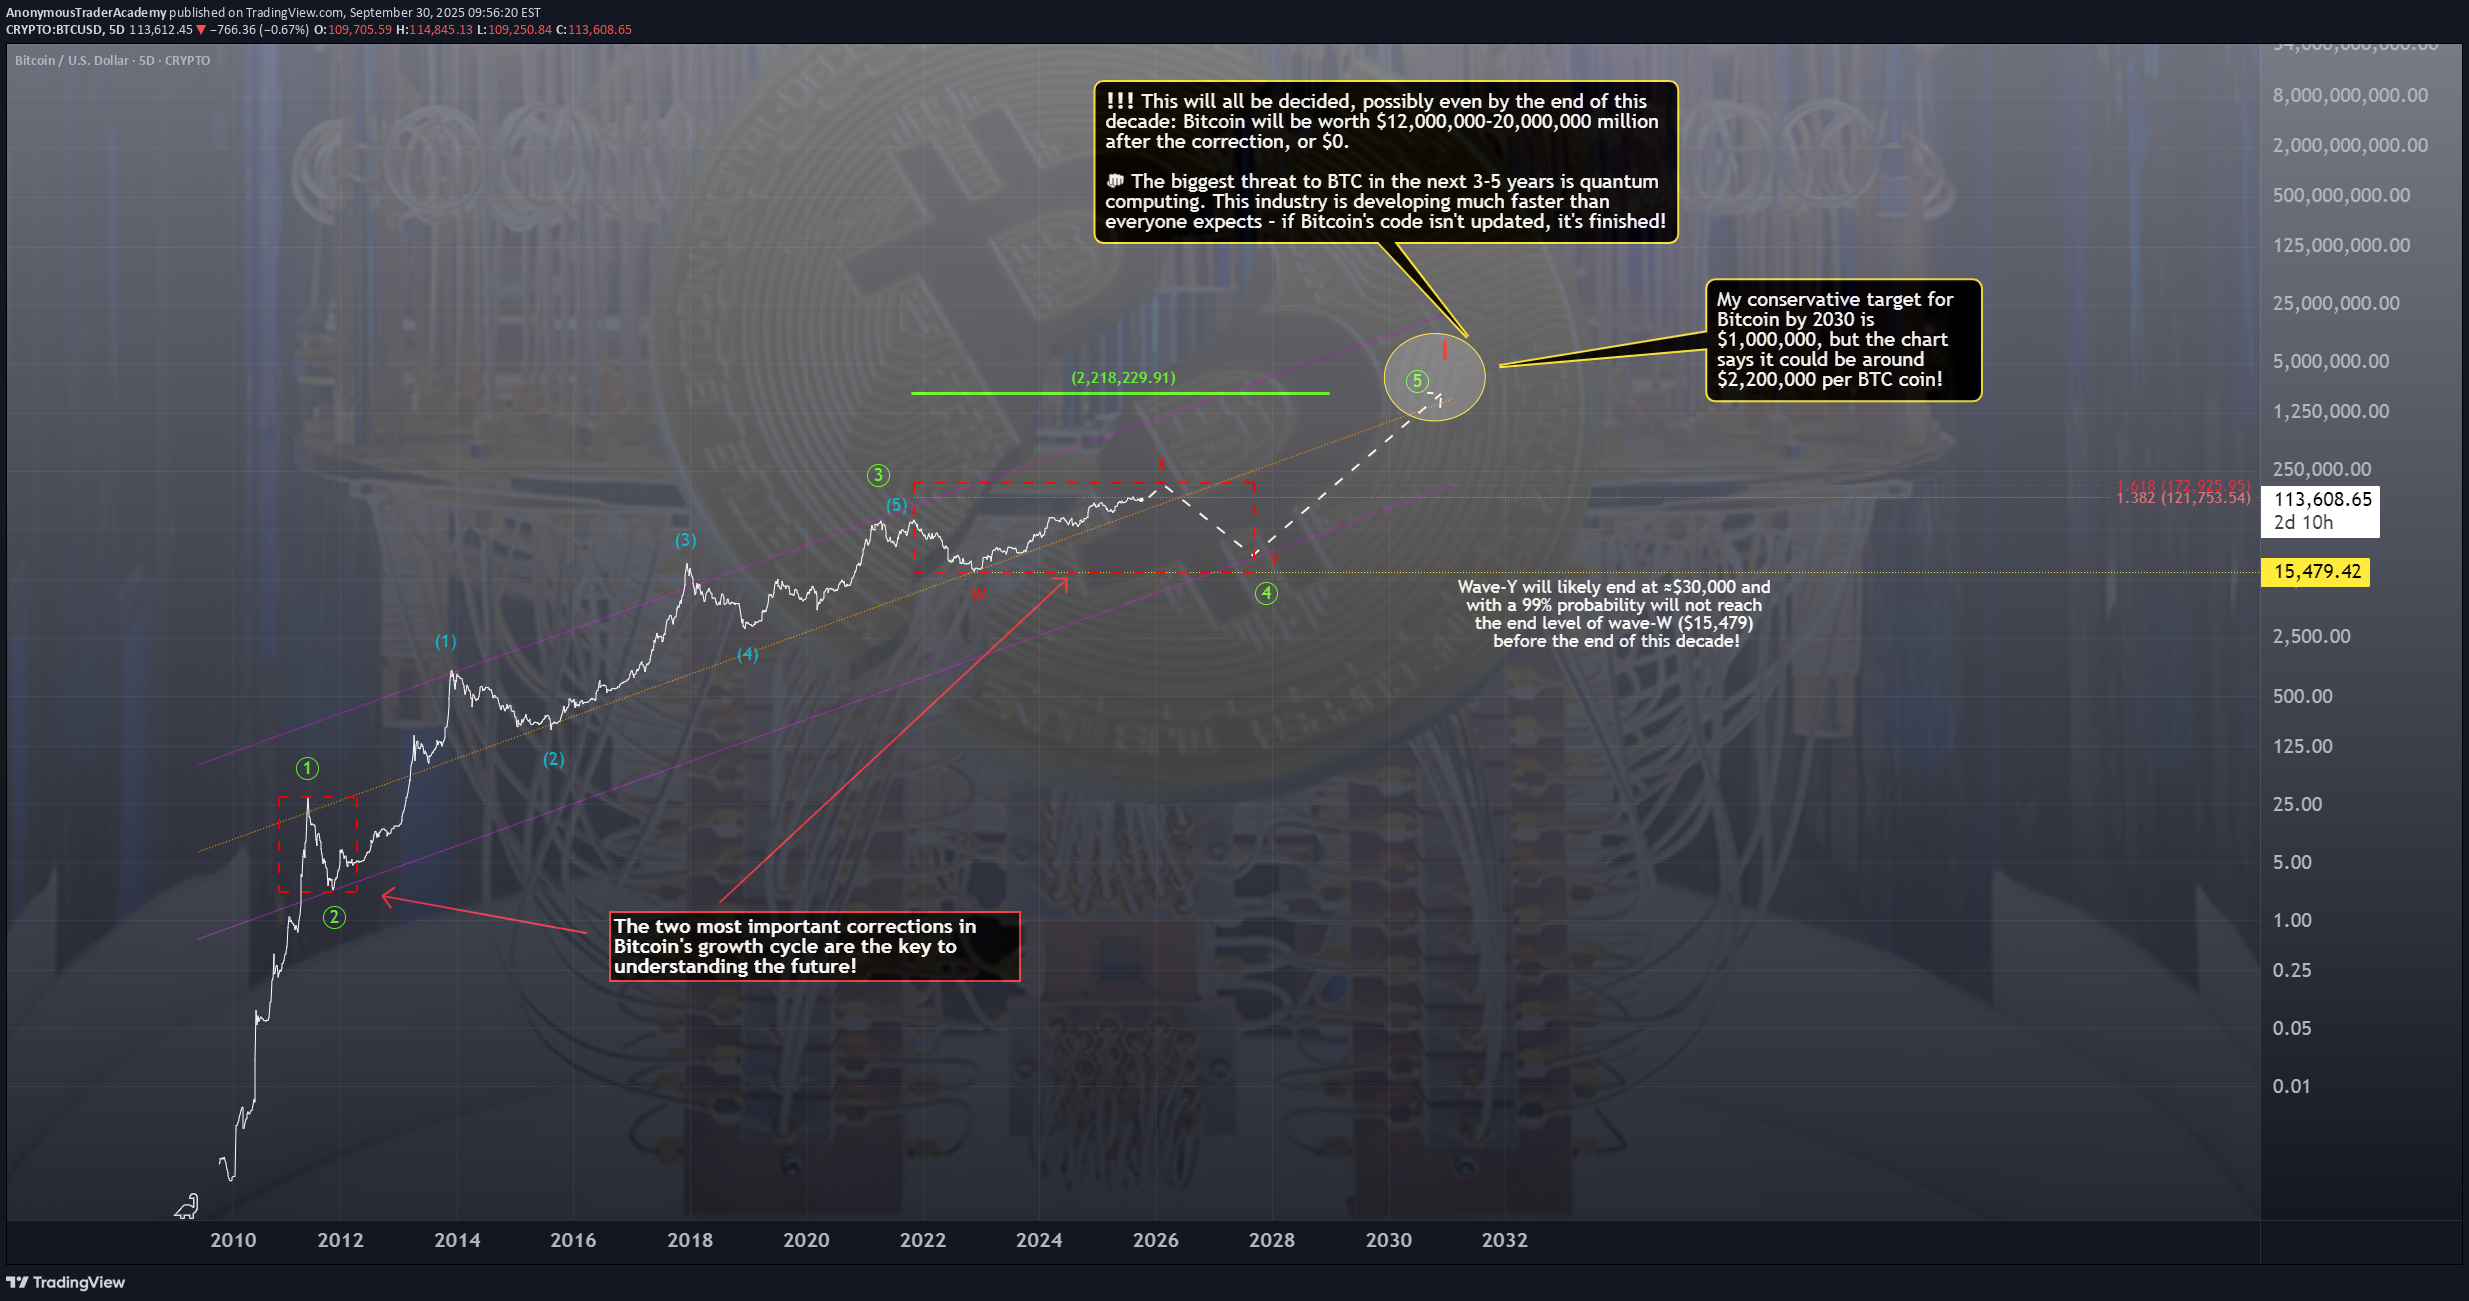
📣 Hello everyone! Here's my Bitcoin trading idea from a FIBORELIOTIAN perspective, very broadly. I won't explain it in detail to anyone; those who understand it will understand. Skeptics, watch from the sidelines. 🔹 Brief explanations: 1️⃣ Globally, Bitcoin is in a continuous impulse growth cycle; the renewal of historical highs in 2024 postpones the deadline for the completion of the cycle to 2030-2032. 2️⃣ It's already clear that the BTC price increase from 2021 to 2025 isn't impulsive. I believe that from 2021 to 2027, it's a WXY correction. This explains why the altcoin market has been dead since 2021 and why BTC is breaking new all-time highs, but there's no euphoria! 3️⃣ There's a 99% chance that Bitcoin's price won't fall below $15,479 by the end of this decade! There's a 75% chance that the Y-wave correction will end in the $30,000-$40,000 range. 4️⃣ After 2027, Bitcoin's price will explode and reach at least $1,000,000 by 2030, and a maximum of $2.2 million! 5️⃣ After the completion of the five-wave impulsive growth cycle, around 2030-2032, the fate of BTC will be decided – will it correct for $12-20 million or go to $0? 🔹 The biggest threat to Bitcoin in the next 3-5 years: The most significant, real, and visible threat to Bitcoin is quantum computing. All industry trends and current achievements demonstrate that it is developing rapidly and poses a real threat to BTC not in 20-30 years, but perhaps even in 1-3-5 years! This is a real challenge for Bitcoin and I don't know how it will cope with it, the network requires a significant upgrade for BTC to become quantum-resistant! ⚠️ That's all I have for today. I wish you good luck in making your own trading decisions and profits. Please analyze the information I give you, and always use your own head! Goodbye! ✊
AnonymousTraderAcademy
XRP - MAGIC RENKO TRIANGLE
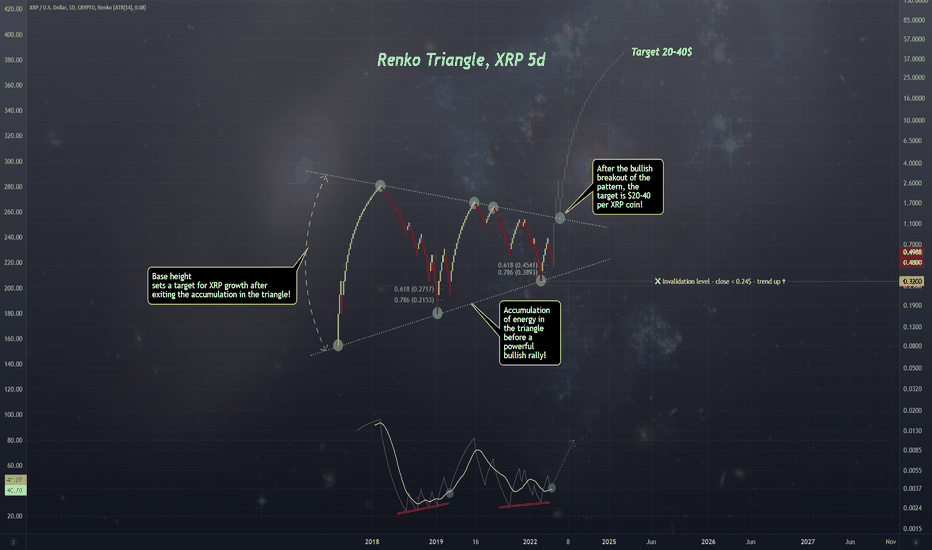
📣 Hello everyone!I bring to your attention my long-term trading idea for XRP: 1️⃣ A long reversal is likely to occur or has already occurred in the 0.38 - 0.46$ zone2️⃣ As soon as we see a bullish breakout of the Renko triangle in my trading idea, the long-term long target automatically becomes in the 20-40$ per coin zone. Growth must be powerful.3️⃣ You can start searching for a long entry point in the 0.38 - 0.46$ zone, or when, after an extreme correction, we see a green rectangle on the Renko chart (close >0.64$) _______________________________❌ Invalidation level - close < 0.24$ - If this happens, we will see a full-bodied bearish close on the Renko chart below the key minimum. In this case, the growth of the asset is postponed indefinitely and this trading idea will be considered invalid! That's all for today, I wish you good luck in making independent trading decisions and profit. Please analyze the information received from me, always think only with your head!Goodbye! ✊
AnonymousTraderAcademy
🔥🔪 Pattern "Cap" | Gravitational waves
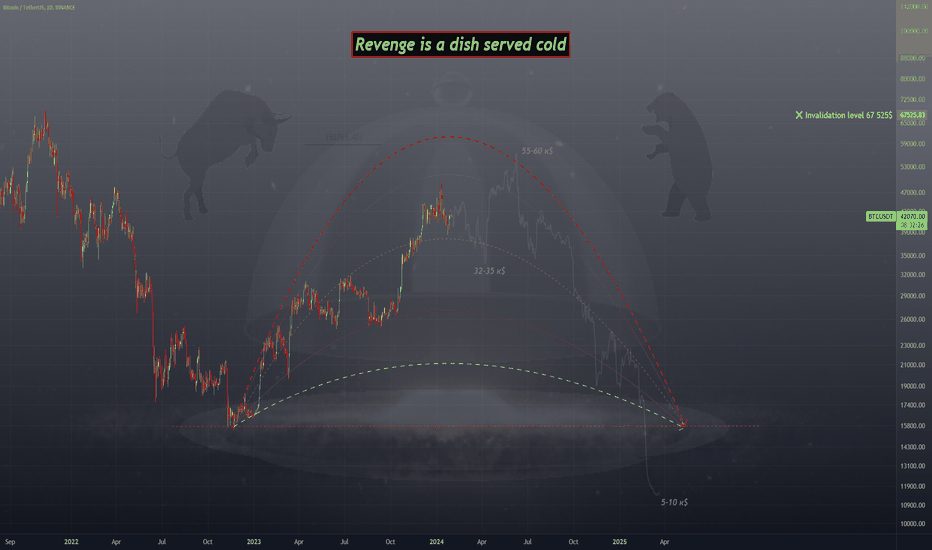
📣 Hello everyone!I bring to your attention my long-term trading idea for Bitcoin. The idea is based on the theory of wave price fluctuations and physics. Price movement with variable acceleration generates gravitational waves, lines of force form extrema.Also, in this trading idea, to make it easier to understand, for the first time I introduce a long-term bearish pattern, which I simply called “CAP”. You are unlikely to find anything like this in books, since this is my personal term. It vaguely resembles a round top, but the internal structure is completely different.1️⃣ Technique:🔹 Fibonacci ratios are not observed throughout the entire uptrend🔹 With great difficulty, you can highlight a stretched impulse wave, neglecting all possible standards.🔹 Alternation between waves 2-4 is not observed.After conducting a deep analysis of the entire upward trend from November 2022 from the point of view of the classical VTE, I came to the conclusion that it has not been applicable to the BTC price chart for the last year and is not working as it should.You can try to pull the classic Elliot onto this trend as much as you like, but you will always have much more alternative scenarios than you would like.There is one simple logical explanation for this - the Bitcoin chart has evolved and moved away from classical technical analysis over the past year, in particular from the generally accepted Fibonacci ratios and the classical Elliott wave theory. Everything is done in order to confuse traders as much as possible and as few people as possible make money on this instrument, and on the cryptocurrency market as a whole.👉 Conclusion: I believe that all the upward movement, the entire growth of BTC from November 2022 DOES NOT HAVE AN IMPULSE STRUCTURE, which means that this entire movement automatically becomes a correction, so that there is nothing inside. This is extremely important.2️⃣ FundamentallyI am a technician and in 95% of cases I consider the price chart first. Only some strong fundamental sudden events can unexpectedly hurt; everything else is already on the schedule.So, making such a prediction in anticipation of the BTC halving in 2024, I thought about what could happen so that the Bitcoin price does not update its ATH and collapses to $10,000? - After all, after the start of a movement, the fundamental is magically located on the technical picture, and it can be anything that you didn’t even suspect before, and neither did I, when making a trading idea. I've been through this dozens, if not hundreds of times over the past 7 years in crypto.In fact, the reason for the increase in the price of Bitcoin now after the adoption of spot BTC-ETFs is the cyclicality and halving of BTC. No matter how much they have distorted the history of BTC, what they have not drawn on price logarithmic charts, but the essence is the same - these are the expectations that this time everything will repeat exactly the same as it was in the past - growth after the BTC halving, at which everything will work with a 99% probabilityThe risks that something could go wrong, as it turns out, are much greater! - Briefly point by point:🔹 The Fed may rush and start cutting interest rates too early, repeating its mistake of the 1970s🔹 Risk of recession in Europe ➡️ Germany is already de facto in recession by the end of 2023.🔹 Risks from Japan ➡️ Collapse of the carry trade in the Japanese Yen🔹 Risks from China ➡️reduction in GDP growth ➡️escalation of the conflict in the Middle East will worsen the situation.🔹 Russia-Ukraine conflict ➡️If US assistance is reduced, Washington’s reputation as a strong and reliable ally will suffer ➡️ The likelihood of new conflicts around the world and the escalation of existing ones will increase🔹 Taiwan factor ➡️ new president is “undesirable” for China- In the event of an armed conflict between China and Taiwan, the potential damage could be estimated at -10% of global GDP (with Covid19 -6%)🔹 Potentially possible return of Donald Trump to the presidency ➡️ Dramatic change in US policy__________________________________⚠️ The information provided is more than enough for you to think and form your own opinion. Remember that your successful trading should not depend on long-term forecasts. The projection of price movement between key reference points on the chart is approximate and should not be exactly repeated in the future, unless one understands this.Think for yourself, decide for yourself - good luck in making independent trading decisions and profits ✊Goodbye!Hello everyone! I expect the local uptrend to reverse from the “magic” Fib 0.618. But as practice shows, the reversal most often occurs between 0.618-0.786.On my chart this is the zone 44,694 - $46,526 - If it doesn’t reverse here, then the price will test the highs of January and we will see $50,000-$52,000, which will not affect my long-term forecast.Hello everybody!I believe that the short-term growth will most likely continue and Bitcoin will update its January high at $48,969.Current price $48,377 - target $50,000 - $52,000. You need to watch further!📣 Hello everyone!In the previous update, the forecast was as follows: Short-term growth will most likely continue and the price of Bitcoin will update its January high at $48,969. Current price $48,377 - target $50,000 - $52,000.____________On Thursday, February 15, Bitcoin set a local high at $52,816 - It is not surprising that Bitcoin met resistance near the extremum curve in the zone of $51,000 - $52,000 and now a sideways consolidation is forming at 4h, exit from which is expected this week .There will be an update in the next post.📣 Hello everyone!I believe it will be difficult for the bulls to move forward further without a proper correction from current levels below $50,000. The probability of a false breakout is increasing; I believe that counter-trend strategies will in the near future be able to bring greater profit than trend ones.⚠️ In any case, whatever scenario Bitcoin chooses now, according to this trading idea of mine, the bullish rally potential should be capped at $61,724 (3% margin of error)Hello everyone!In the last update, the forecast was as follows: "whatever scenario Bitcoin chooses now, according to this trading idea of mine, the potential for a bullish rally should be limited at $ 61,724 (3% margin of error)"The reality is that the price of Bitcoin is rising higher and stronger than I had previously assumed. From $52,000 to $63,000, I was in a long position on BTC, after which I remain out of the market on this instrument. I prefer to wait and take a break now until I see good reasons to continue the long-term growth of the BTC price. All that I am currently observing from the masses is FOMO and the "New Bitcoin Paradigm" after the adoption of ETFs, but as my long-term experience suggests, this happens closer to the top of the bull market than at its beginning or middle. Yes, I didn't earn anything by growing above $63,000, but I didn't lose anything either. I still believe that in the not so distant future, countertrend strategies will be able to bring more profit than trend ones. Altcoins will also be more profitable than Bitcoin. ________________De jure, this trading idea can be considered invalid, since the margin of error of 3% has been exceeded and the level of disability for this trading idea has been broken, namely $67,525________________De facto, I will not close it yet today, since for the third week in a row the trend has been slowing down and at this point in time I see the formation of a reversal pattern on BTC. If this is true, then the new ATH may not be broken for 2-3 years!________________I expect that at least a medium-term peak will be formed within one month from today's update, otherwise THIS TRADING IDEA WILL LOSE ITS MEANING AND WILL BE CLOSED. May prudence be with you - Observe RM and, as always, I wish you good luck in making independent trading decisions! Goodbye!📣 Hello everyone!In the last update, the forecast was as follows: "I expect that at least a medium-term peak will be formed within one month from today's update, otherwise THIS TRADING IDEA WILL LOSE ITS MEANING AND WILL BE CLOSED"_______________A little over a month has passed and to date we have not seen any progress in the movement of the Bitcoin price. The assumption about the formation of the peak is currently impossible to confirm or deny - it will take even more time.⚡️ The confirmation of the top will be a confident breakdown of support in the area of 60 000$. Within the framework of this trading idea, the historical level of 61 724$ is indicated, and I will refer to it further - a confident breakdown down this level in April-May will confirm the validity of this trading idea.❌ If the price exceeds the level of 73 777$ - this trading idea will be considered invalid and will be closed - I will be forced to significantly reconsider my long-term views regarding Bitcoin.⚠️ May prudence be with you - Observe RM and, as always, I wish you good luck in making independent trading decisions!Goodbye!Hello everyone!In the last update, the forecast was as follows: " Confirmation of the top will be a confident breakdown of support in the area of $ 60,000. Within the framework of this trading idea, the historical level of $ 61,724 is indicated, and I will refer to it further - a confident breakdown down this level in April-May will confirm the validity of this trading idea."_______________Last week was the first to close below the previously indicated key level of $61,724. The top is formed by 65% - the next important significant step will be a bearish breakout of the round psychological level of $ 60,000, this movement should be the largest and fastest since March 2024.If the price exceeds the level of $ 73,777 by even one tick - this trading idea will be considered invalid and will be closed - I will be forced to significantly reconsider my long-term views regarding Bitcoin.May prudence be with you - Observe RM and, as always, I wish you good luck in making independent trading decisions!Goodbye!Hello everyone!In the last update, the forecast was as follows: "The top is formed by 65% - the next important significant step will be a bearish breakthrough of the round psychological level of $ 60,000, this movement should be the largest and fastest since March 2024."_______________Confirmation in the form of a confident bearish break below $ 60,000 was not received! Now the third test of the extreme curve is the price is close to the level of disability of $ 73,777. In my understanding, a strong medium-term trend should start from here. Further major movement will be determined by small frames in the near future, it is necessary to proceed to the point of entry into the market. As soon as a short/long setup is formed, I will speculatively enter either side again. If the price exceeds the level of $ 73,777 by even one tick - this trading idea will be considered invalid and will be closed - I will be forced to significantly reconsider my long-term views regarding Bitcoin.May prudence be with you - Observe RM and, as always, I wish you good luck in making independent trading decisions!Goodbye!📣 Hello everyone!Two weeks have already passed since the last update, this time was enough for the price to move into a confident downward trend, but this did not happen. When there is a price-time projection, and we do not see the desired condition, we should expect the start of consolidation. Bitcoin will enter the summer months and I believe that the broad flat zone of $56,000 - $74,000 will be the final choice for this time. _______________Since the price fall has not started, the upper boundary model has already been washed out sideways, and there is no point in pursuing this trading idea further and it is closed.See you in new trading ideas! Goodbye!
AnonymousTraderAcademy
5000$ GOLD - HAVE TIME TO BUY IT!
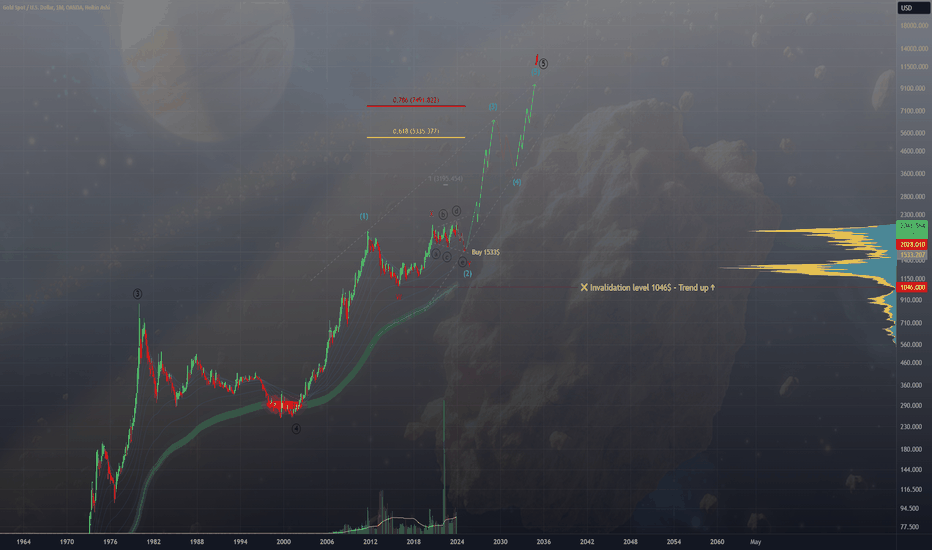
📣 Hello everyone! Here is my updated long-term trading idea for gold, time frame 1 month. At the maximum in 2025, I expect to see a final decline to the level of 1533$ in wave-E of the expanding triangle ABCDE at the minute wave level, after which a reversal and a long upward trend to the price zone of 5335 - 7491$ per ounce of gold. I'm thinking of buying gold at about 1500$ per ounce, this will be the last opportunity to buy so cheap! At the peak of the cycle by 2035, gold will cost about 10 000$ per ounce and have a market capitalization of more than $60 trillion. ❌ Invalidation level - 1046$ ⚠️ As always, I wish you good luck in making independent trading decisions and profit ✊ Goodbye!
AnonymousTraderAcademy
BTC UNTIL 2024 IN THE PAWS OF BEARS! CALM DOWN!
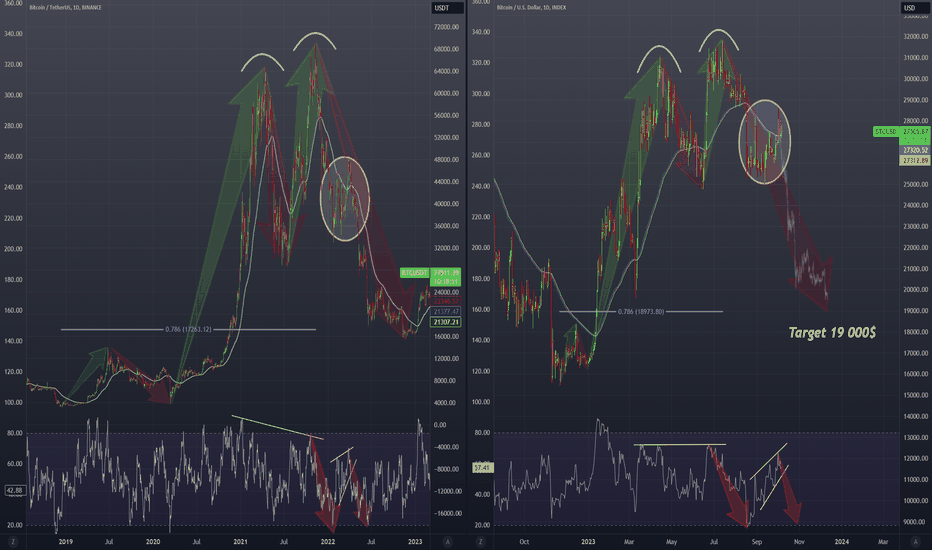
BTC UNTIL 2024 IN THE PAWS OF BEARS! CALM DOWN! Hello everyone! I will be laconic. Until today, the Bitcoin price repeats the 2018-2022 cycle, respectively, after it fails under the EMA, the goal will be a breakdown of support in the area of 25 000$ After the support in the area of 25 000$ is broken, my target is 0.786 fibo. That is, the round 20 000$, which everyone has already forgotten about, we can still see. After the goal is achieved, this trading idea is considered invalid, as well as when fixing above 30 000$. I believe the local extremum has already been set, so even 29 000$ is already unlikely, we must now push down and implement a "bull trap" with bull liquidations up to the 2nd shoulder. ⚠️ Everything is on the chart 👀 - Good luck in making independent trading decisions and profit! Goodbye!
AnonymousTraderAcademy
Disclaimer
Any content and materials included in Sahmeto's website and official communication channels are a compilation of personal opinions and analyses and are not binding. They do not constitute any recommendation for buying, selling, entering or exiting the stock market and cryptocurrency market. Also, all news and analyses included in the website and channels are merely republished information from official and unofficial domestic and foreign sources, and it is obvious that users of the said content are responsible for following up and ensuring the authenticity and accuracy of the materials. Therefore, while disclaiming responsibility, it is declared that the responsibility for any decision-making, action, and potential profit and loss in the capital market and cryptocurrency market lies with the trader.