
Anakyn
@t_Anakyn

What symbols does the trader recommend buying?
Purchase History
پیام های تریدر
Filter
Anakyn
WIF/USD * Daily TF EWP TC FIB Analysis

Analysis of WIF/USD Chart Using Elliott Wave Theory1.Elliott Wave Count & Structure:The chart follows a clear Elliott Wave multi zigzag structure.The impulse wave peaked at around $4.86, marking a significant high.The correction followed in a three-wave ABC structure, which seems to have found support at a key Fibonacci level (0.618 - 0.65 retracement).2.Trend Channel & Key Support Levels:A parallel trend channel is visible, where price has bounced off the lower boundary, indicating strong support. Key support zone around 55¢, which aligns with the lower boundary of the trend channel.3.Potential Price Targets & Future Projections:The bullish scenario suggests a Wave Y target above $30 (potentially $36).The large green box in the upper right suggests a potential high-reward zone, likely driven by a new impulse wave (Wave Y).4.RSI Indicator & Momentum Shift:RSI was previously oversold but is now turning upwards, indicating potential momentum recovery. A break above the 50 RSI level would confirm bullish continuation.According to cryptonews.com : The biggest meme coin sensation in 2024!Be careful with meme coinsSo let you guide by BTC and VIX if you want to invest in this coin.
Anakyn
$META PLATFORMS * EWP TC FIB MONTHLY TF ANALYSIS
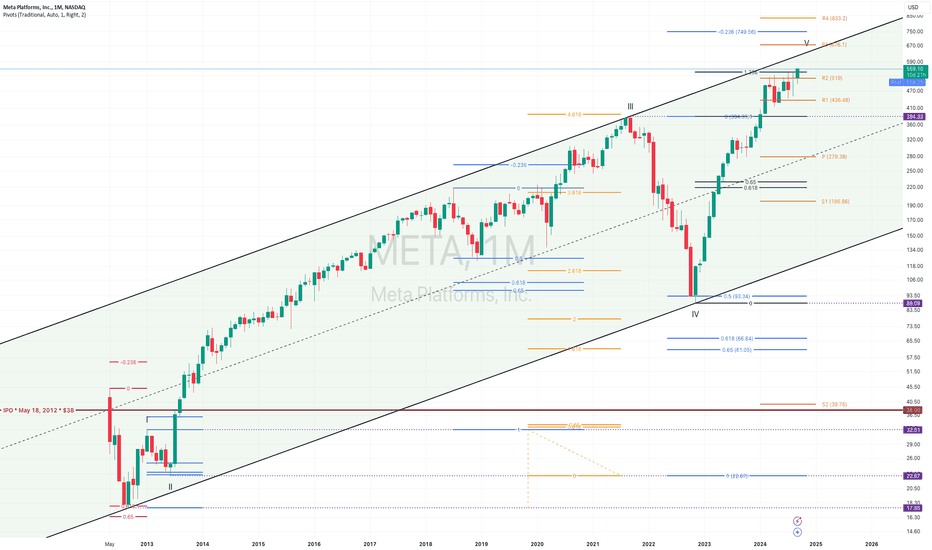
Given that the stock is near the upper trendline and within Wave V, there could be limited upside left in the current cycle. A few possibilities: 1. Continuation to Upper Resistance: META could continue pushing higher, potentially towards the $676 range (upper channel boundary), but likely face strong resistance. 2. Correction After Wave V: Once Wave V completes, a corrective phase (possibly Wave A) could begin. The correction might test lower Fibonacci levels around 380 USD or even lower, depending on market conditions. 3. Long-term bullish trend: Even if a correction occurs, as long as the price remains within the channel and above the support trendline, the long-term uptrend remains intact. In short, a potential small upside to complete Wave V is possible, followed by a corrective phase. Keep an eye on how the price behaves near key Fibonacci resistance levels.
Anakyn
BCH/USD * BITCOIN CASH - EWP FIB TC BIWEEKLY TF ANALYSIS

Given the current wave structure, BCH appears to have completed a significant WXY multi-zigzag downward correction, and it might now be in a upward phase within the green channel.If BCH continues upward, it could challenge the next resistance zone around $664 or higher, especially if it maintains its trajectory within the green bullish channel.Alternatively, a break below the green channel would signal a potential return to lower levels, with $245 or even $175 acting as intermediate support points before any retest of $88.
Anakyn
ETC/ USD * Ethereum Classic - EWP FIB TC WEEKLY TF ANALYSIS

The RSI on the lower part of the chart, currently around 39, indicating a slightly oversold condition. This suggests the market could be near a potential bottom, but further confirmation is needed.If this ABC correction holds, the price might find support near the 0.786 Fibonacci level ($15.65) or the lower boundary of the channel. This could signal the end of the corrective phase and the start of a new upward movement (Wave 1 of a new cycle). Alternatively, if price breaks below these support levels, it could suggest further downside, extending the correction.
Anakyn
MATIC POLYGON * WEEKLY TF EWP TC FIB ANALYSIS

The chart provided is an Elliott Wave analysis applied to the price action of the cryptocurrency MATIC, on the Polygon network, in a weekly time frame:1. Elliott Wave Structure•The chart shows a corrective pattern (denoted as A-B-C or W-X-Y), which is a retracement in an overall bullish market.•The price action is nearing the end of a corrective wave (Y), with a potential reversal point forming in the orange box.2. Channels and Trendlines•The price movement is contained within a corrective channel.•The long-term trend is shown by the upward green channel, indicating that after the correction, a return to a bullish movement is expected.3. Fibonacci Levels•Multiple Fibonacci retracement levels are drawn on the chart to guide potential support and resistance zones.•The 0.5, and 0.618 Fibonacci levels are significant for both resistance and support, with prices currently near the 0.618 level.•The price is also interacting with a pivot zone (shown by the orange labels), and could potentially reach the P level at $0.446 before bouncing.4. RSI (Relative Strength Index)•The RSI indicator at the bottom shows the market is nearing oversold territory (below 40), indicating that the selling pressure may be exhausting and a bounce could be imminent.5. Price Target•The a curved arrow at the bottom indicating a bullish reversal potential, suggesting that after this final leg down, the price could shoot back up to the previous highs and beyond.•The upper target for a bullish breakout seems to be around the $2.714 level, based on previous wave (B) highs, with an extension potentially aiming toward the $5 level and beyond.6. Support Zones•The orange box (around $0.191 to $0.26) represents a critical support area, where a reversal might happen.•If the price fails to hold this zone, the next support level is around $0.0454, which appears to be the ultimate bottom level of the correction.Conclusion:This chart suggests that the current corrective phase is nearing completion, and there is a strong possibility of a bullish reversal from the $0.191-$0.26 support zone. If this area holds, the price is projected to rally upwards, potentially targeting $2.7 and beyond in the next impulsive move.
Anakyn

Anakyn

Anakyn

COTI / USD * Daily Elliott Wave Principle Fibonacci Trend-Channel analysis.1-2-1-2 set up ready.
Anakyn
DASH / USD * weekly EWP FIB TC analysis

DASH / USD * Weekly Elliott Wave Principle Fibonacci Trend-Channel analysis
Anakyn
GOLD / USD * CFDs * H4 * EWP FIBO TC analysis

GOLD / USD * Futures * 4 Hour Elliott Wave Principle Fibonacci Trend-Channel analysis
Disclaimer
Any content and materials included in Sahmeto's website and official communication channels are a compilation of personal opinions and analyses and are not binding. They do not constitute any recommendation for buying, selling, entering or exiting the stock market and cryptocurrency market. Also, all news and analyses included in the website and channels are merely republished information from official and unofficial domestic and foreign sources, and it is obvious that users of the said content are responsible for following up and ensuring the authenticity and accuracy of the materials. Therefore, while disclaiming responsibility, it is declared that the responsibility for any decision-making, action, and potential profit and loss in the capital market and cryptocurrency market lies with the trader.