POL
پالیگان
| تریدر | نوع سیگنال | حد سود/ضرر | زمان انتشار | مشاهده پیام |
|---|---|---|---|---|
 SwallowAcademyرتبه: 30658 | خرید | حد سود: تعیین نشده حد ضرر: تعیین نشده | ۱۴۰۴/۹/۱۰ |
نمودار قیمت پالیگان
سود ۳ ماهه :
خلاصه سیگنالهای پالیگان
سیگنالهای پالیگان
فیلتر
مرتب سازی پیام براساس
نوع پیام
نوع تریدر
فیلتر زمان

SwallowAcademy

SwallowAcademy
Polygon (POL): Once We Go For Reversal.....Get Ready!

ممکن است خیلی زود یک معکوس خوب اتفاق بیفتد، با چندین نشانه که ما را سر به زیر می کند. ببینیم! اطلاعات عمیق تر در ویدیو موجود است - لذت ببرید! آکادمی پرستو
POL/USDT — Market Structure
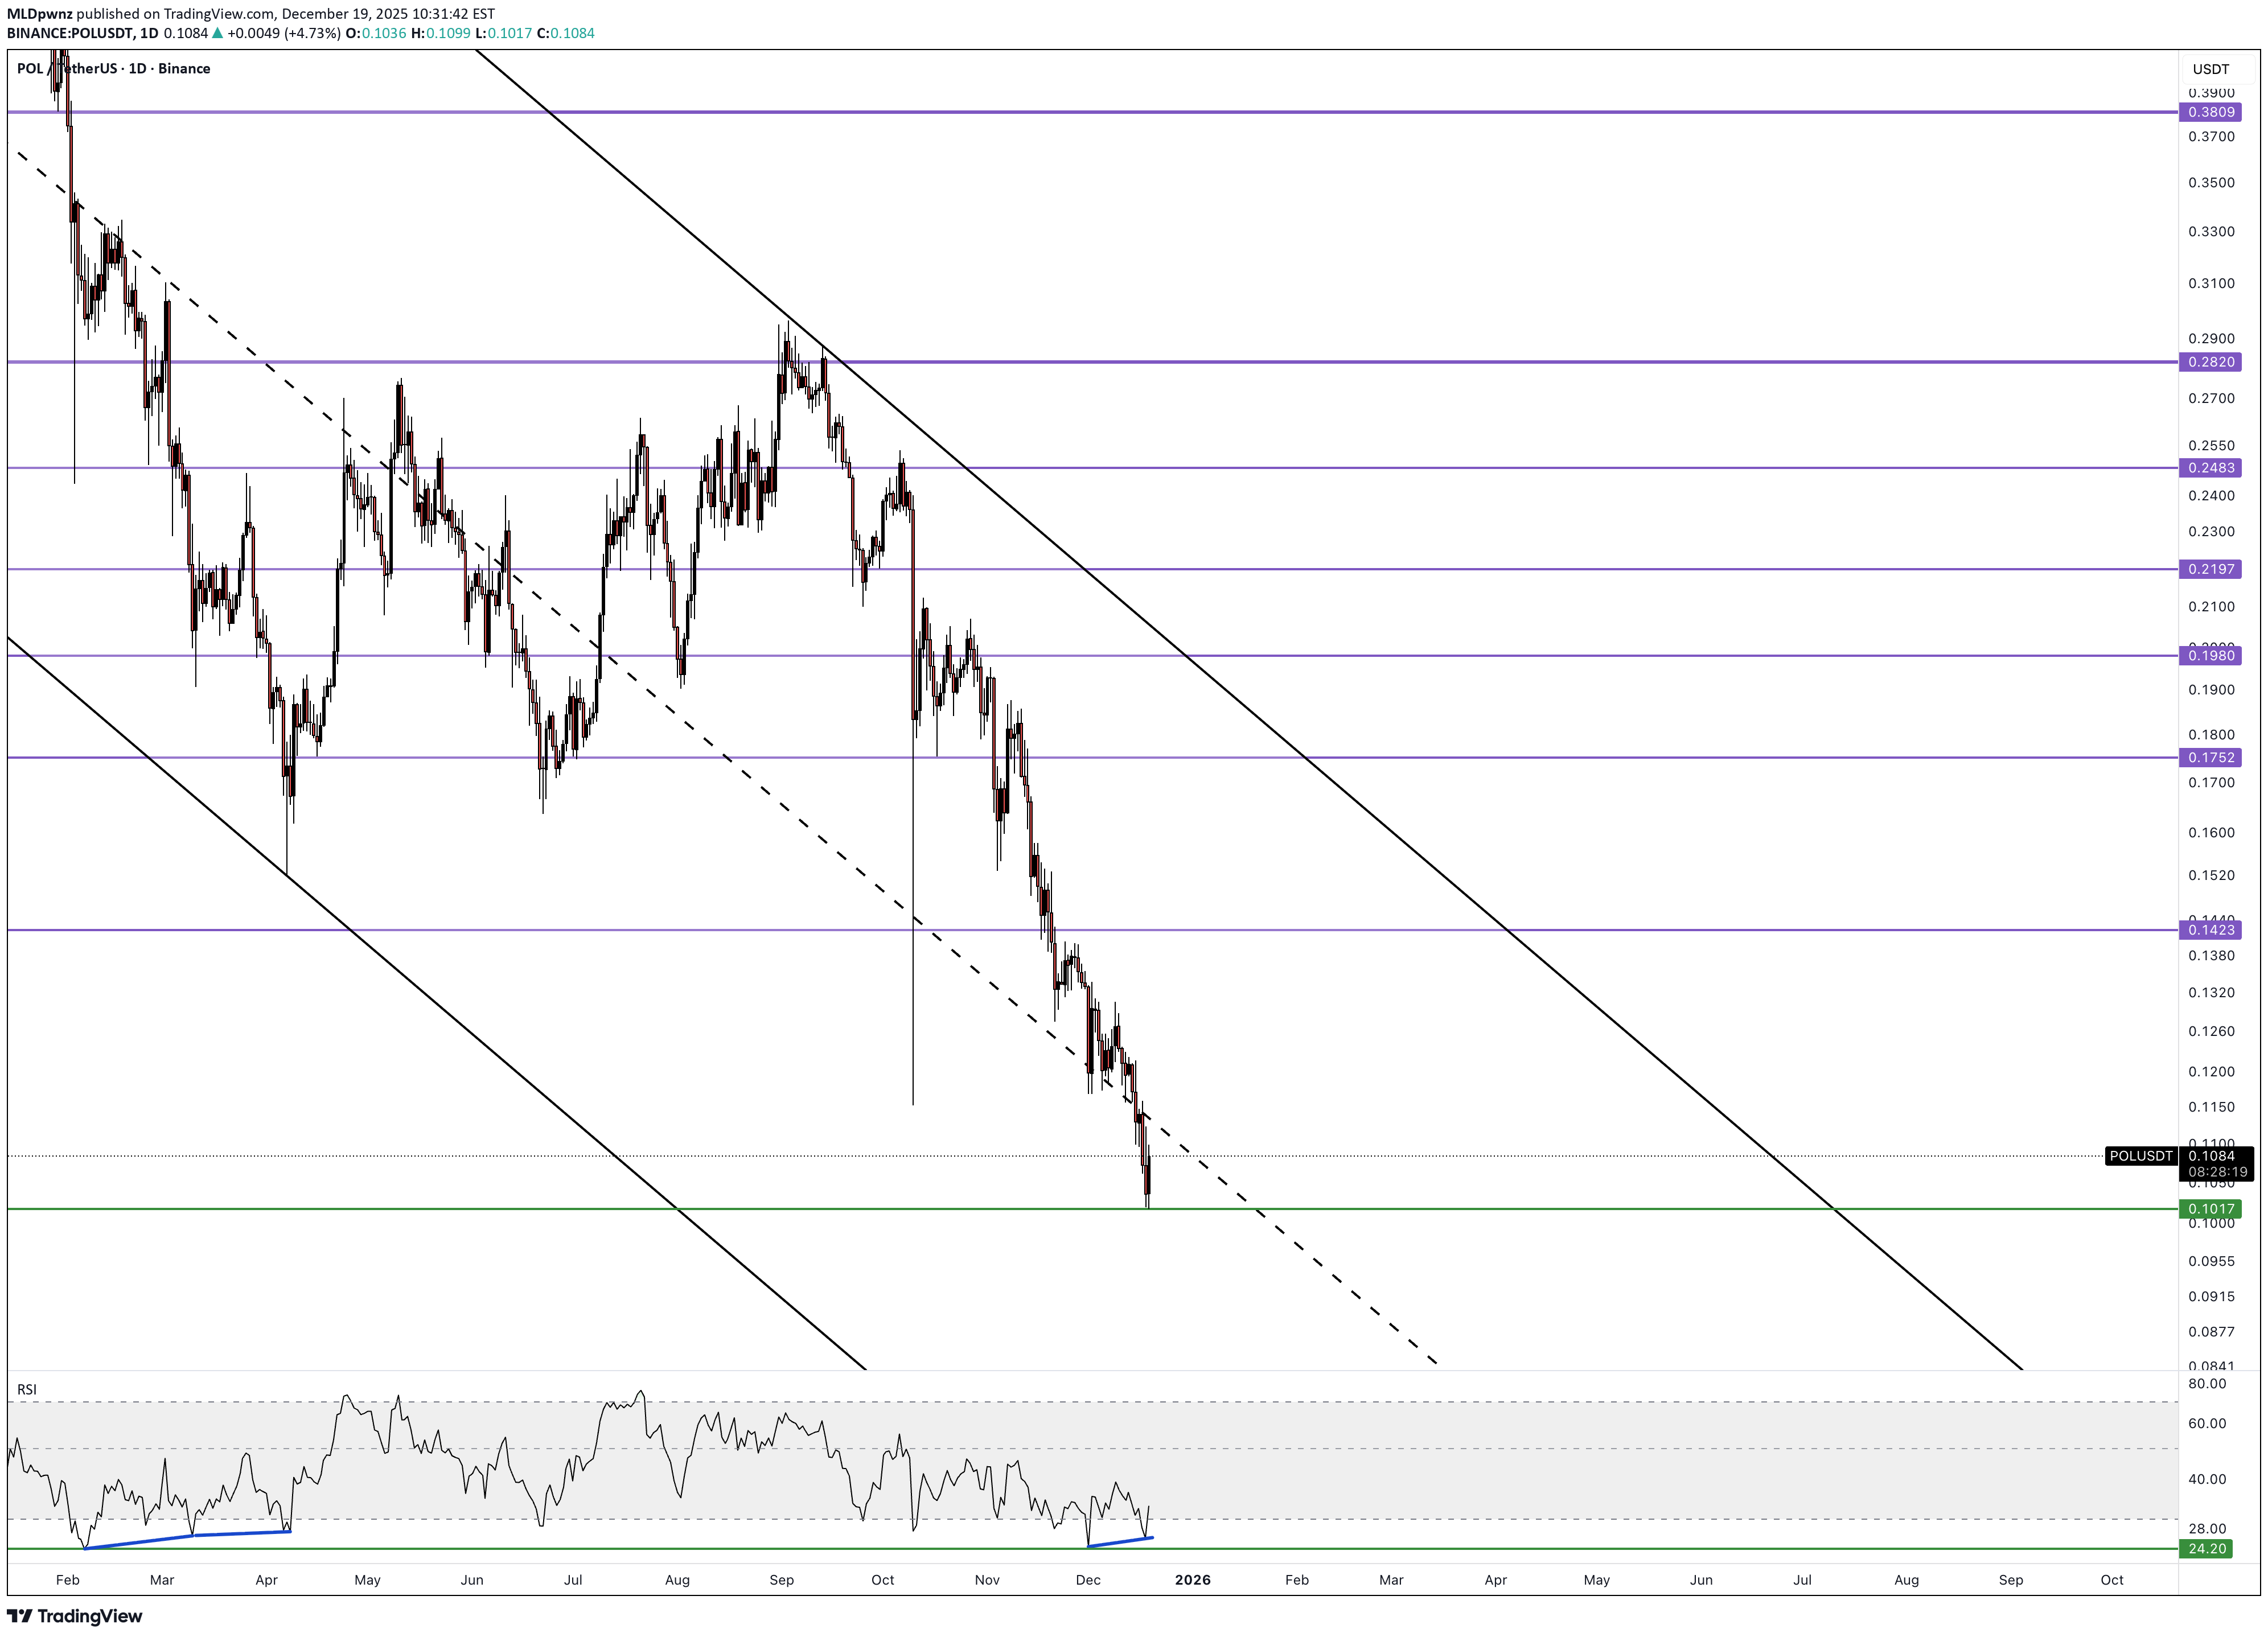
تغییر نام تجاری MATIC → POL کمکی نکرد: قیمت سالانه 86٪ کاهش یافته است. در این دوره، یک کانال نزولی شکل گرفت و قیمت در حال حاضر زیر خط وسط کانال باقی مانده است. RSI پس از شرایط فروش بیش از حد شدید، واگرایی صعودی را نشان می دهد. این یک محرک صعودی قوی است، اما مهم است که به خاطر داشته باشید: می تواند با تاخیر قابل توجهی انجام شود. دفعه قبل، برگشت بیش از دو ماه طول کشید و تنها پس از ایجاد یک واگرایی مضاعف رخ داد. نحوه معامله آن: • تهاجمی: خرید در سطوح فعلی با توقف کمتر از حد پایین. • ایمنتر: منتظر بازپسگیری باشید و بالای خط وسط کانال نگه دارید، سپس با توقفی زیر پایین وارد شوید. 🎯 هدف اولیه: مرز بالای کانال. اهداف بالاتر تنها پس از شکست تایید شده بالای آن معنا پیدا می کنند.

SwallowAcademy
Polygon (POL): Looking For Confirmational Breakout For Entry
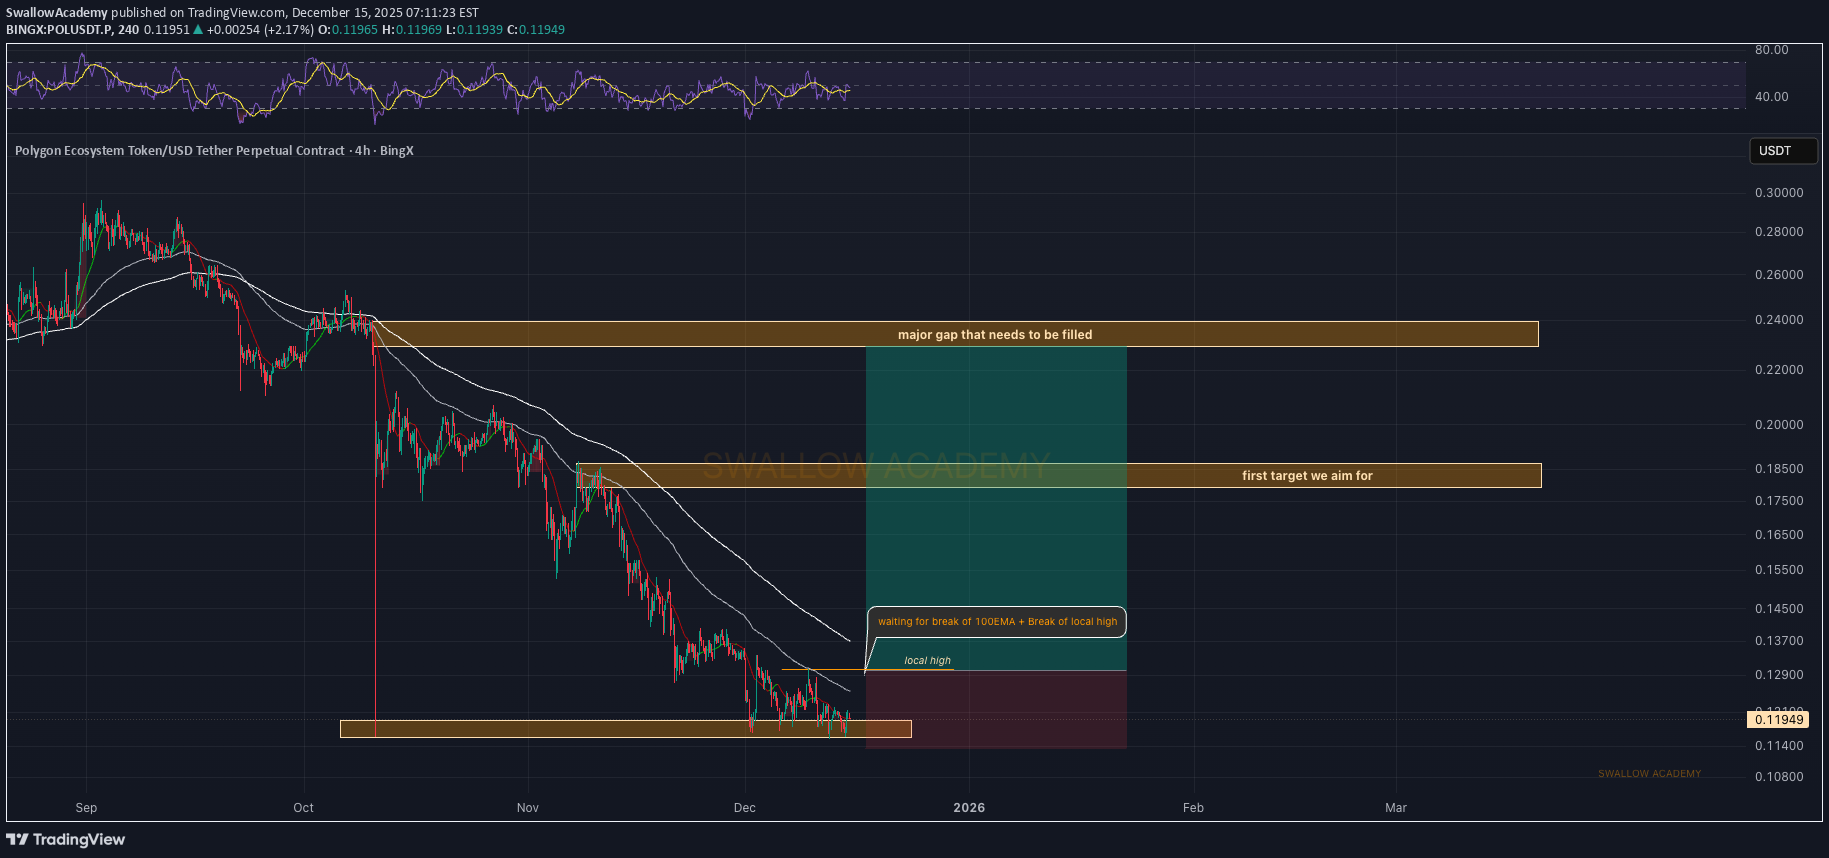
POL پس از فروش قوی همچنان نزدیک به پایین ترین سطح است. قیمت پایین ترین سطح محلی را نگه داشته است، اما خریداران همچنان زیر 100 EMA و بالاترین سطح محلی محدود هستند. این منطقه کلید هر گونه ادامه صعودی است. اگر خریداران موفق به شکستن و نگه داشتن بالای 100 EMA و رسیدن به بالاترین سطح محلی شوند، آنگاه فرصت خوبی به سمت هدف اول شکل میگیرد و شکاف بزرگتر در بالا به عنوان یک آهنربا عمل میکند. تا زمانی که این وقفه اتفاق نیفتد، برنامه بازی به همان صورت باقی می ماند - منتظر تایید باشید، هنوز ارسال کاملی انجام نشده است. آکادمی پرستو

SwallowAcademy
پول (POL) در آستانه شکست ساختار بازار: منتظر چه نشانهای برای ورود هستیم؟
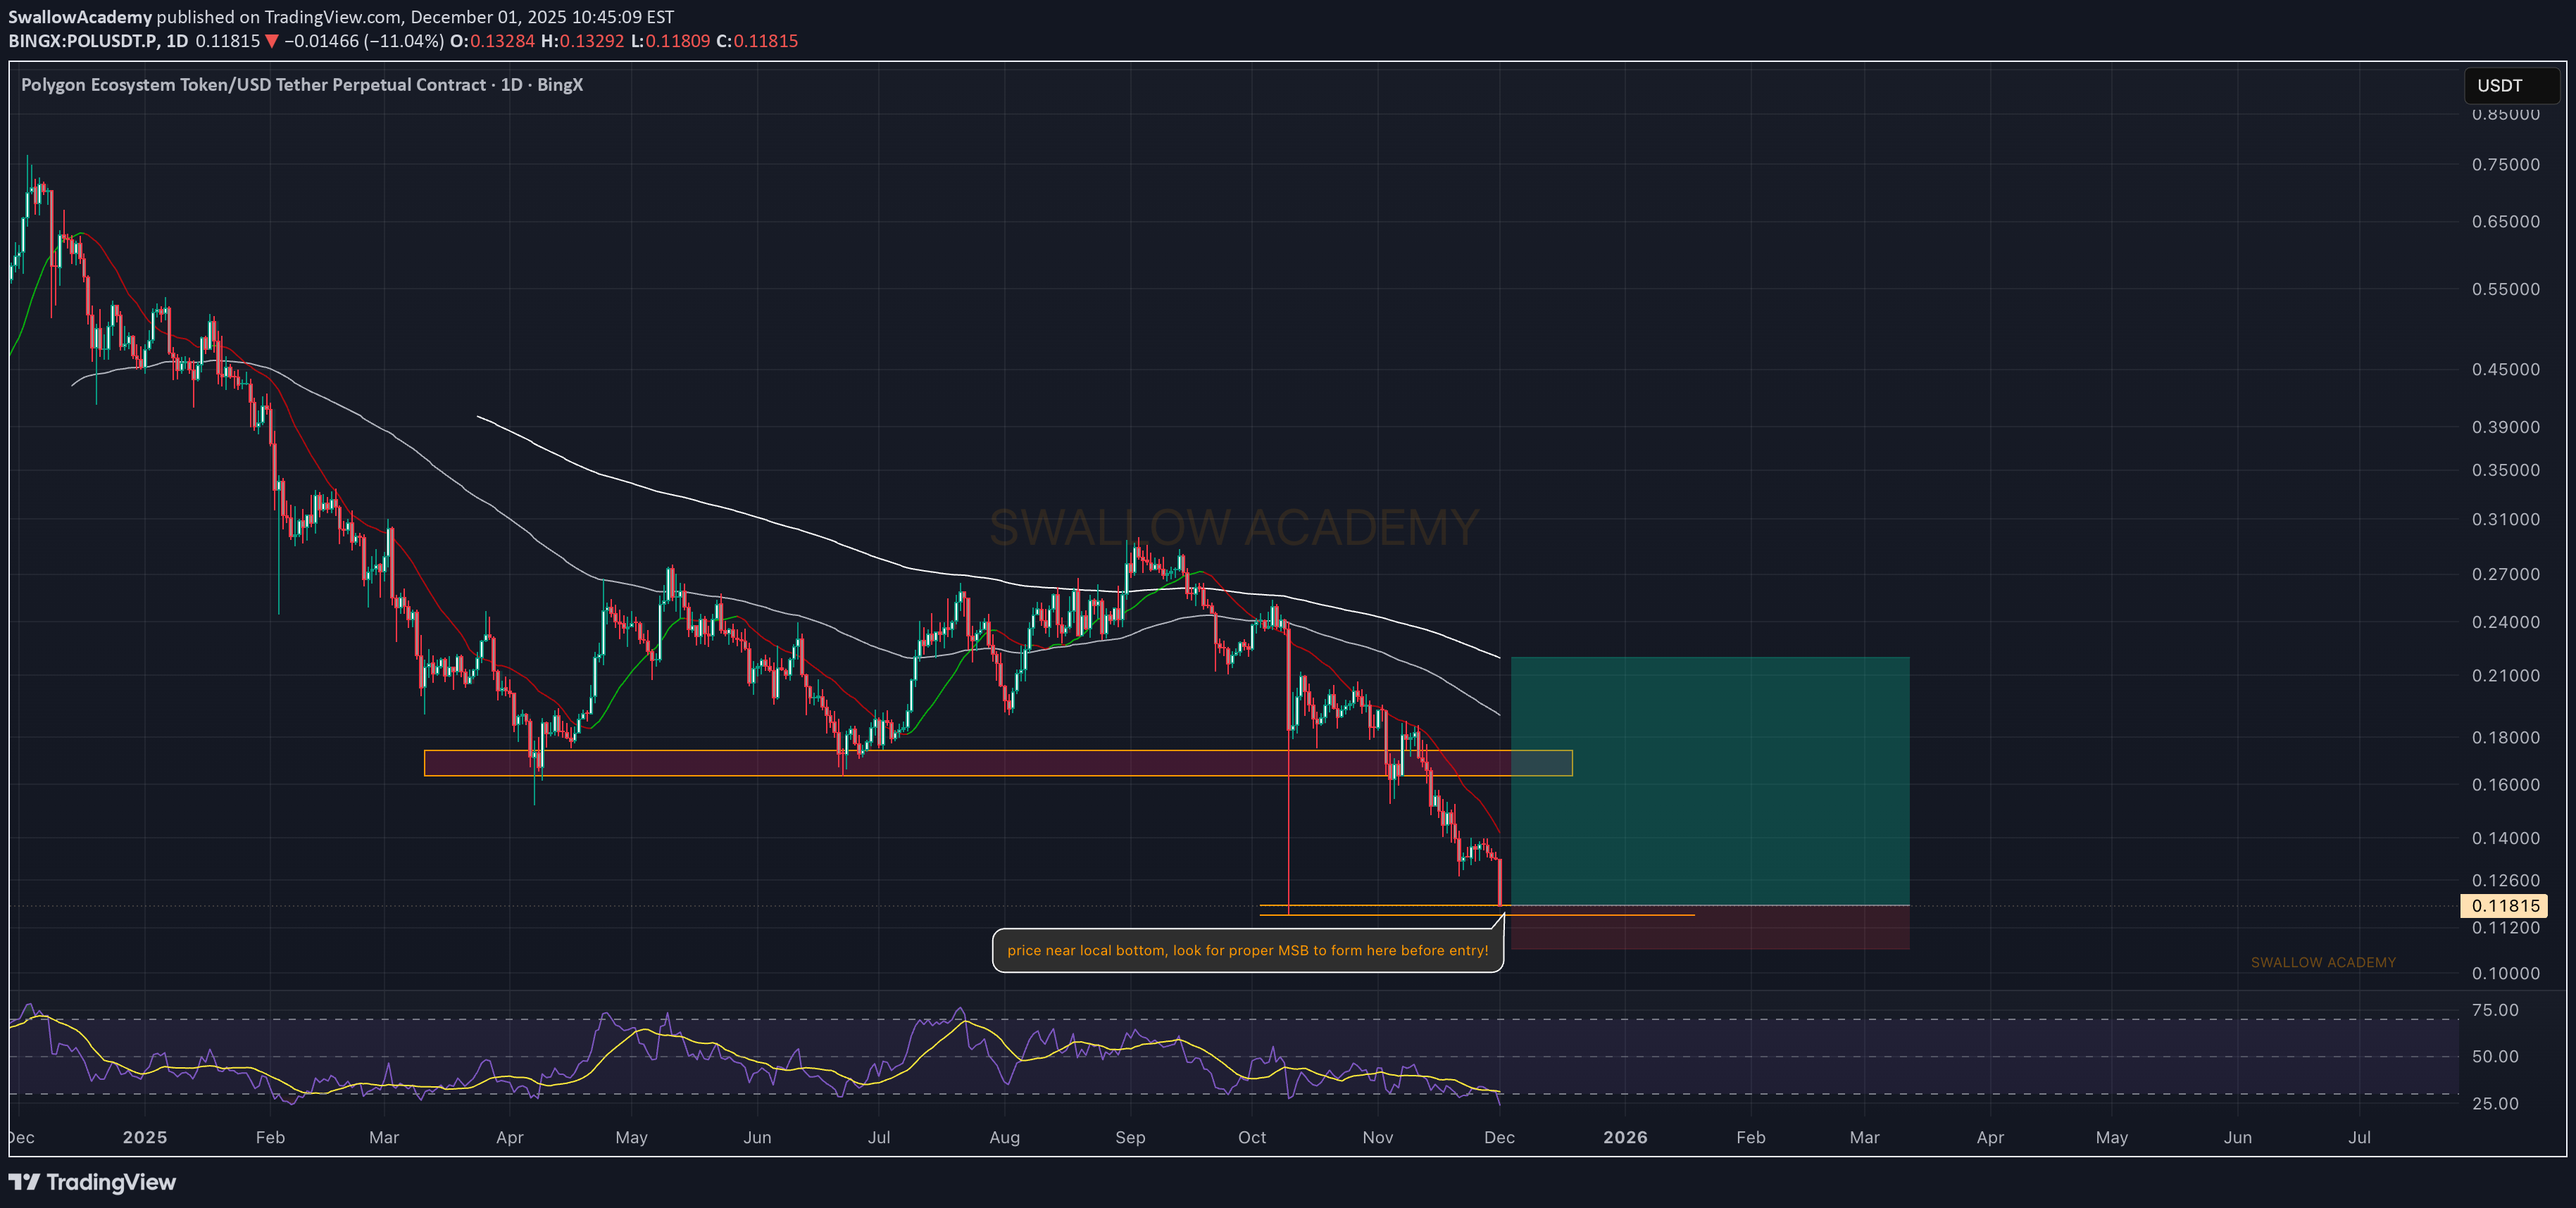
این دارایی دقیقاً در کف محلی خود قرار گرفته است و این ناحیه قبلاً واکنش مثبتی نشان داده است. فعلاً میخواهیم شاهد نوعی تغییر مومنتوم (شتاب) در اینجا باشیم — تشکیل یک ساختار برگشتی کوچک یا MSB، قبل از آنکه اصلاً به ورود فکر کنیم. اگر خریداران موفق شوند از این منطقه دفاع کرده و قدرت مناسبی از خود نشان دهند، ما به دنبال یک تنظیمات خرید (لانگ ستاپ) با یک محدوده صعودی قوی برای هدفگذاری بود. اما اگر این سطح حفظ نشود، صبور میمانیم و از اجبار کردن (فورس کردن) معامله پرهیز میکنیم. آکادمی سوآلو

tradecitypro
تحلیل POL: آیا روند نزولی ادامه دارد؟ کلید اصلی فروش کجاست؟
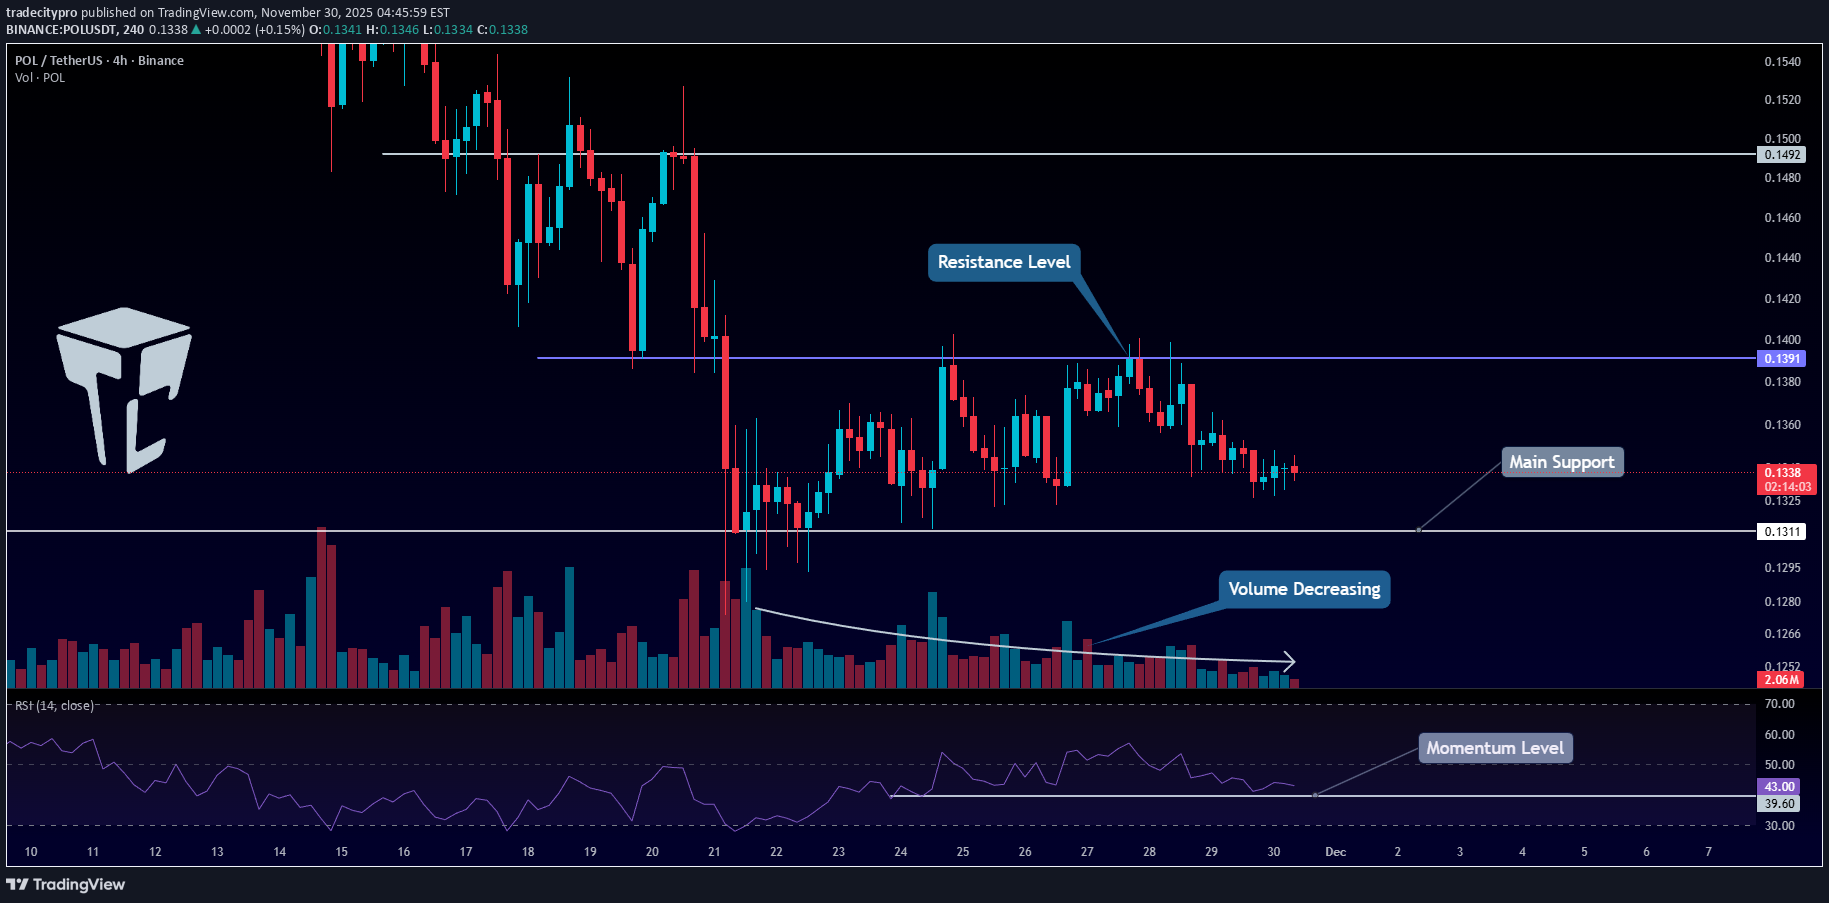
👋 به تریدسیتی خوش آمدید! در این تحلیل، POL را بررسی میکنم، که یکی از پروژههای اکوسیستم لایه ۲ اتریوم است و در حال حاضر با ارزش بازار ۱.۴۱ میلیارد دلار، در رتبه ۵۲ام کوینمارکتکپ قرار دارد. ⏳ تایمفریم ۴ ساعته POL در حال حاضر در تایمفریم ۴ ساعته در یک روند نزولی قرار دارد و اکنون در حال حرکت در داخل یک محدوده اصلاحی در همان روند است. 🔔 این روند نزولی تا ناحیه حمایتی ۰.۱۳۱۱ ادامه یافت و پس از رسیدن به این سطح، قیمت یک حرکت اصلاحی صعودی را آغاز کرد و تا سطح ۰.۱۳۹۱ ریتریس (اصلاح) کرد. 📊 در طول این اصلاح، حجم معاملات کاهش یافته است، که این مورد انتظار است و همچنین تأیید میکند که فروشندگان همچنان کنترل روند کلی را در دست دارند. ✨ با توجه به روند نزولی و تأیید حجم، باز کردن پوزیشن شورت در حال حاضر منطقیترین استراتژی باقی میماند. 💥 در اندیکاتور RSI، یک سطح حمایت در ۳۹.۶۰ داریم. شکسته شدن به زیر این سطح، اولین نشانه شروع یک موج نزولی جدید بود. 📉 تریگر اصلی شورت برای POL، سطح ۰.۱۳۱۱ است. اگر این تریگر با افزایش حجم شکسته شود، روند نزولی میتواند به راحتی ادامه پیدا کند. 🧩 برای پوزیشنهای لانگ، هنوز خیلی زود است؛ بازار ابتدا باید یک بازگشت روند واضح را نشان دهد. برای تأیید بازگشت، قیمت باید بالاتر از ۰.۱۳۹۱ تثبیت شود و یک سقف بالاتر و کف بالاتر در بالای این ناحیه ایجاد کند. ⭐ با این حال، اگر حجم خرید در داخل محدوده فعلی شروع به افزایش کند و کندلهای صعودی قویتر از کندلهای نزولی شوند، احتمال بازگشت روند افزایش مییابد — و در آن سناریو، شکست ۰.۱۳۹۱ میتواند به عنوان یک تریگر لانگ زودهنگام عمل کند. 📝 جمعبندی نهایی آرامش خود را حفظ کنید، هوشمندانه معامله کنید و بیایید بهترین فرصتهای بازار را شکار کنیم! این تحلیل منعکس کننده نظرات ما است و توصیه مالی نیست. نظرات خود را در بخش کامنتها به اشتراک بگذارید و فراموش نکنید این تحلیل را با دوستان خود به اشتراک بگذارید! ❤️
RayHanBros
سیگنال خرید پولکادات (POL): اهداف جذاب و حد ضرر مشخص برای سرمایهگذاری بلندمدت!
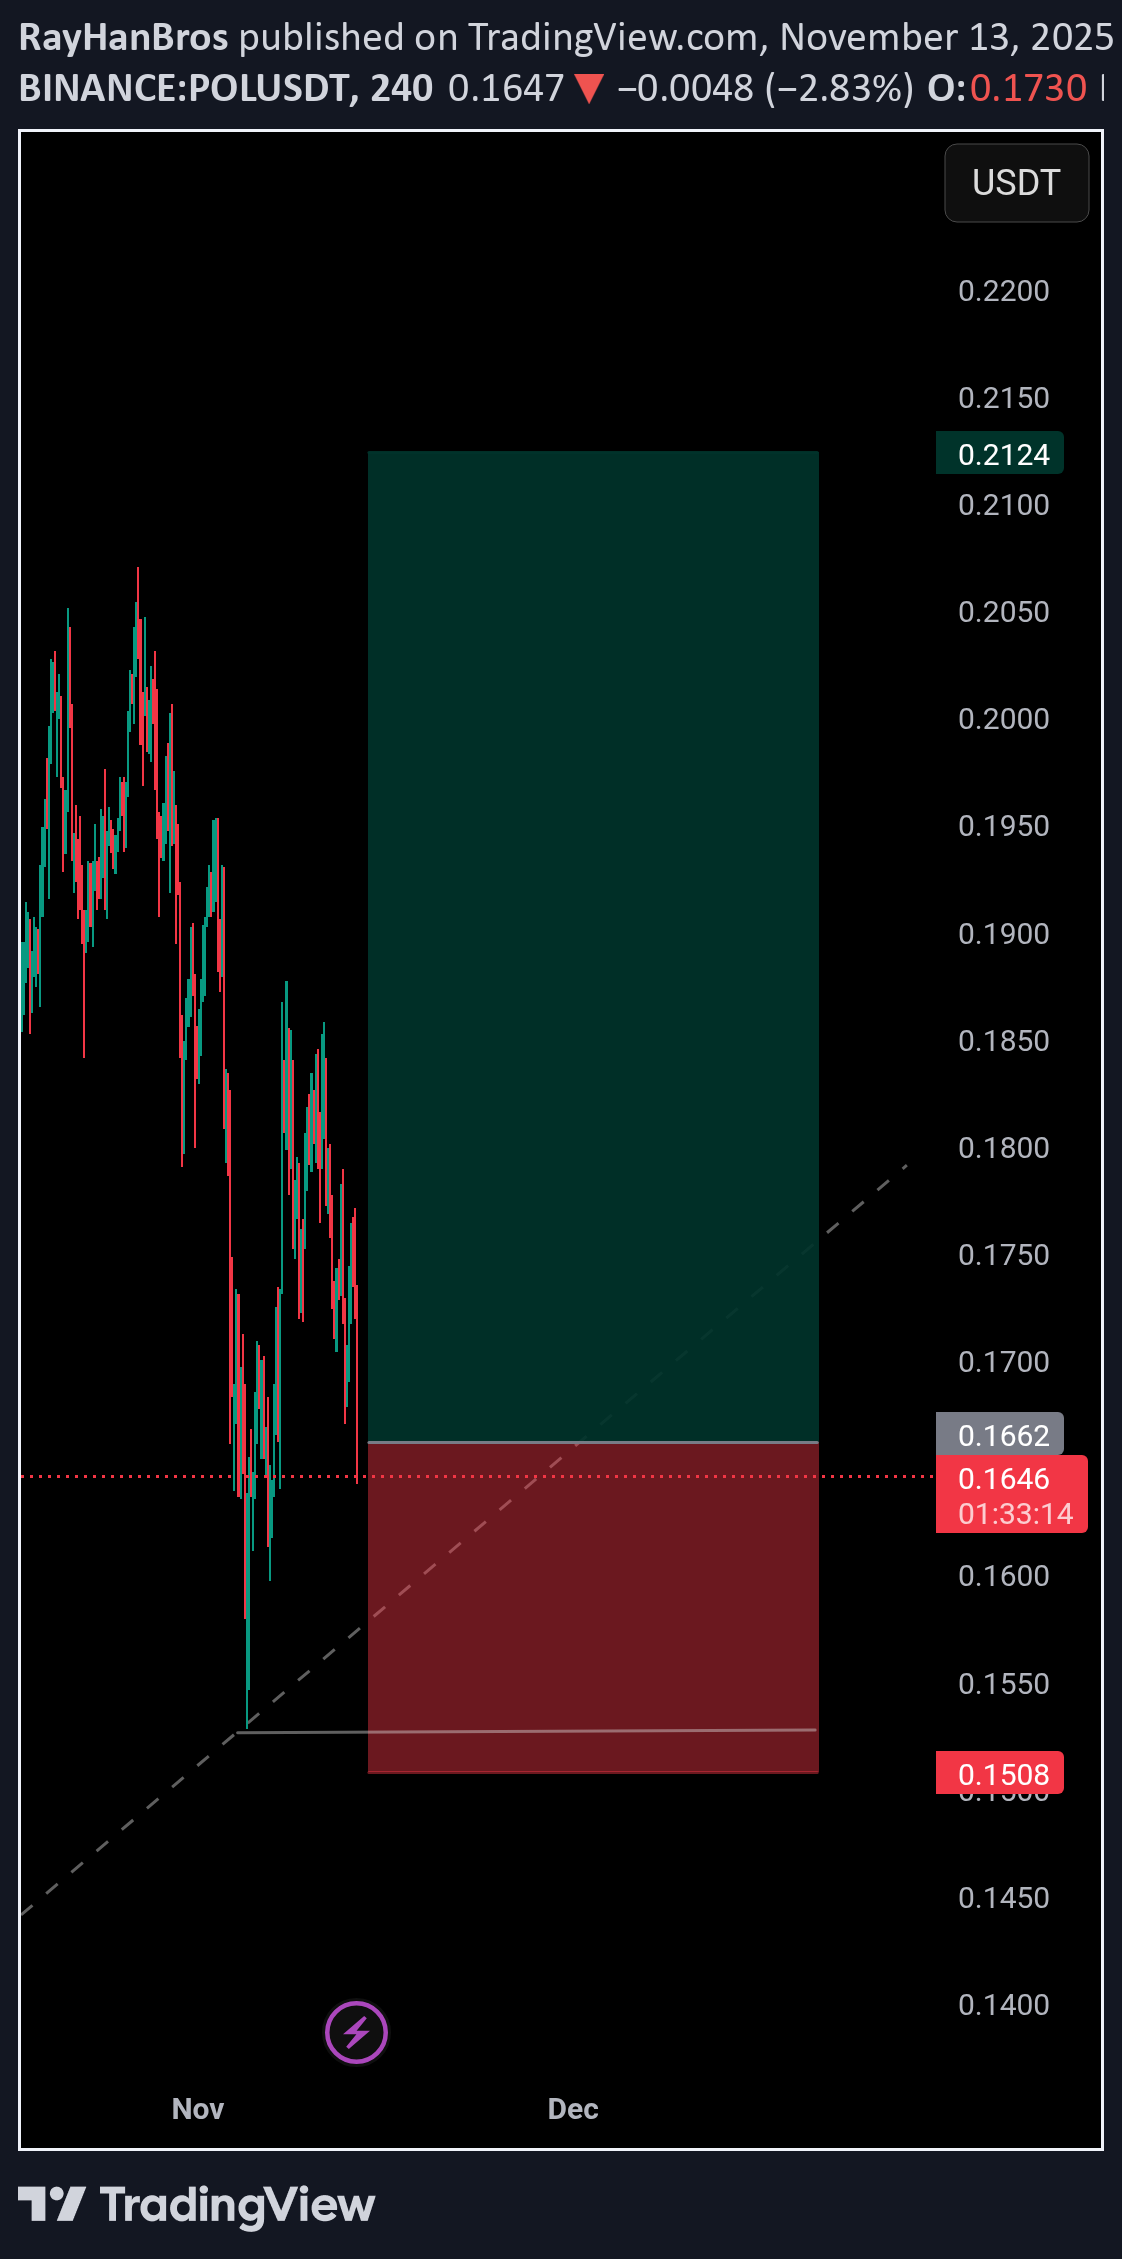
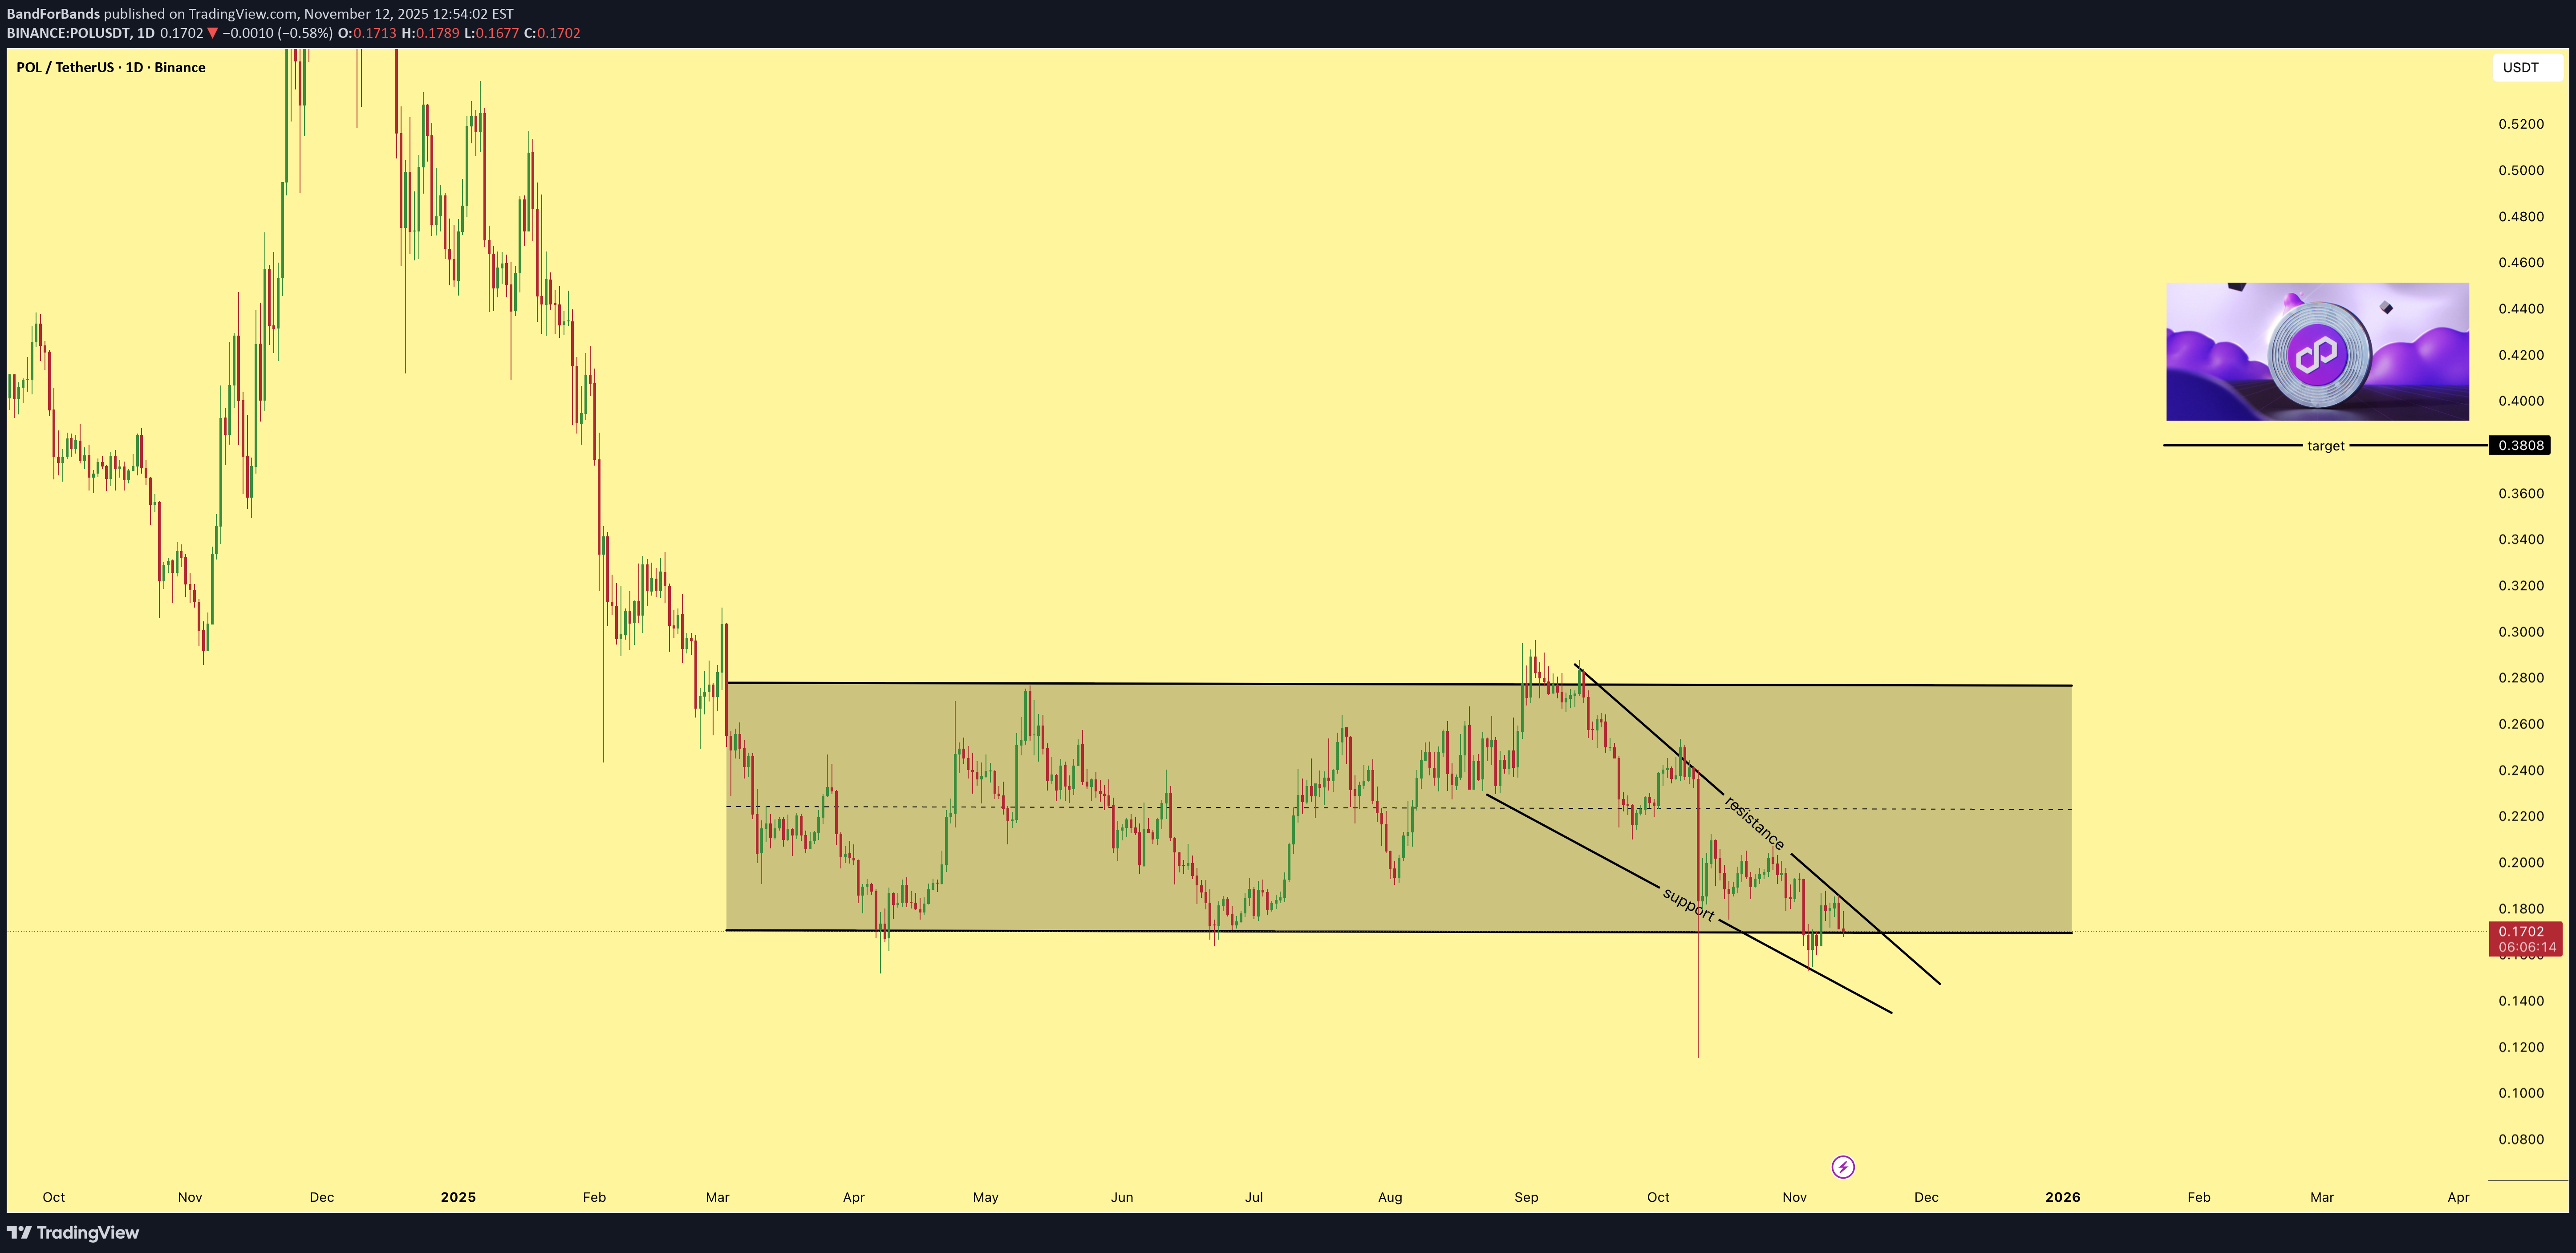
محدوده ورود 🟩: ۰.۱۶۵۳ دلار تا ۰.۱۶۴۰۰ دلار اهداف 🎯: ۱. ۰.۱۷۱۰ ۲. ۰.۱۸۱۰ ۳. ۰.۱۹۰۰ ۴. ۰.۲۱۰۰ به بالا (+) حد ضرر 🔻: زیر ۰.۱۵۰

BandForBands

tradecitypro
تحلیل POL: آیا پادشاه لایه 2 از مقاومت حیاتی عبور میکند؟
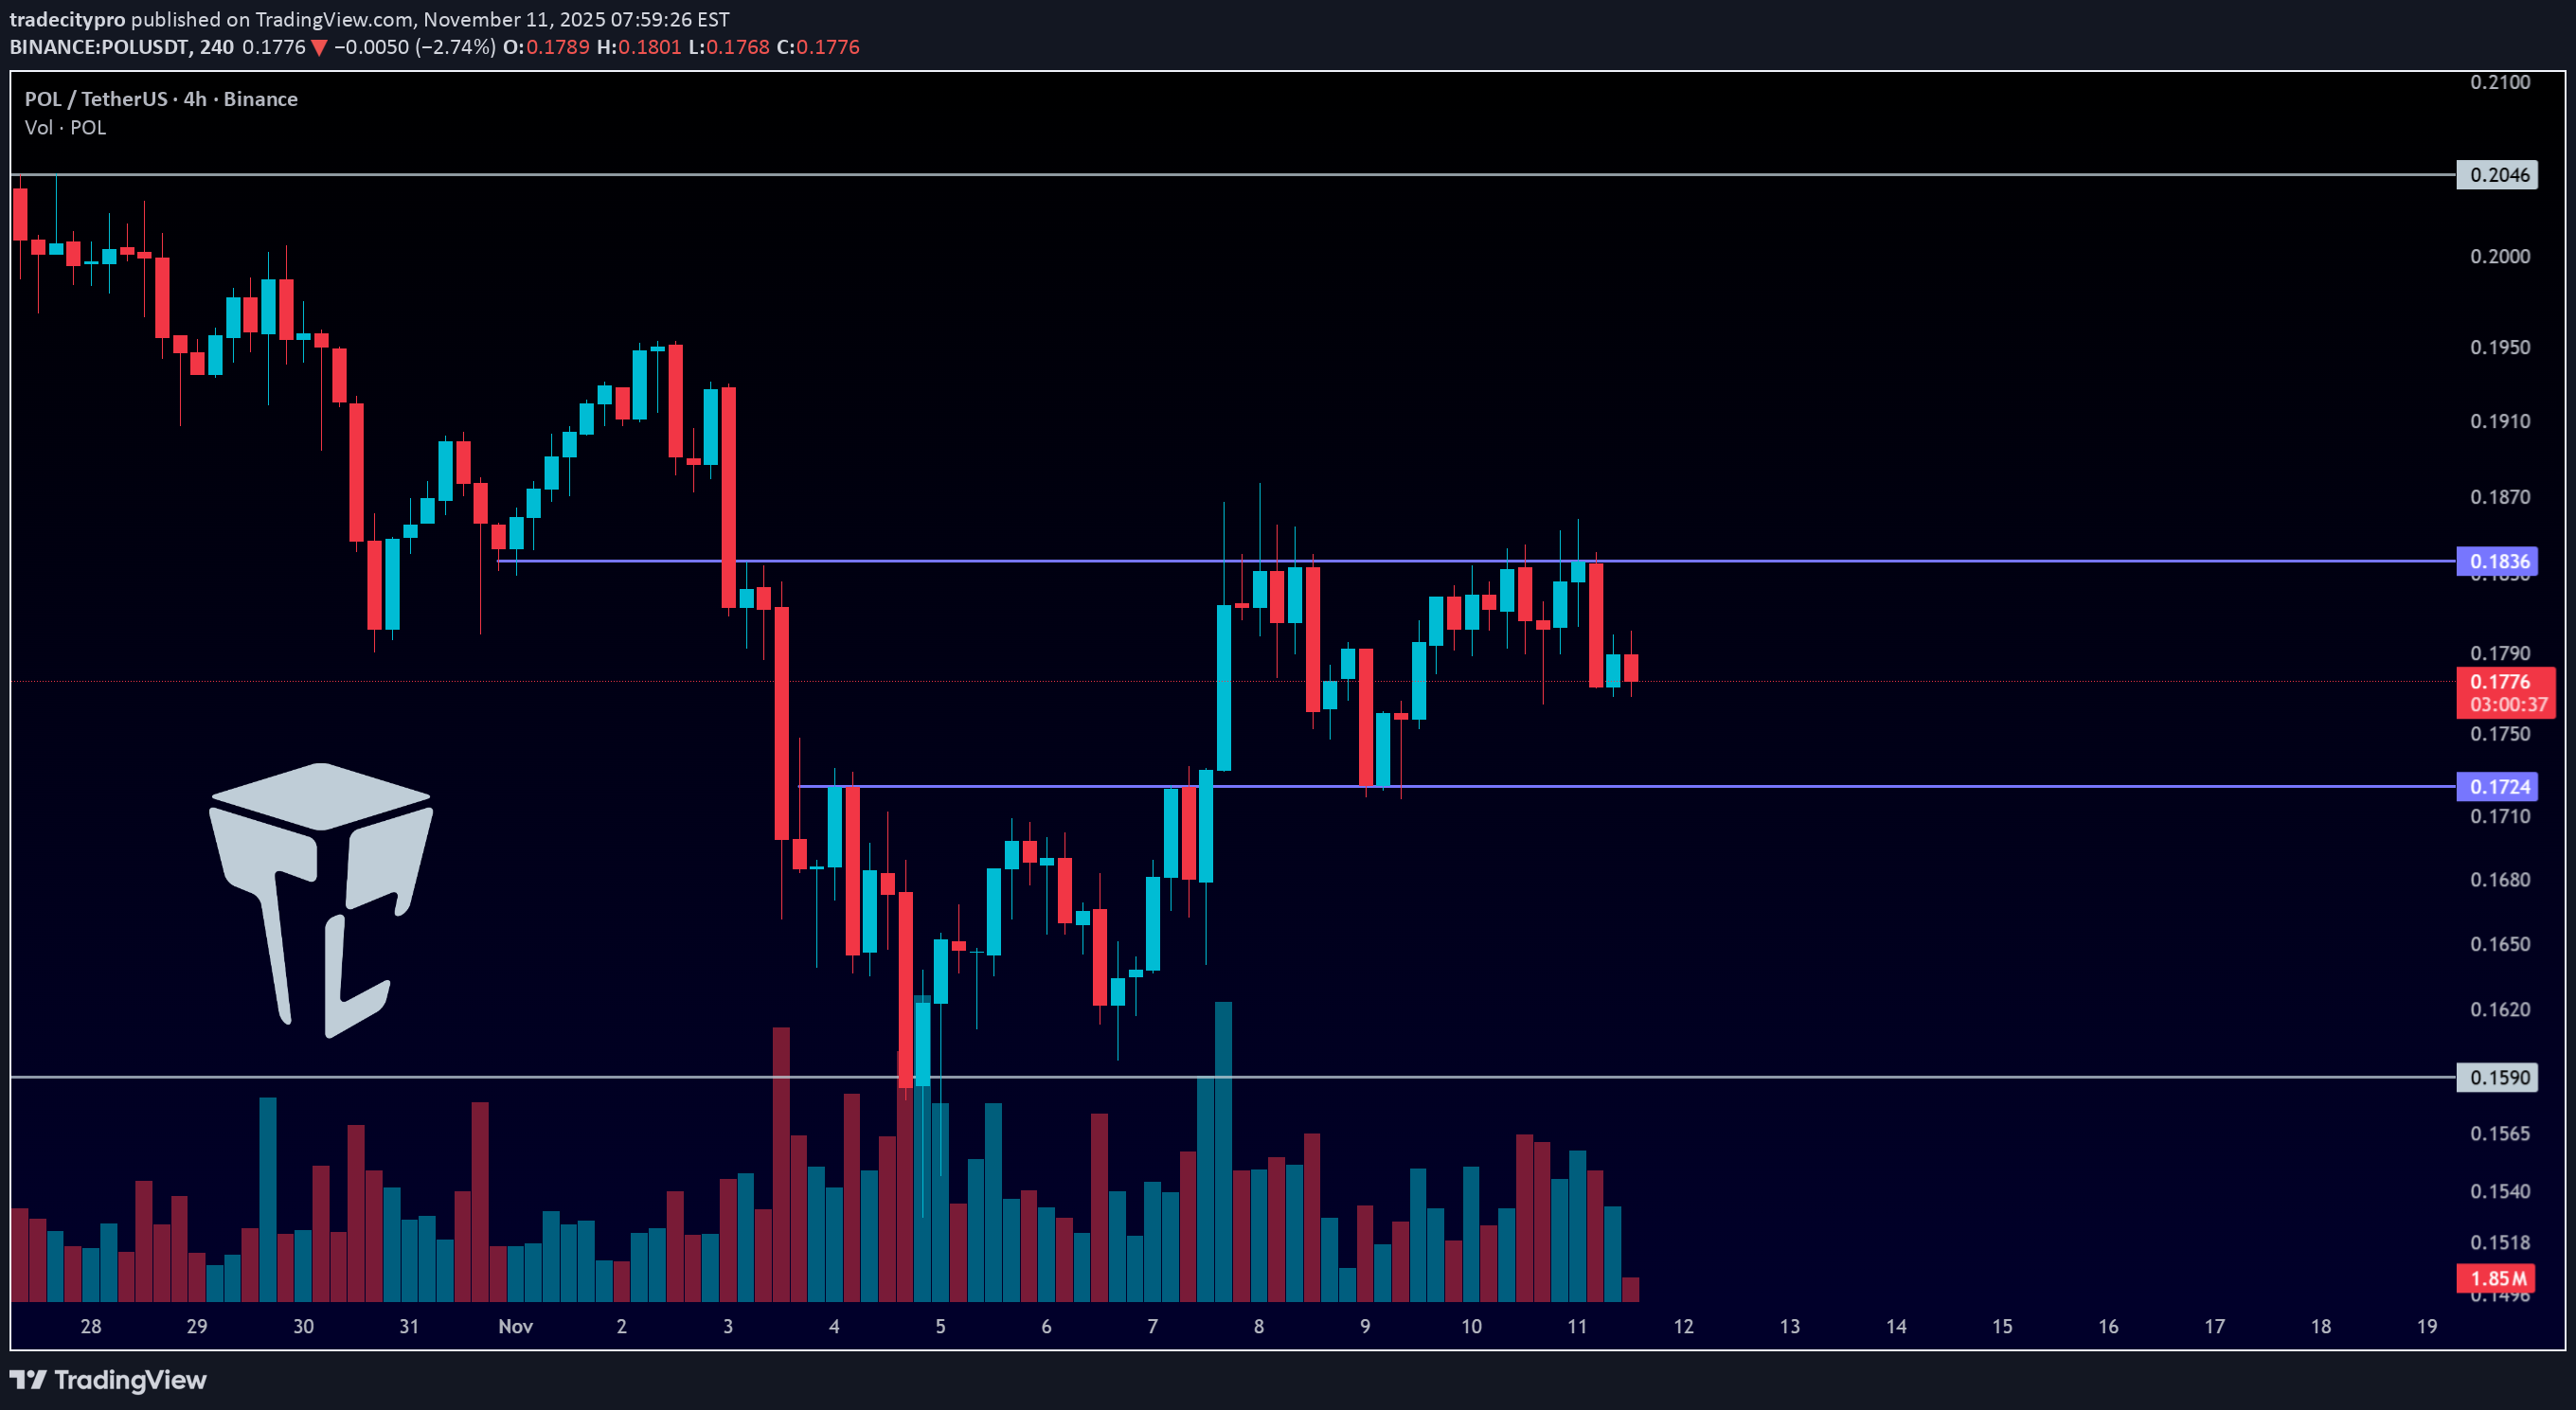
👋 به TradeCity Pro خوش آمدید! در این تحلیل، قصد دارم POL را بررسی کنم؛ یکی از پروژههای اتریوم Layer ۲، که در حال حاضر در CoinMarketCap رتبه ۴۸ را دارد و ارزش بازار (Market Cap) آن ۱.۸۷ میلیارد دلار است. ⌛️ بازه زمانی ۴ ساعته در نمودار ۴ ساعته، این کوین پس از پیدا کردن حمایت (Support) در حدود ۰.۱۵۹۰، یک اوج (High) در ۰.۱۷۲۴ تشکیل داد و پس از شکستن آن سطح، اولین ساختار صعودی move خود را ایجاد کرده است. ✔️ در حال حاضر، قیمت با مقاومت (Resistance) در حدود ۰.۱۸۳۶ مواجه است، منطقهای که قبلاً دو بار آن را تست کرده و هر بار رد شده است (ریجکت شده است). ✨ در صورت شکست ۰.۱۸۳۶، میتوانیم به دنبال یک موقعیت خرید (Long Position) باشیم، چرا که منطقه مقاومت بعدی در حدود ۰.۲۰۴۶ قرار دارد. 📊 برای موقعیتهای فروش (Short Position)، منتظر میمانم تا ساختار بازار نزولی شود و سپس اقدام کنم. در حال حاضر، نقطه شروع فروش (Short Trigger) در ۰.۱۷۲۴ است، اما تأیید اصلی روند نزولی تنها پس از شکست زیر ۰.۱۵۹۰ اتفاق افتاد. 📝 کلام آخر آرامش خود را حفظ کنید، هوشمندانه معامله کنید و بیایید بهترین فرصتهای بازار را شکار کنیم! این تحلیل منعکس کننده نظرات ما است و به منزله مشاوره مالی نیست. نظرات خود را در کامنتها به اشتراک بگذارید و فراموش نکنید این تحلیل را با دوستان خود به اشتراک بگذارید! ❤️

SwallowAcademy
پالیگان (POL) به زودی به ۰.۲۸ دلار میرسد؟ تحلیل تکنیکال هیجانانگیز
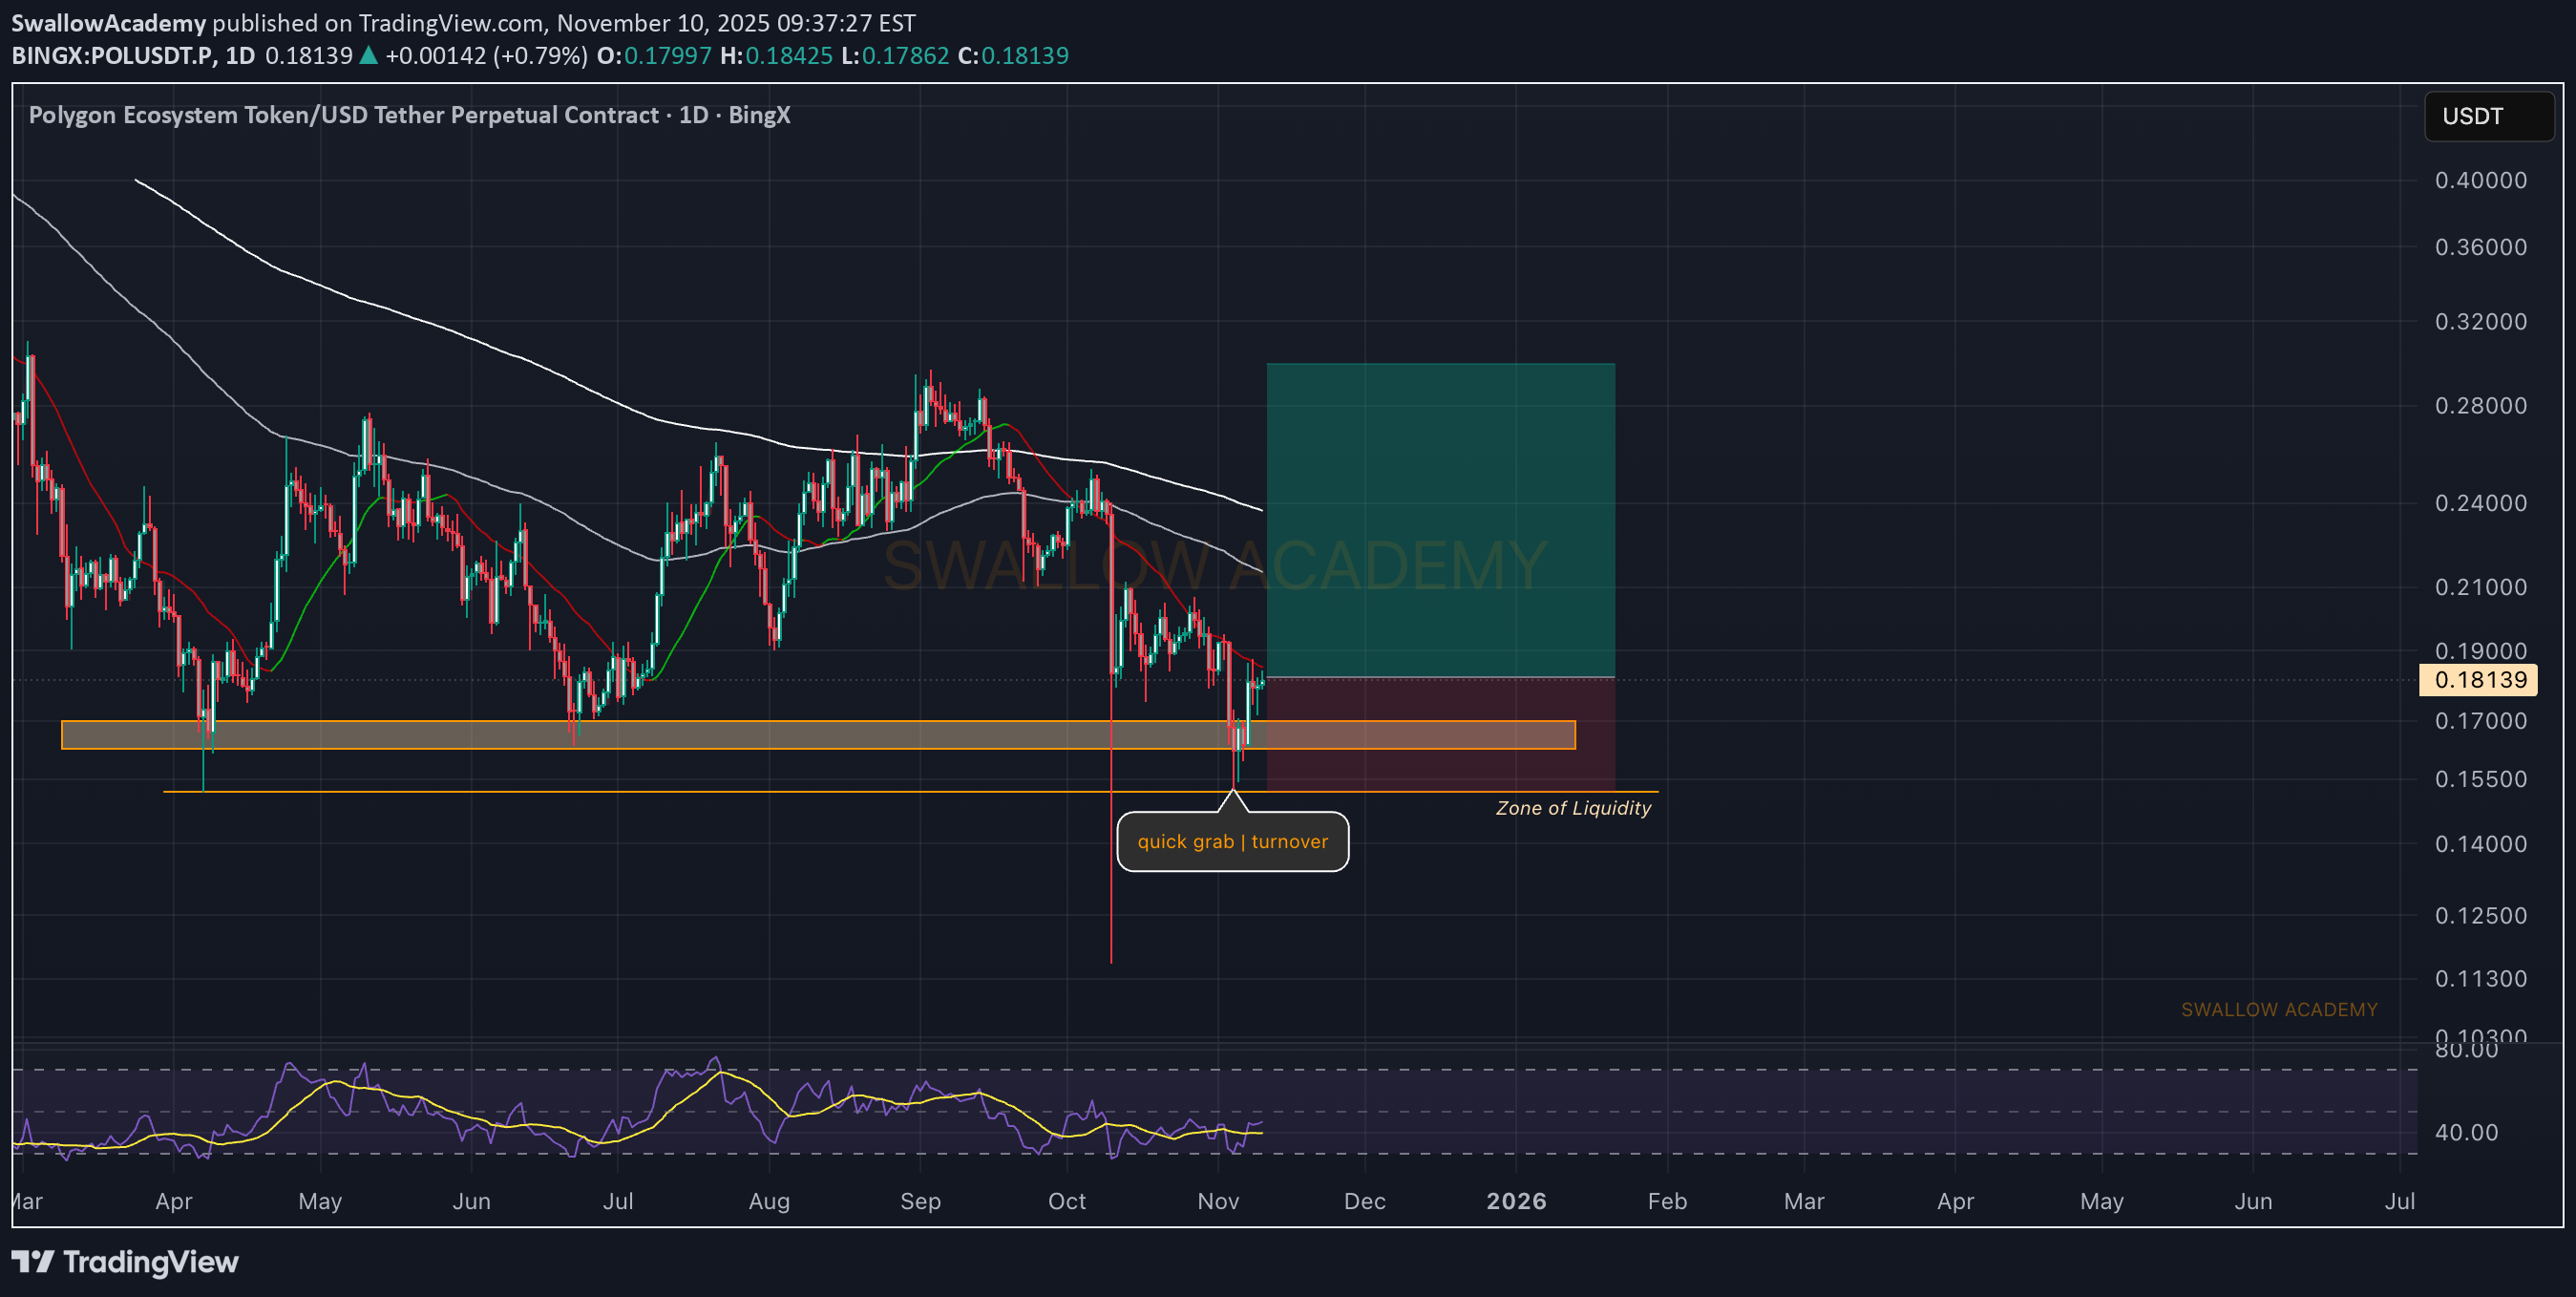
قیمت یک شکار نقدینگی سریع انجام داد و بلافاصله از ناحیهای که قبلاً به عنوان حمایت عمل میکرد، برگشت. به نظر میرسد خریداران در تلاشند تا در همین نقطه جهت حرکت را تغییر دهند. آنچه اکنون باید شاهد آن باشیم، بازیابی قاطعانه EMAs (میانگینهای متحرک نمایی) است — این امر تغییر روند را تأیید کرده و راه را برای یک موج بازیابی باز کرد. تا آن زمان، منتظر تأیید میمانیم. آکادمی پرستو
سلب مسئولیت
هر محتوا و مطالب مندرج در سایت و کانالهای رسمی ارتباطی سهمتو، جمعبندی نظرات و تحلیلهای شخصی و غیر تعهد آور بوده و هیچگونه توصیهای مبنی بر خرید، فروش، ورود و یا خروج از بازارهای مالی نمی باشد. همچنین کلیه اخبار و تحلیلهای مندرج در سایت و کانالها، صرفا بازنشر اطلاعات از منابع رسمی و غیر رسمی داخلی و خارجی است و بدیهی است استفاده کنندگان محتوای مذکور، مسئول پیگیری و حصول اطمینان از اصالت و درستی مطالب هستند. از این رو ضمن سلب مسئولیت اعلام میدارد مسئولیت هرنوع تصمیم گیری و اقدام و سود و زیان احتمالی در بازار سرمایه و ارز دیجیتال، با شخص معامله گر است.


