
AlgoVesting
@t_AlgoVesting

What symbols does the trader recommend buying?
Purchase History
پیام های تریدر
Filter
AlgoVesting
Short on NEAR, but with caution!
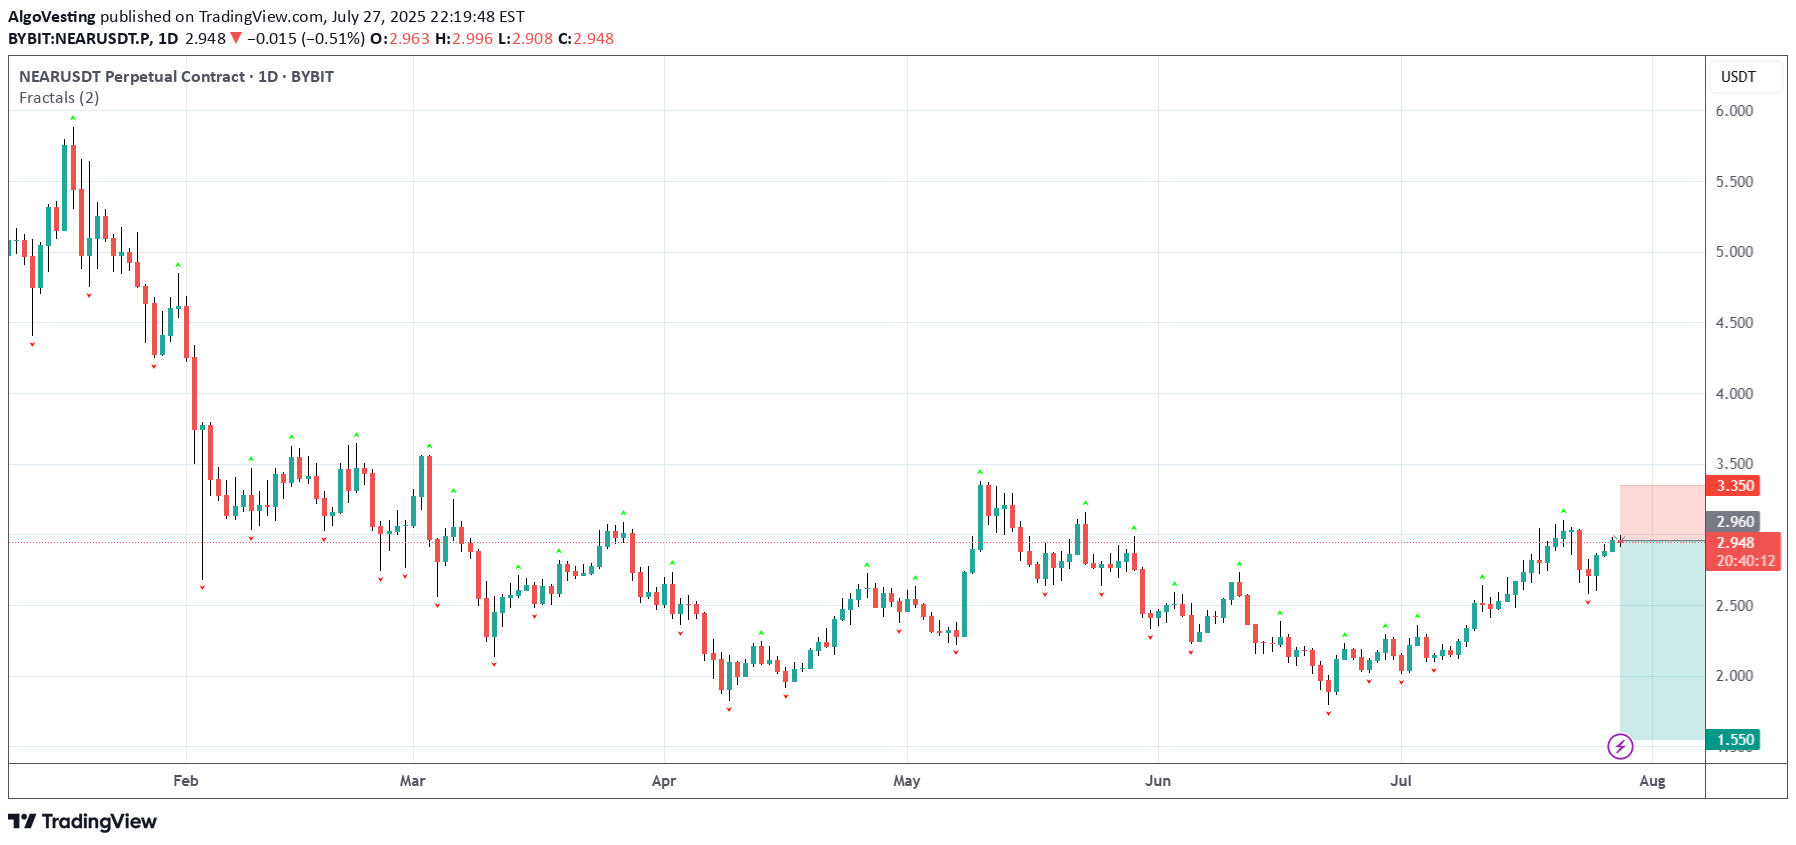
The technical setup is very clear and strong. The resistance level is well-defined. The fundamental news, while positive, is not reporting the kind of extreme, immediate buying pressure we saw with ENA. The news about developer activity is a long-term positive, but it doesn't invalidate a potential short-term pullback from a major resistance level. Therefore, the technical setup is compelling enough to take the trade, but we must be strict with our risk management because the underlying fundamentals are healthy. let's break it down! Technical Analysis Let's start with the chart. The daily chart for NEARUSDT shows a clear recovery rally from the lows of early July. The price has now pushed up to the $3.00 - $3.10 resistance zone. This level is significant because it served as a reliable support floor during April and May 2025 before the price broke down in June. The chart shows the price is currently stalling right at this level, with today's candle showing a slight rejection. This is a classic "old support turning into new resistance" setup, making it a technically sound area for a potential short entry. Sentiment and Fundamental Analysis Now, let's analyze the provided news to see if the market sentiment aligns with our bearish technical view. (news taken from CoinMarketCap) "GitHub Kings: LINK, ATOM, STORJ, and NEAR Dominate Crypto Development in 5-Month Activity..." (2 days ago): This is fundamentally bullish. High developer activity is a key indicator of a healthy and growing ecosystem. It suggests long-term value and innovation, which is a positive sign. "NEAR Protocol Rebounds 9% as Investors Capitalize on Market Dislocation" (2 days ago): This headline is fairly neutral. It simply describes recent price action (a rebound) and attributes it to investors buying a dip. It doesn't provide a strong directional bias for the future. "Luno launches first-ever crypto staking in Nigeria: What it means and how you can benefit" (3 days ago): While this article mentions crypto staking in general, it does not appear to be directly related to NEAR Protocol itself. Therefore, its impact on NEAR's sentiment is negligible. We can consider this neutral. "NEAR Protocol Integrates EdDSA Signatures to Enhance Cross-Chain Compatibility" (2 months ago): While positive fundamental news, this is old information. Its impact has likely already been priced into the market and it has little bearing on the immediate price action. We can consider this neutral for our immediate trade decision. The sentiment for NEAR is mixed, but leaning slightly bullish on fundamentals. The strongest and most recent piece of relevant news is about high developer activity, which is a positive sign. However, unlike the ENA news which showed massive, active buying pressure and whale involvement right now, the news for NEAR is more about long-term health rather than immediate, explosive buying pressure. There is no overwhelming bullish momentum that screams "don't short this." The Trade Plan: NEARUSDT (Short) The plan is set. We're entering a short position with a market entry now, around $2.96. Entering a short position as the price tests a key horizontal resistance zone ($3.00-$3.10) that was previously strong support. The daily candle shows initial signs of rejection. Stop Loss (SL): $3.35 A decisive close above the resistance zone would invalidate our trade idea. Placing the SL at $3.35 puts it clearly above the entire resistance area and above the minor swing high from late May, giving the trade room to breathe without taking on excessive risk. Take Profit 1 (TP1): $2.55 (Moonbag Target) This is the first significant support level on the way down, corresponding to the consolidation area in mid-July. It's a logical first target for sellers. At TP1, take initial profits and move the trailing stop to our entry price (~$2.96) to make the rest of the trade risk-free. Take Profit 2 (TP2): $2.20 This level corresponds to the next support area from the price action in early July. It represents a significant portion of the recent rally being retraced. When TP2 is hit, move the trailing stop down to the TP1 level ($2.55) to lock in more profit. Take Profit 3 (TP3): $1.85 This targets the major swing low from early July. A move to this level would mean a full retracement of the recent rally. When TP3 is hit, move the trailing stop down to the TP2 level ($2.20). Take Profit 4 (TP4): $1.55 (Final Target) This is our final target, aiming for the lows of the year from March. In a bearish scenario where the resistance holds firmly, a retest of major lows is possible. Close all remaining positions. Conclusion: The NEARUSDT short trade presents a good technical opportunity. While the fundamentals are not bearish, they lack the overwhelming bullish force seen in other coins, making this trade a calculated risk worth taking. The plan is now in place.
AlgoVesting
XRPUSDT - Analysis for Immediate Long Entry
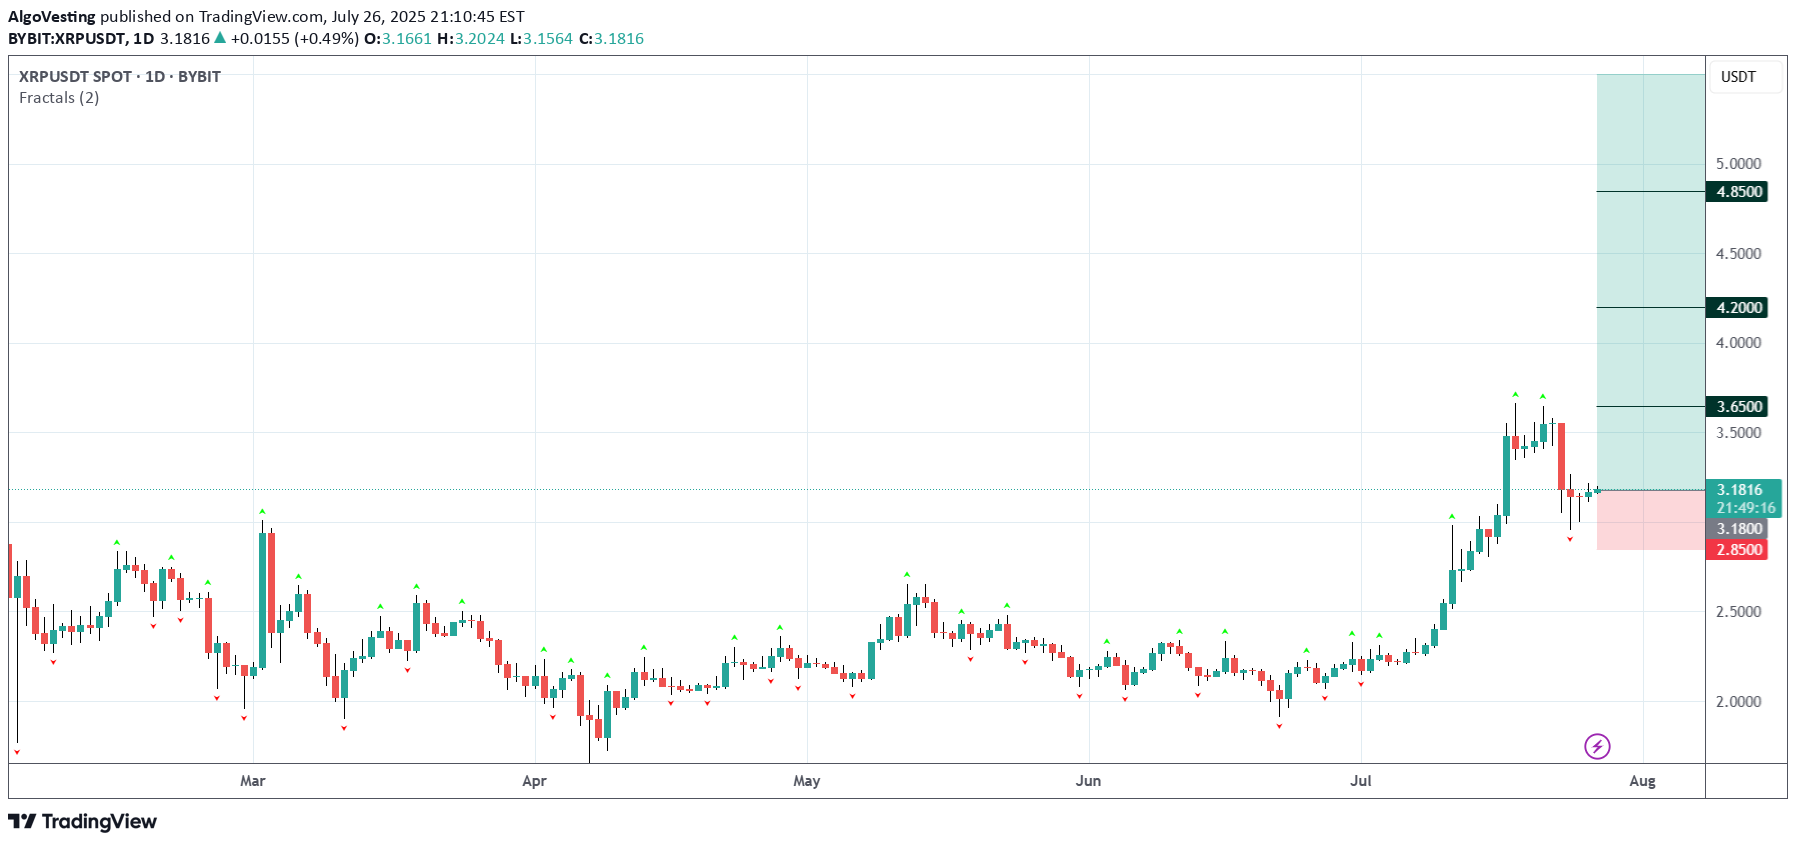
1. Chart Analysis First, let's confirm the technical setup on the daily chart. The chart shows a powerful rally in July, peaking around $3.60. The price then entered a retracement phase, pulling back as expected. It has now dropped to the $3.15 - $3.20 zone. As we identified, this level is critical. It was the peak of the rally in early March 2025. The price is currently testing this old resistance level, and we are looking for it to act as new support. The most recent daily candle is green and appears to be bouncing right off this level. This is a textbook "support and retracement" setup, making it a prime candidate for an immediate long market entry. 2. Sentiment and Fundamental Analysis Now, let's see if the news supports our bullish technical outlook. "Nasdaq Firm Files $50M Plan to Integrate XRP into Core Operations" (13 hours ago) & "Nasdaq-Listed Firm Bets on XRP for Payments, Treasury in SEC Filing" (2 hours ago): This is highly significant and bullish news. A publicly-traded company integrating XRP into its core operations and treasury with a $50M plan is a massive vote of confidence. It signals real-world adoption and institutional interest, which are powerful drivers for price. "Wellgistics Taps XRP for Payments, Collateral, and Income Plans" (22 hours ago): Another concrete example of real-world utility. A logistics company using XRP for payments and collateral reinforces the core use case for the token. This is fundamentally bullish. "XRP Golden Cross Confirmed: Could This Be the Spark for a Major Breakout?" (24 hours ago): A "Golden Cross" (when a short-term moving average crosses above a long-term one) is a classic technical buy signal that many traders follow. While it's a lagging indicator, news articles highlighting it can create bullish sentiment and attract more buyers. "Ripple CEO Exposes DeFi Power Move as 35M XRP Suddenly Changes Hands" (17 hours ago): This headline is slightly ambiguous but points to significant on-chain activity and strategic moves by Ripple's leadership in the DeFi space. Large token movements often precede significant price action and suggest strategic positioning, which in this context, appears bullish. Overall Sentiment: The sentiment is overwhelmingly bullish. The news is not just hype; it's focused on concrete, fundamental developments like institutional adoption (Nasdaq firm, Wellgistics) and treasury integration. This aligns perfectly with our bullish technical setup. Decision: Proceed with the long trade. The technicals and fundamentals are in strong alignment. The Trade Plan: XRPUSDT (Long) The plan is set. We're entering a long position with a market entry now, around $3.18. Entry Reason: Entering a long position as the price retraces to a key historical resistance level ($3.15-$3.20) that is now acting as support. The entry is confirmed by a bounce on the daily chart and overwhelmingly positive news about institutional adoption and real-world utility. Stop Loss (SL): $2.85 Reason: This level is safely below the current support zone and below the recent swing low of the pullback. A break below $2.90 would invalidate the "resistance-turned-support" thesis. Placing the SL at $2.85 gives the trade room to fluctuate without stopping us out prematurely. Take Profit 1 (TP1): $3.65 (Moonbag Target) Reason: This target is just above the most recent high. A move to this level would confirm the uptrend has resumed. It's a logical place to take initial profits as there may be some sellers at the previous peak. Action: At TP1, we take some profit and move the trailing stop to our entry price (~$3.18) to make the remainder of the trade risk-free. Take Profit 2 (TP2): $4.20 Reason: This is a key psychological level and corresponds to a standard Fibonacci extension target (1.272 extension) projected from the previous major swing. It represents a logical next stop for the rally. Action: When TP2 is hit, move the trailing stop up to the TP1 level ($3.65) to lock in profits. Take Profit 3 (TP3): $4.85 Reason: This level aligns with the 1.618 Fibonacci extension, a very common target in strong trends, and is approaching the major psychological number of $5.00. Action: When TP3 is hit, move the trailing stop up to the TP2 level ($4.20). Take Profit 4 (TP4): $5.50 (Final Target) Reason: This is our optimistic final target. It represents a significant psychological milestone and a potential area for a major trend peak. Action: Close all remaining positions. Conclusion: The XRPUSDT long trade is a high-quality setup where both technical and fundamental factors are aligned. The risk is well-defined, and the profit targets offer a strong reward potential. The plan is now in place.
AlgoVesting
HYPEUSDT - Analysis for Immediate Long Entry
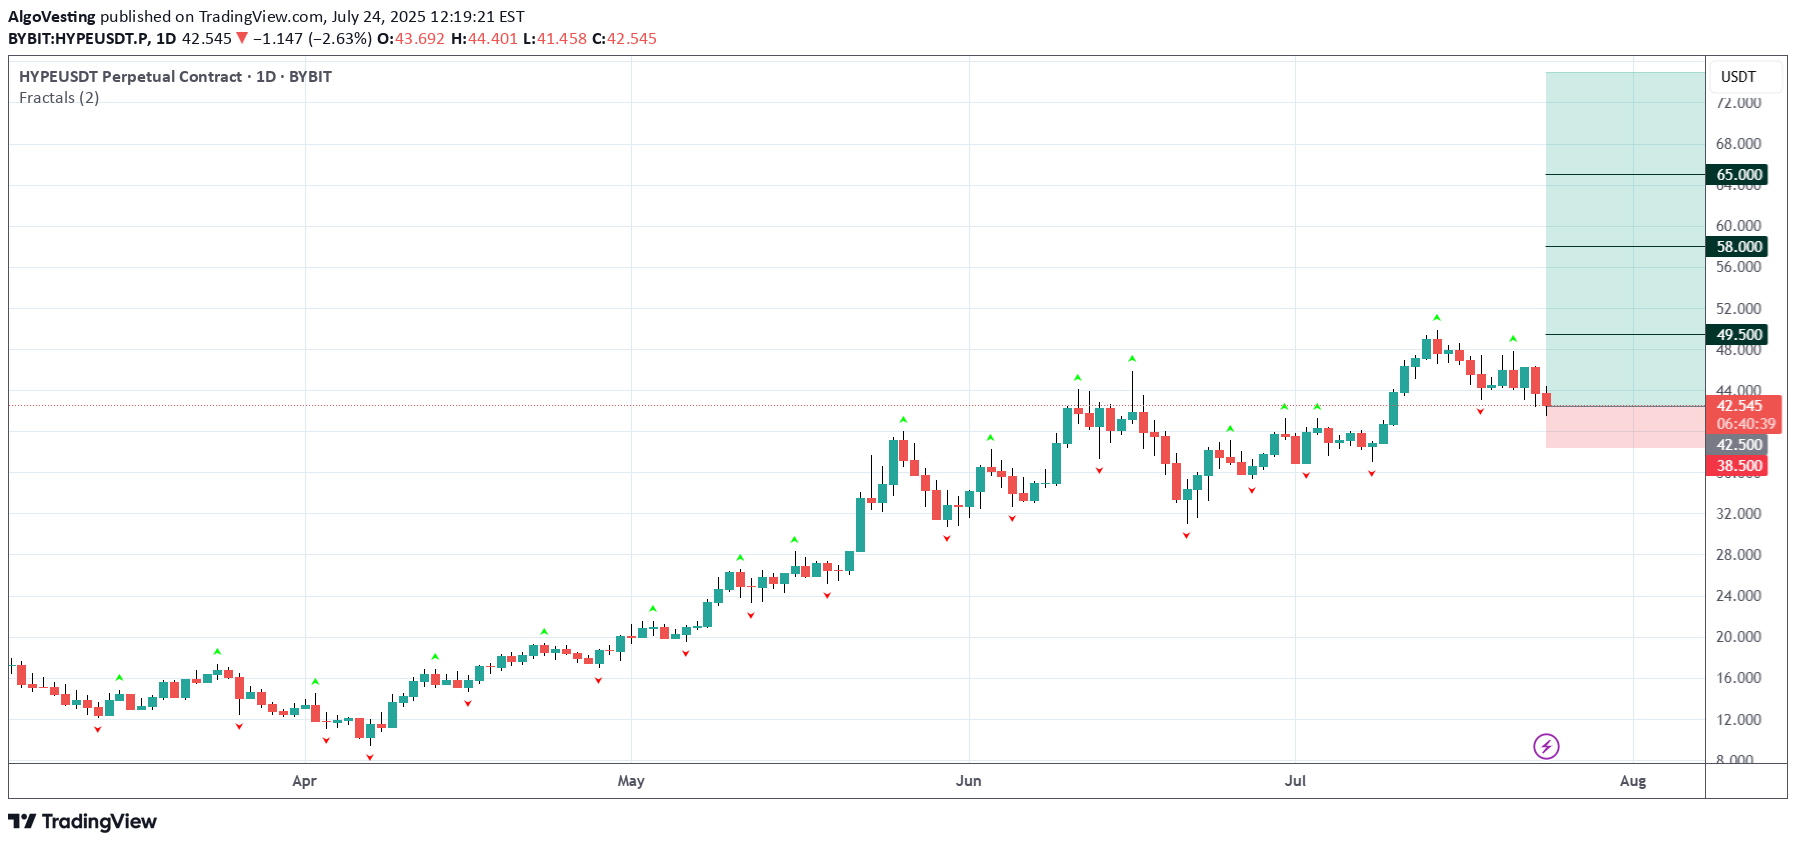
Chart Analysis Looking at the daily chart, the story is pretty clear. HYPE has been in a powerful uptrend since April. We saw it hit a recent high of around $49-$50. As expected after such a strong run, a pullback has started. The price has now retraced to the $42.50 level. This is significant. This exact area was the peak of the previous rally in early July. Old resistance becoming new support is one of the most reliable patterns in trading. The chart shows the price is currently testing this level. The small green arrows (fractals) on the chart confirm these key swing points. This is our entry zone. The setup looks solid for a long position. Sentiment Analysis (The "Why") Time to check the news to see if it supports our technical view. Positive News: "Zircuit Launches 'Hyperliquid' to Simplify and Secure Cross-Chain DeFi Trading" (1 hour ago): This is fresh, positive news. New integrations and launches on the Hyperliquid platform suggest ecosystem growth and user adoption, which is fundamentally bullish for the HYPE token. "Whale Deposits $3M USDC for 20x ETH Long" (10 hours ago): This shows that large, sophisticated traders ("whales") are actively using the platform for significant trades. High volume and large positions signal confidence in the platform's reliability and liquidity. "Ethereum News: James Wynn Opens 25x Leveraged Position Worth 12 Million on Hyperliquid" (1 day ago): More evidence of heavy hitters using the platform. This kind of activity can attract more users and build a strong reputation. Negative News (The "Noise"): "Hype News: Why is HYPE's price down today?" (3 hours ago): This article is likely just explaining the natural price correction we're seeing on the chart. It's not necessarily bearish; it's just market dynamics. A pullback after a strong rally is healthy and expected. It doesn't change the underlying bullish structure. Overall Sentiment : The sentiment is bullish. The price dip appears to be a technical retracement, while the news flow points to strong fundamentals and growing adoption of the Hyperliquid platform. This combination of a technical setup and positive sentiment gives me the confidence to proceed. The Trade Plan It's time to define the levels. We're going long with a market entry now, around $42.50. Entry Reason: Entering a long position based on the price retracing to a key support level (previous resistance) in a clear uptrend, supported by positive news flow. Stop Loss (SL): $38.50 Reason: A break below $39.00 would invalidate our trade idea. This level is clearly below the current support zone and below the swing low from mid-July. Placing the SL at $38.50 gives the trade enough room to breathe without risking a catastrophic loss if we're wrong. Take Profit 1 (TP1): $49.50 (Moonbag Target) Reason: This is just below the recent all-time high of ~$50. It's a logical first target where the price might face resistance. Hitting this level would be the first confirmation that the uptrend is resuming. Action: At this point, we take initial profits and move the trailing stop to our entry price to make the rest of the trade risk-free. Take Profit 2 (TP2): $58.00 Reason: This is a psychological and technical extension level. A common way to project a target after breaking an all-time high is using Fibonacci extensions or measured moves. A move to $58 would represent a significant new leg up. Action: When TP2 is hit, we move the trailing stop up to the TP1 level ($49.50) to lock in more profit. Take Profit 3 (TP3): $65.00 Reason: This represents the next major psychological number and a potential area for a medium-term top. It continues the measured move projection from the previous price swings. Action: When TP3 is hit, we move the trailing stop up to the TP2 level ($58.00). Take Profit 4 (TP4): $75.00 (Final Target) Reason: This is our "blue sky" target. In a strong bull market, assets can run much further than expected. $75 is a major psychological milestone and a reasonable final target for this trade. Action: Close all remaining positions. Conclusion: The plan is set. The HYPEUSDT trade offers a good risk-to-reward ratio based on a solid technical setup and bullish sentiment. We enter now and manage the trade according to the plan. Let's see how it plays out.
AlgoVesting
Comprehensive Analysis: SHORT Signal on XRPUSDT
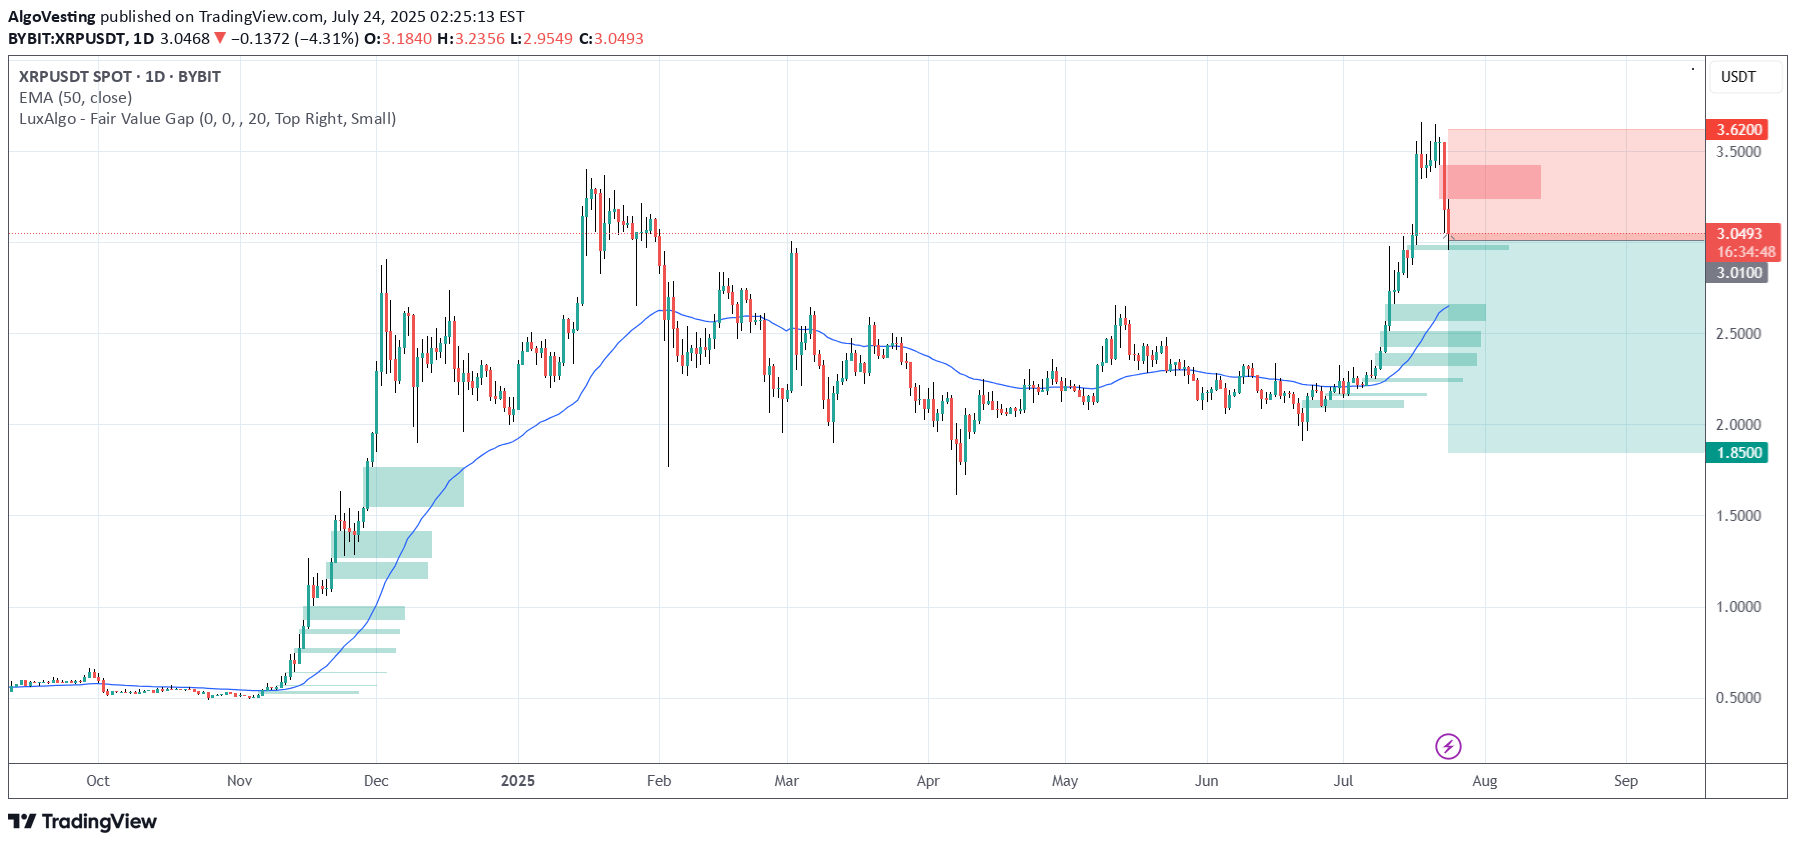
1. News Analysis (Market Sentiment) The news actually reflects a strongly positive sentiment for XRP’s long-term fundamentals: "Brazil's VERT Debuts Tokenized Credit Platform on XRP Ledger With $130M Issuance" : This is a very bullish piece of news. It highlights real-world adoption of the XRP Ledger (XRPL) for high-value transactions. "VERT Launches Blockchain Platform on XRPL for $130M Deal" : This is the same news reported by a different source, confirming the significance of this adoption. Bridging the Analysis: Here lies the crucial difference between investors and traders. As long-term investors, this kind of news would motivate us to buy and hold XRP. But as day traders, we understand the common market behavior of “Buy the Rumor, Sell the News.” The massive price rally before this announcement might indicate the market already anticipated this news. Now that the news is official, early buyers may begin taking profits, triggering selling pressure. Sentiment Conclusion: While the news is fundamentally positive, it could strengthen the case for a SHORT position in the short term. This “sell on good news” reaction is a common phenomenon in trading. 2. Technical Analysis (Chart Structure) The daily chart of XRPUSDT supports a SHORT position even more convincingly: Climactic Top Rejection : A sharp price rally ends with a long upper wick candle around the $3.60 area. This is a classic sign of buyer exhaustion and aggressive seller entry. Short-Term Bearish Structure : A large red candle formed after the top, signaling that sellers have taken control. The current price is trading well below that top, confirming the rejection was valid. Room for Correction : Below the current price, there’s a clear “gap” or market inefficiency. The first logical target for a correction is around $2.80 - $2.90, where the 50 EMA meets the upper edge of the Fair Value Gap (green box). This gives us a clean profit target. Combined Conclusion: Yes, based on a combination of “Sell the News” sentiment and clear bearish technical structure, the argument for a SHORT position on XRPUSDT is very valid. We are going against the positive headlines, but following price action signals. Trading Plan: SHORT Operation on XRPUSDT Position: SHORT Asset: XRPUSDT (Perpetual Contract) Current Status: ENTRY Entry Reason: We’re entering based on short-term bearish momentum after a strong rejection from the supply zone, expecting the price to fill the inefficiency below. Entry Type: Market Order Why: The bearish move is in progress. We want to catch it now before the price drops further and skips our limit order. We'll execute at the current market price (~$3.01). Stop Loss (SL): $3.62 Why: Placed slightly above the previous swing high. If price breaks this level, our SHORT thesis is invalid, and we exit to prevent further losses. Take Profit (TP) Targets & Risk/Reward: We'll scale out profits in phases to lock in gains. TP1: $2.85 Why: Confluence of 50 EMA and top of Fair Value Gap Risk/Reward: ~1:2.8 (Risking $0.61 to gain $1.75 — very healthy ratio) TP2: $2.55 Why: Mid-point of the Fair Value Gap — a common magnet for price TP3: $2.25 Why: Full gap fill + retest of prior support/resistance area TP4: $1.85 Why: Ambitious target — filling the second, deeper Fair Value Gap. Possible in a panic-driven selloff. Position Management: Once TP1 is hit: Move SL to Entry ($3.01) to secure a risk-free trade on the remaining position. We’ll continue to monitor the price and adjust the trailing stop loss as each TP level is reached.
AlgoVesting
LINK/USDT Long Setup: Technical Bounce + Chainlink Fundamentals

Technical Analysis (LINK/USDT): The daily chart highlights a strategic entry at 14.019, following a bounce from the 11.90–14.03 support zone, a level with prior consolidation and buying interest. The stop-loss at 11.99 sits below this support, guarding against a breakdown, while the take-profit at 26.51 targets the 24.26–26.54 resistance zone—a previous high with selling pressure—yielding a ~1:5 risk-reward ratio. Recent bullish rejection at support, paired with rising volume, signals potential upward momentum. Fundamental Analysis (Chainlink/LINK): Chainlink’s fundamentals are strong in 2025. The expansion of its CCIP protocol has boosted cross-chain interoperability, increasing adoption in DeFi. New partnerships with Polygon and Avalanche have solidified its ecosystem, driving LINK demand. Additionally, the rise in real-world asset tokenization has heightened reliance on Chainlink’s oracles for accurate data, supporting LINK’s value. However, crypto market volatility and regulatory risks remain key concerns. This trade blends a high-probability technical setup with robust fundamentals, making it a compelling opportunity.
AlgoVesting
ADA/USDT: Potential Long Setup from Key Support Zone

Taking a closer look at a potential long opportunity on Cardano (ADA/USDT) with the following parameters: Entry: Around $0.6938 Stop Loss: $0.6098 Take Profit: $1.1880 Technical Breakdown: ADA is currently interacting with a critical price zone between $0.6800 and $0.7200. This area has demonstrated historical relevance, acting as both support and resistance in recent months, notably providing a floor for price action through mid-May. My entry anticipates this zone will once again attract buying interest after the recent pullback. The stop loss at $0.6098 is strategically placed below the significant swing low established in late April. A breach of this level would likely invalidate the current market structure and could signal a more profound bearish continuation. The take profit target at $1.1880 aims for the prominent highs last seen in early March. This ambitious target reflects an expectation of a strong recovery and implies a potential shift in momentum, possibly fueled by a confluence of technical strength and positive catalysts. The risk/reward ratio here is compelling, sitting near 5.8:1. Fundamental Watch: Keep a keen eye on Cardano-specific news. Developments in their ecosystem, progress on roadmap milestones like Voltaire or Hydra enhancements, or significant partnership announcements could provide the necessary bullish impetus for such a move. As always, broader market sentiment will also play a crucial role.
AlgoVesting
XRP/USDT: Long Opportunity with Favorable R:R

Just entered a long position on XRP/USDT. Here's my quick take: Entry: $2.1569 Stop Loss: $2.0388 Take Profit: $3.1512 Technical Rationale: Eyeing a bounce from a clear support zone around $2.04-$2.10, where we've seen buying interest before. My SL is tucked just below this area. The target at $3.1512 is a significant previous resistance level from early May. This setup offers a compelling risk/reward ratio of over 8:1. Watching for price to hold this support and confirm the upward move. Potentially a mitigation play if recent lows were a liquidity grab. Fundamental Check: Always crucial with XRP – keeping a close eye on any breaking news regarding Ripple and the SEC, as that can heavily influence price. Positive developments could fuel this move.
AlgoVesting
TON Would Hit 13.29

TONUSDT is a promising buy on the spot market, given its bullish technical structure and strong fundamentals tied to Telegram’s ecosystem. $13.29 take-profit target is ambitious but achievable in a 2025 bull run, especially with catalysts like NFT integration and Bitcoin’s rally. Only for SPOT!! Events for consideration: NFT Integration : Telegram’s launch of stickers as NFTs in April 2025 is a positive catalyst, potentially increasing TON’s utility and user engagement. Pavel Durov’s Move : Durov’s relocation to Dubai in March 2025 fueled a 50% price surge, signaling confidence in TON’s future. Market Activity : A 35% increase in open interest and 2.97 million TON traded in 24 hours (April 2025) reflect strong market interest. Crypto Market Rally : Bitcoin’s rise to $90,000 and altcoin momentum in April 2025 create a favorable environment for TON’s price growth. Bearish Risks : Negative funding rates and potential long liquidations at $2.54 (March 2025) highlight short-term volatility risks.
AlgoVesting
ETH Would Hit $6.000

Buying ETH on the spot market now could be a good opportunity if prices are near support ($1,800–$2,500) and technical indicators signal a bottom. Ethereum’s strong fundamentals and upcoming catalysts (Pectra, ETFs) support a hold strategy, with $6,494 as a viable profit-taking target in a bull run. Holding beyond $6,494 could capture further upside for long-term holder, but secure profits incrementally to hedge against volatility. Only for SPOT Market!!! Some news for my own consideration: Pectra Hard Fork (April 2025) : The upcoming hard fork, set for May 2025, is a significant bullish catalyst. It will enhance Ethereum’s scalability, security, and user experience, potentially attracting more developers and users. Spot ETH ETFs : Ethereum’s U.S. spot ETF approval is a major milestone, with analysts noting its potential to drive demand. Posts from July 2024 suggested the market underestimated ETF impacts, which could materialize in 2025. Market Volatility : Ethereum faced significant declines, hitting its lowest level since November 2023 in March 2025 (down 15% in 24 hours). However, it showed resilience trading above $1,800 amid stock market turmoil in April 2025. Whale Activity : Large ETH holders have been active, with some selling for profits before market crashes (e.g., $399M moved in February 2025). This suggests potential price suppression but also opportunities to buy during dips. Broader Crypto Market : Bitcoin’s rally to $90,000 in April 2025 amid a turbulent stock market has spilled over to altcoins like ETH, supporting a bullish sentiment. A pause in U.S. tariffs also lifted risk sentiment, benefiting ETH.
AlgoVesting

Disclaimer
Any content and materials included in Sahmeto's website and official communication channels are a compilation of personal opinions and analyses and are not binding. They do not constitute any recommendation for buying, selling, entering or exiting the stock market and cryptocurrency market. Also, all news and analyses included in the website and channels are merely republished information from official and unofficial domestic and foreign sources, and it is obvious that users of the said content are responsible for following up and ensuring the authenticity and accuracy of the materials. Therefore, while disclaiming responsibility, it is declared that the responsibility for any decision-making, action, and potential profit and loss in the capital market and cryptocurrency market lies with the trader.