
ZEN
Horizen
| تریدر | نوع سیگنال | حد سود/ضرر | زمان انتشار | مشاهده پیام |
|---|---|---|---|---|
 Javlonbek4000Rank: 1192 | خرید | حد سود: تعیین نشده حد ضرر: تعیین نشده | 12/5/2025 | |
 SaykoCryptoRank: 5445 | خرید | حد سود: تعیین نشده حد ضرر: تعیین نشده | 12/3/2025 | |
 Alpha-GoldFXRank: 31891 | خرید | حد سود: تعیین نشده حد ضرر: تعیین نشده | 12/8/2025 |
Price Chart of Horizen
سود 3 Months :
سیگنالهای Horizen
Filter
Sort messages by
Trader Type
Time Frame
Alpha-GoldFX
ZENUSDT Forming Falling Wedge
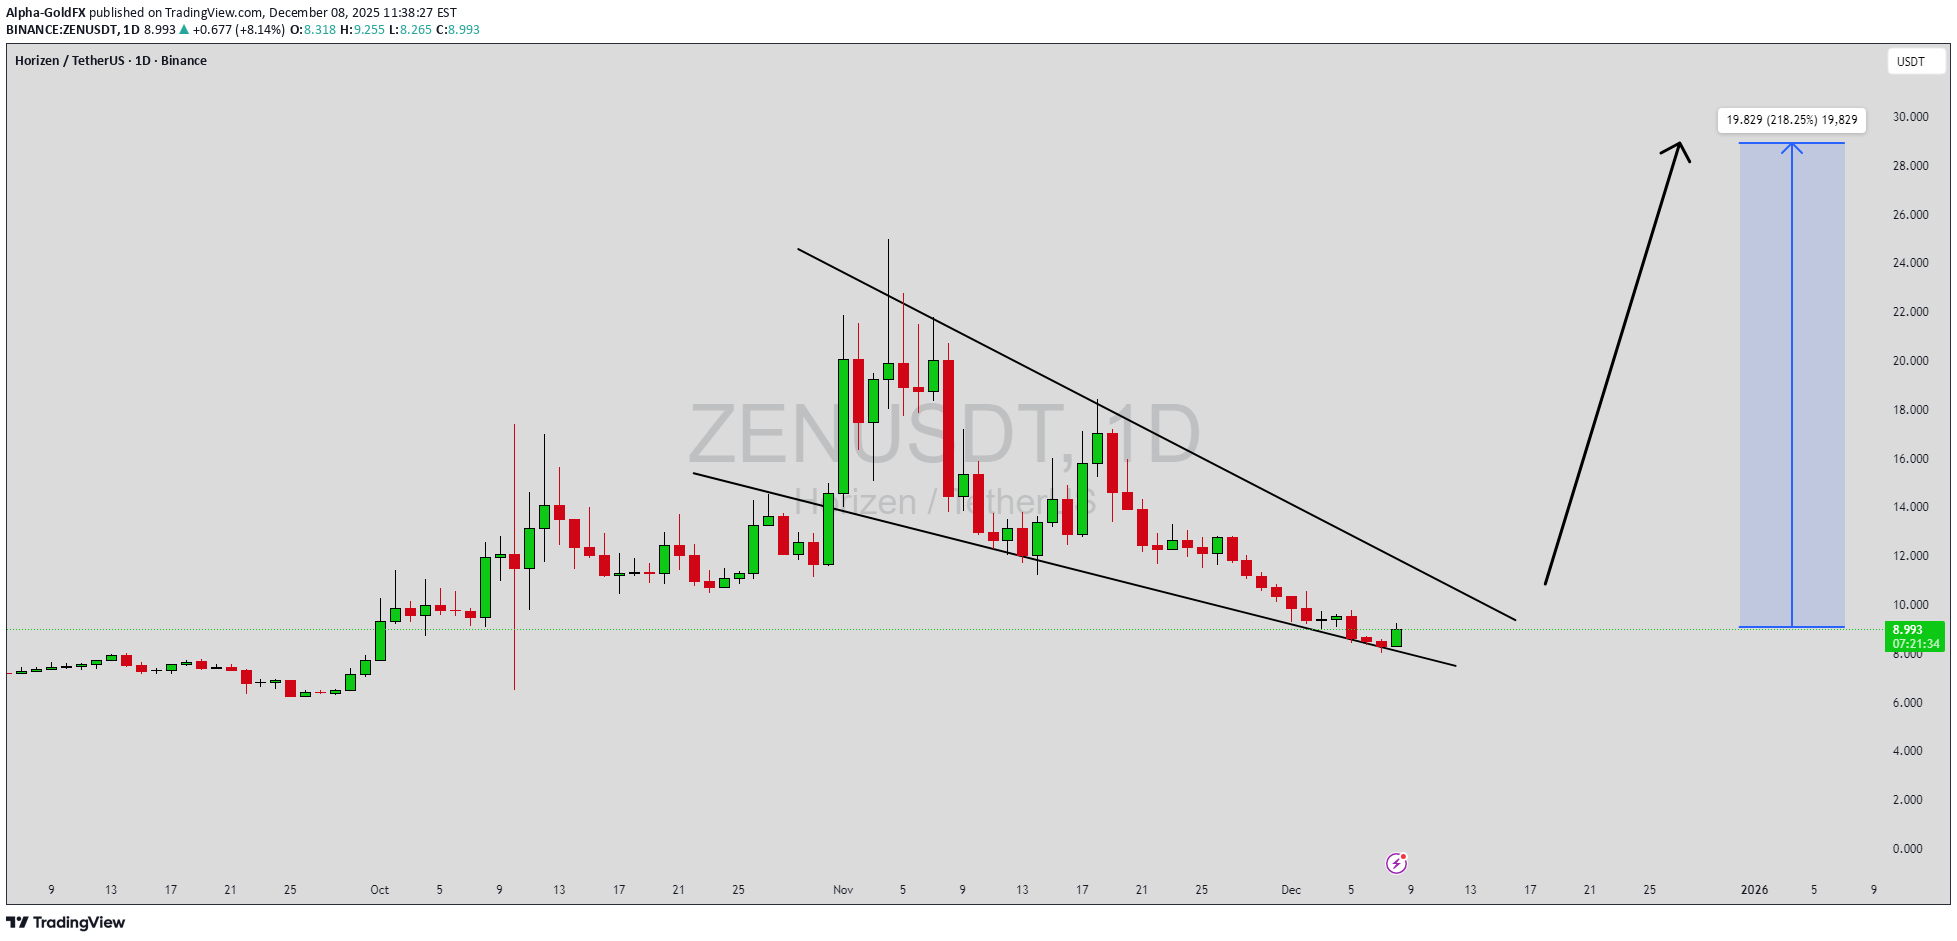
ZENUSDT is forming a clear falling wedge pattern, a classic bullish reversal signal that often indicates an upcoming breakout. The price has been consolidating within a narrowing range, suggesting that selling pressure is weakening while buyers are beginning to regain control. With consistent volume confirming accumulation at lower levels, the setup hints at a potential bullish breakout soon. The projected move could lead to an impressive gain of around 190% to 200% once the price breaks above the wedge resistance. This falling wedge pattern is typically seen at the end of downtrends or corrective phases, and it represents a potential shift in market sentiment from bearish to bullish. Traders closely watching ZENUSDT are noting the strengthening momentum as it nears a breakout zone. The good trading volume adds confidence to this pattern, showing that market participants are positioning early in anticipation of a reversal. Investors’ growing interest in ZENUSDT reflects rising confidence in the project’s long-term fundamentals and current technical strength. If the breakout confirms with sustained volume, this could mark the start of a fresh bullish leg. Traders might find this a valuable setup for medium-term gains, especially as the wedge pattern completes and buying momentum accelerates. ✅ Show your support by hitting the like button and ✅ Leaving a comment below! (What is your opinion about this Coin?) Your feedback and engagement keep me inspired to share more insightful market analysis with you!

Bithereum_io
ZENUSDT 12H
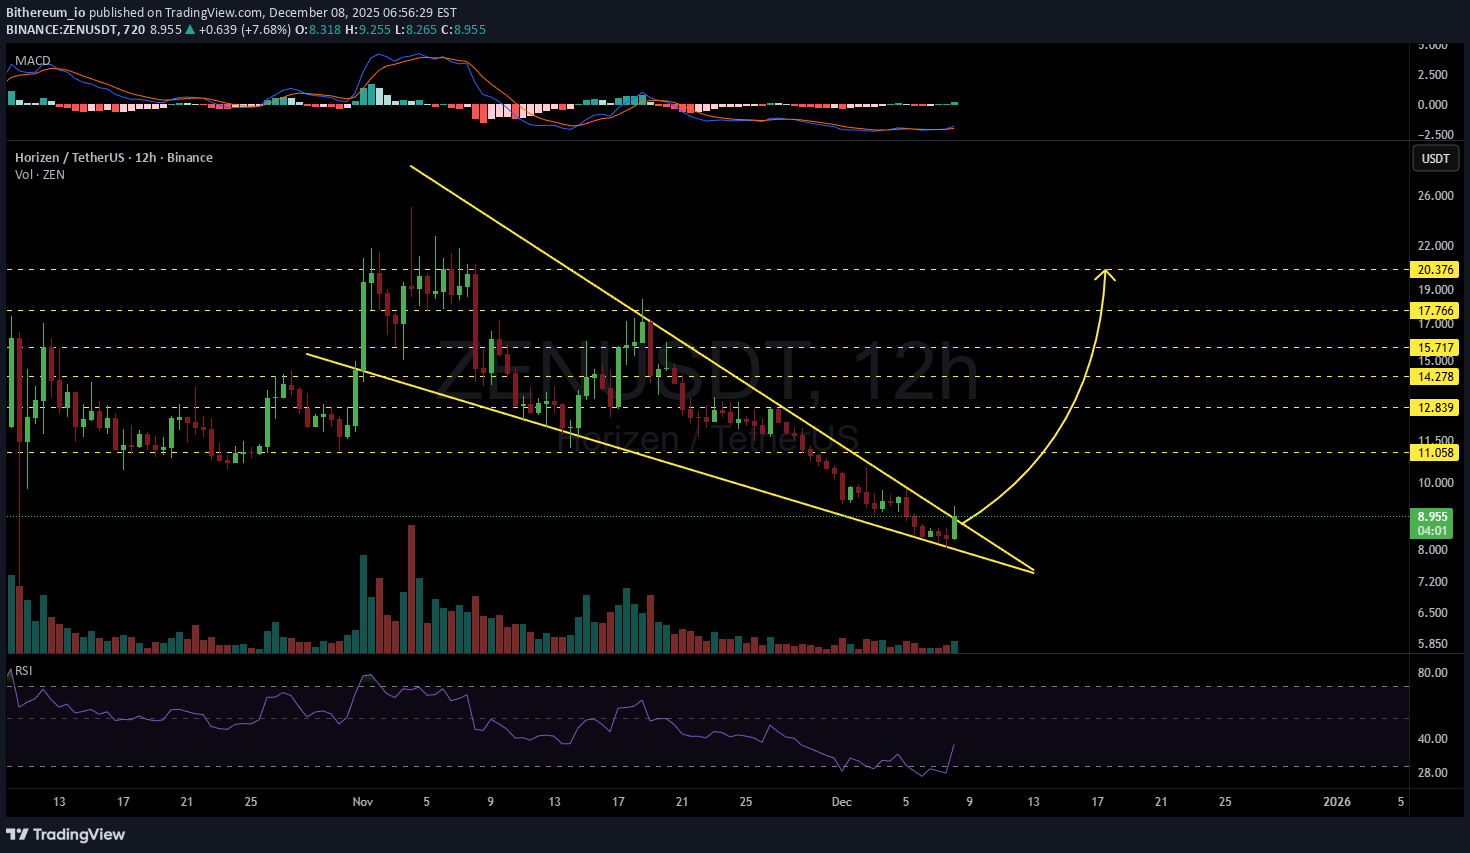
#ZEN is on the verge of breaking out above the wedge resistance on the 12H timeframe. Keep an eye on it. If the breakout happens, the potential upside targets are: 🎯 $11.058 🎯 $12.839 🎯 $14.278 🎯 $15.717 🎯 $17.766 🎯 $20.376 ⚠️ Always remember to use a tight stop-loss and maintain proper risk management.

پایان اصلاح زن (ZEN)؟ نقطه عطف قریبالوقوع در نمودار ۱۲ ساعته!
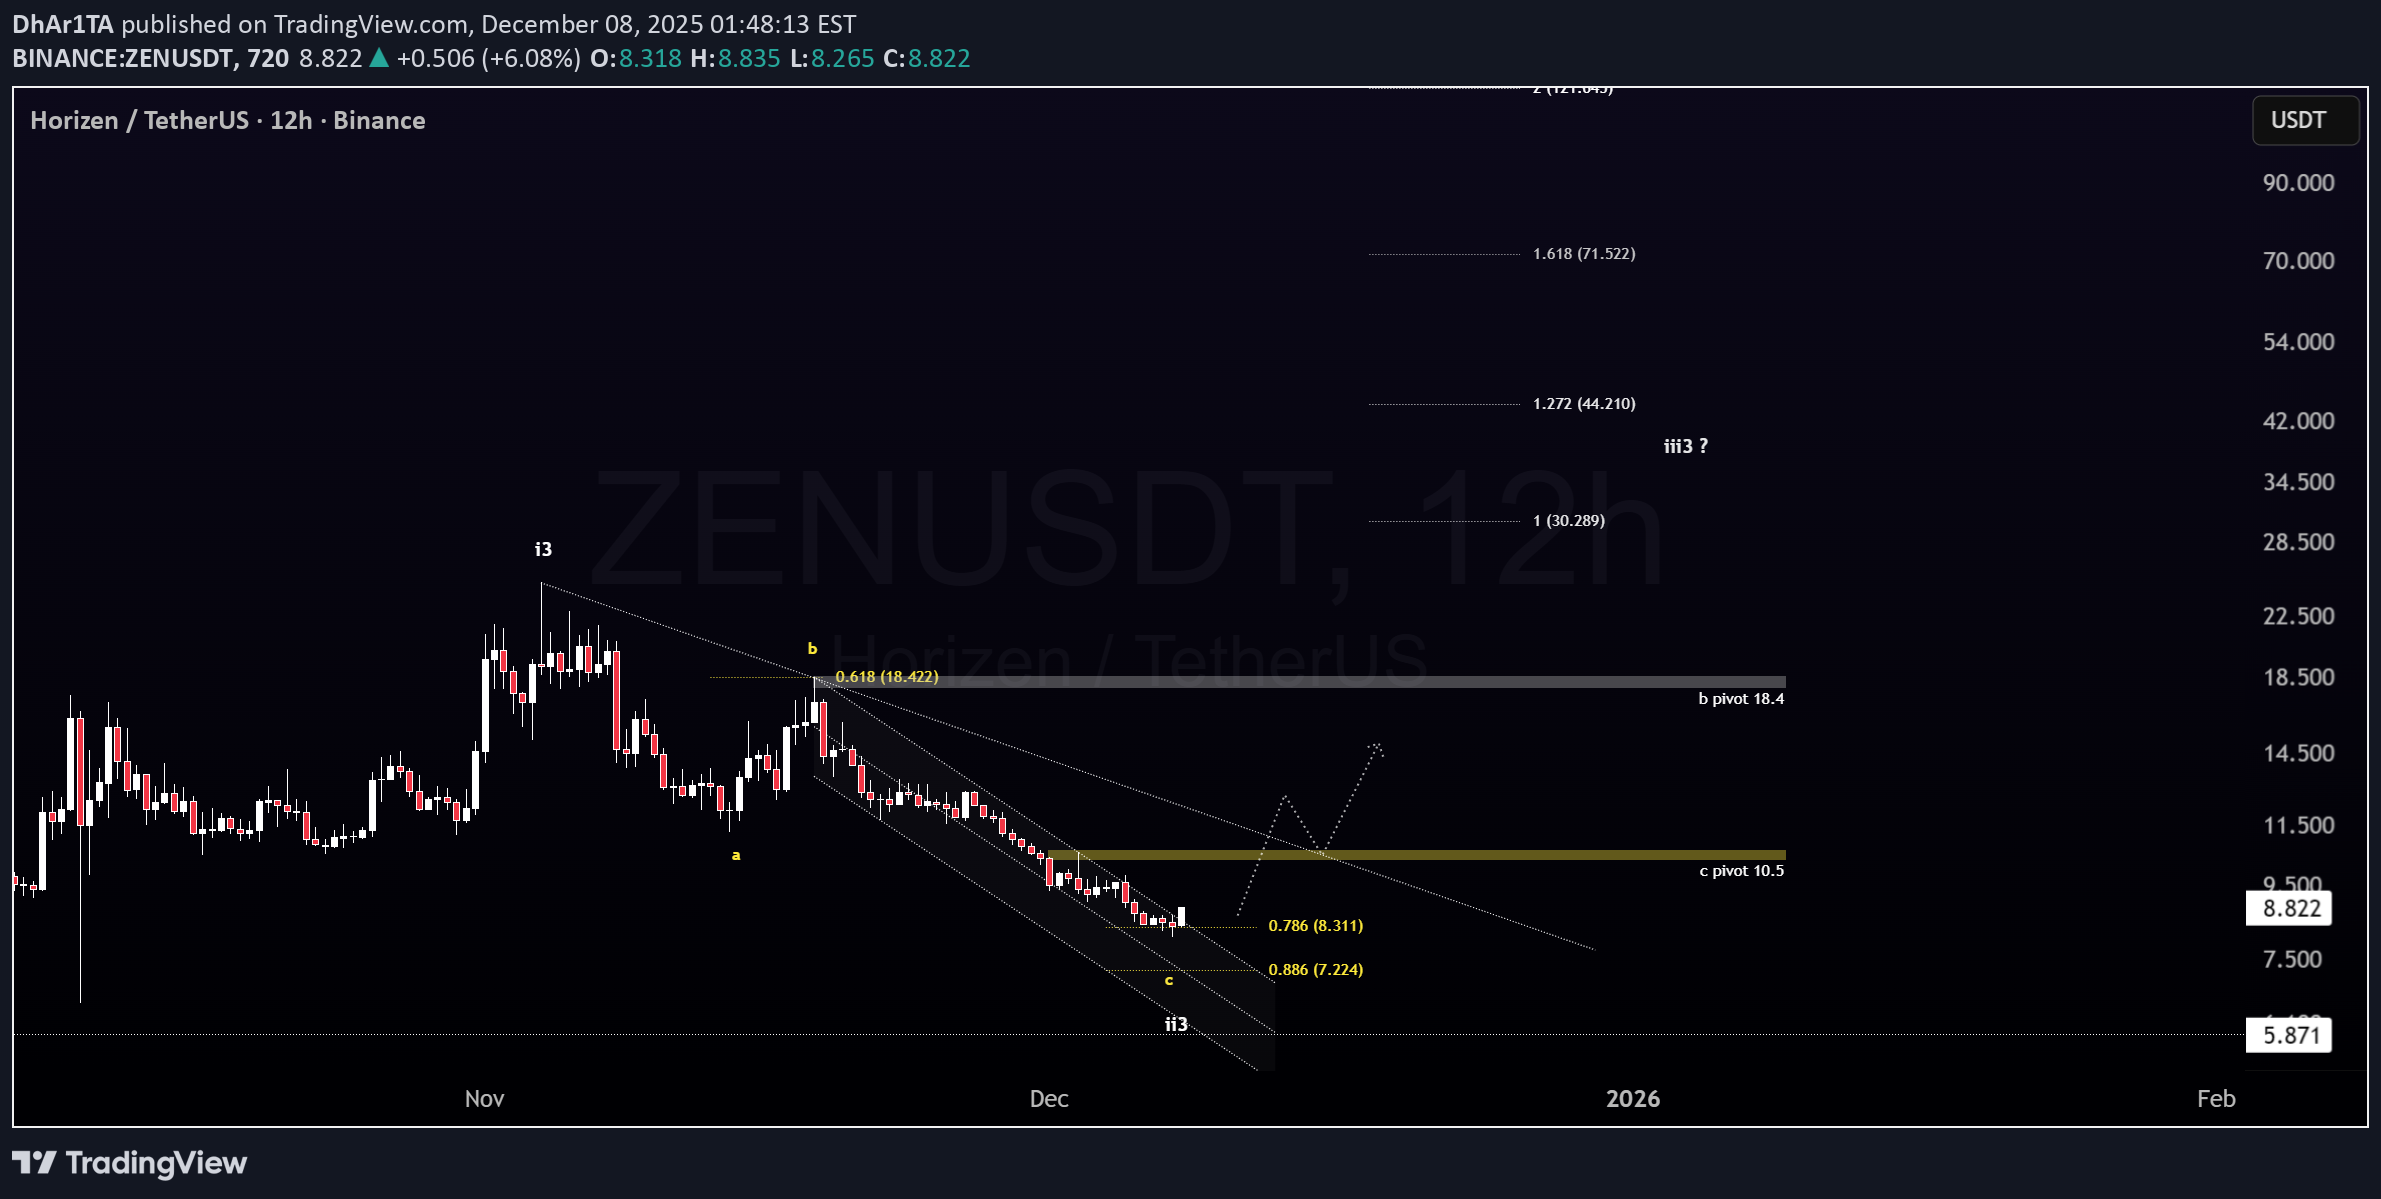
ZENUSDT Price appears to be completing what looks like a Wave ii structure within the larger Wave 3. The recent decline developed into a clean A-B-C corrective pattern and retraced into a deep correction zone - which aligns with typical Wave ii behavior. Momentum has been slowing, and price has been consolidating inside a descending channel, a common sign that the correction may be entering its final stage. There is still no confirmed reversal yet, but the recent price behavior suggests the market may be getting close to a potential turning point. A clean breakout above the channel would be the first meaningful indication that Wave iii may be forming. From an indicator standpoint, momentum is beginning to shift: selling pressure is fading, compression is forming, and early bullish signals are appearing - although confirmation has not triggered yet. - Not financial advice .... Update soon ..

DARKMEX
تاریخچه معاملات من: سفری به دنیای تریدینگ (بهروزرسانی در همین پست)
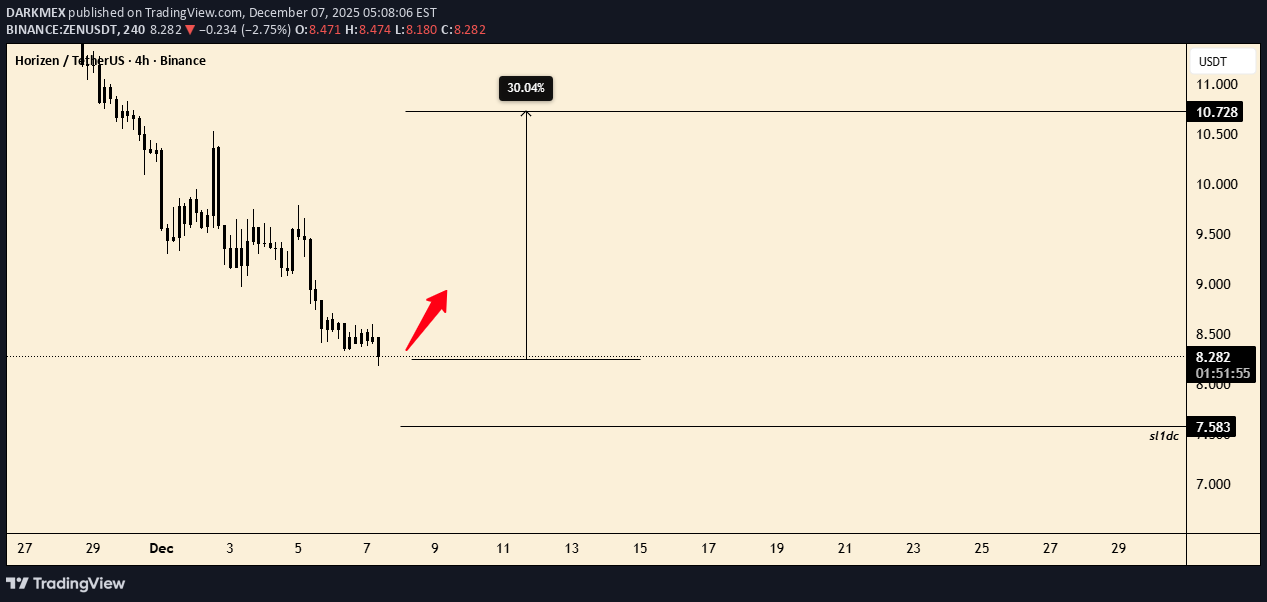
these trades reflect my trading histrory ..... any update will be on the same post .
Javlonbek4000
خرید احتمالی ZEN/USDT: سیگنال صعودی قوی از منطقه تقاضای روزانه!
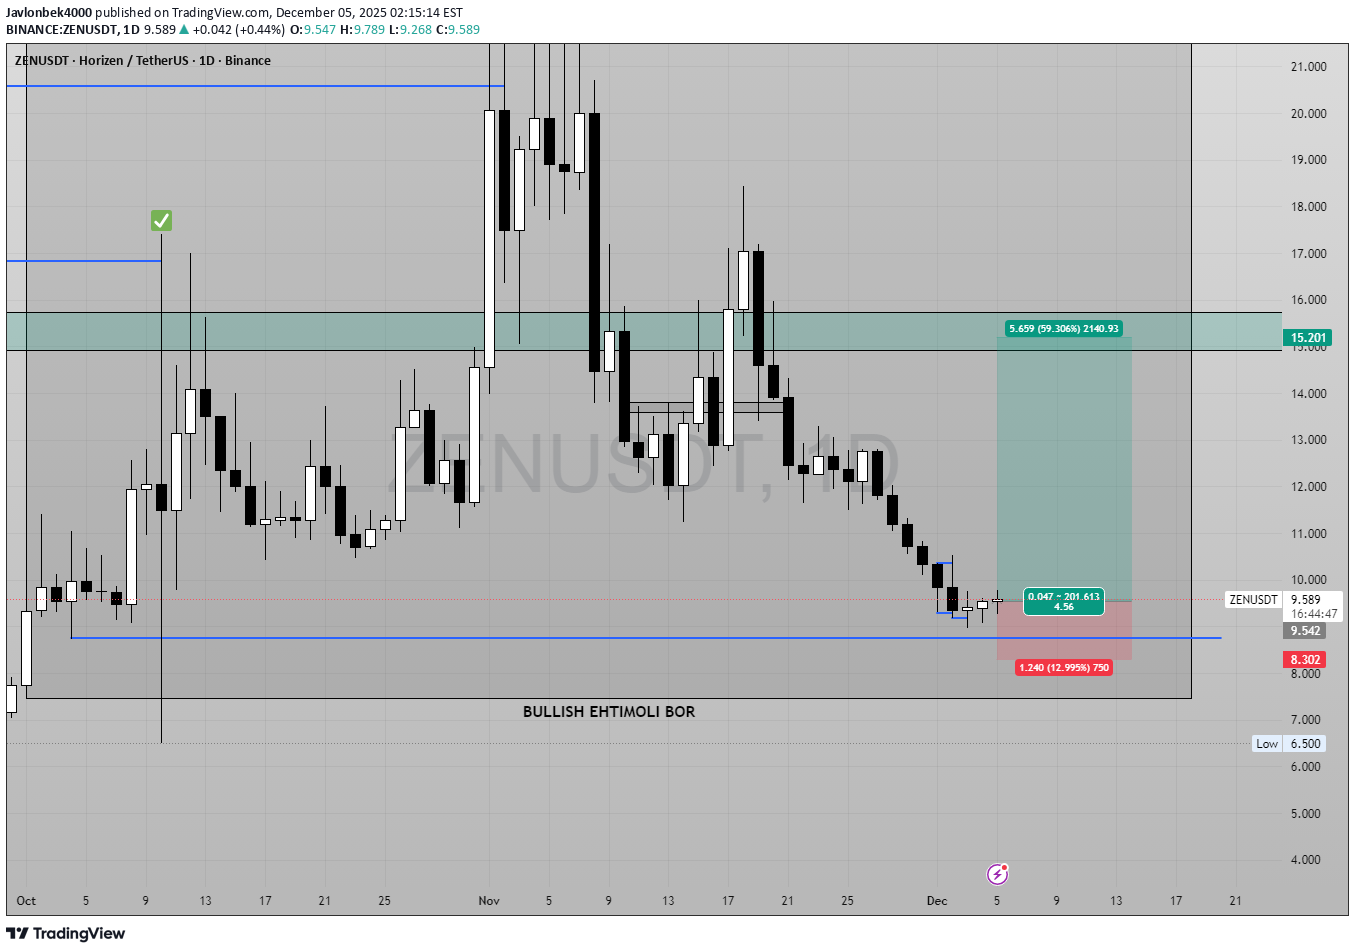
📈 ZEN/USDT – Daily Timeframe | Long Setup Explained 🟦 Market Context ZEN has reached a higher-timeframe demand zone after a prolonged correction. Daily bearish momentum is slowing down, and price is forming a potential reversal structure with consecutive equal-style lows and a rejection wick. 🔥 Why I’m Looking for a BUY Entry 1️⃣ HTF Demand Zone Price has tapped into a strong daily demand area that previously initiated a 60% impulse move. This increases the probability of a bullish reaction. 2️⃣ Liquidity Sweep The recent candle swept the previous swing low, collecting liquidity and forming a potential reversal point. 3️⃣ Bullish Reaction Candle The market printed a small bullish confirmation candle after the sweep, signaling buyer interest and absorption of selling pressure. 4️⃣ Favorable R:R Setup Defined invalidation level (SL) allows a clean long setup with a high reward potential toward untouched imbalance & supply zones above. 🎯 Target Levels TP1 — $12.00 First target at the midpoint of inefficiency + previous minor structure. Secure partial profits. TP2 — $15.20 Major daily supply zone. This is the main target where the previous drop originated. TP3 — $18.40 Extended target – the top of the macro range and the last unmitigated supply above. Price may reach this level if momentum continues. 📌 Trade Plan Summary Entry: Around $9.50 Stop-Loss: Below $8.95 TP1: $12.00 TP2: $15.20 TP3: $18.40 R:R Potential: ~6:1 to 9:1 depending on target ⚠️ Note This is not financial advice — the setup is based on HTF structure, liquidity behavior, and demand/supply dynamics.

AndeWave
ادامه ریزش ZEN: آیا حمایت ۹,۰۷۲ سقوط میکند؟
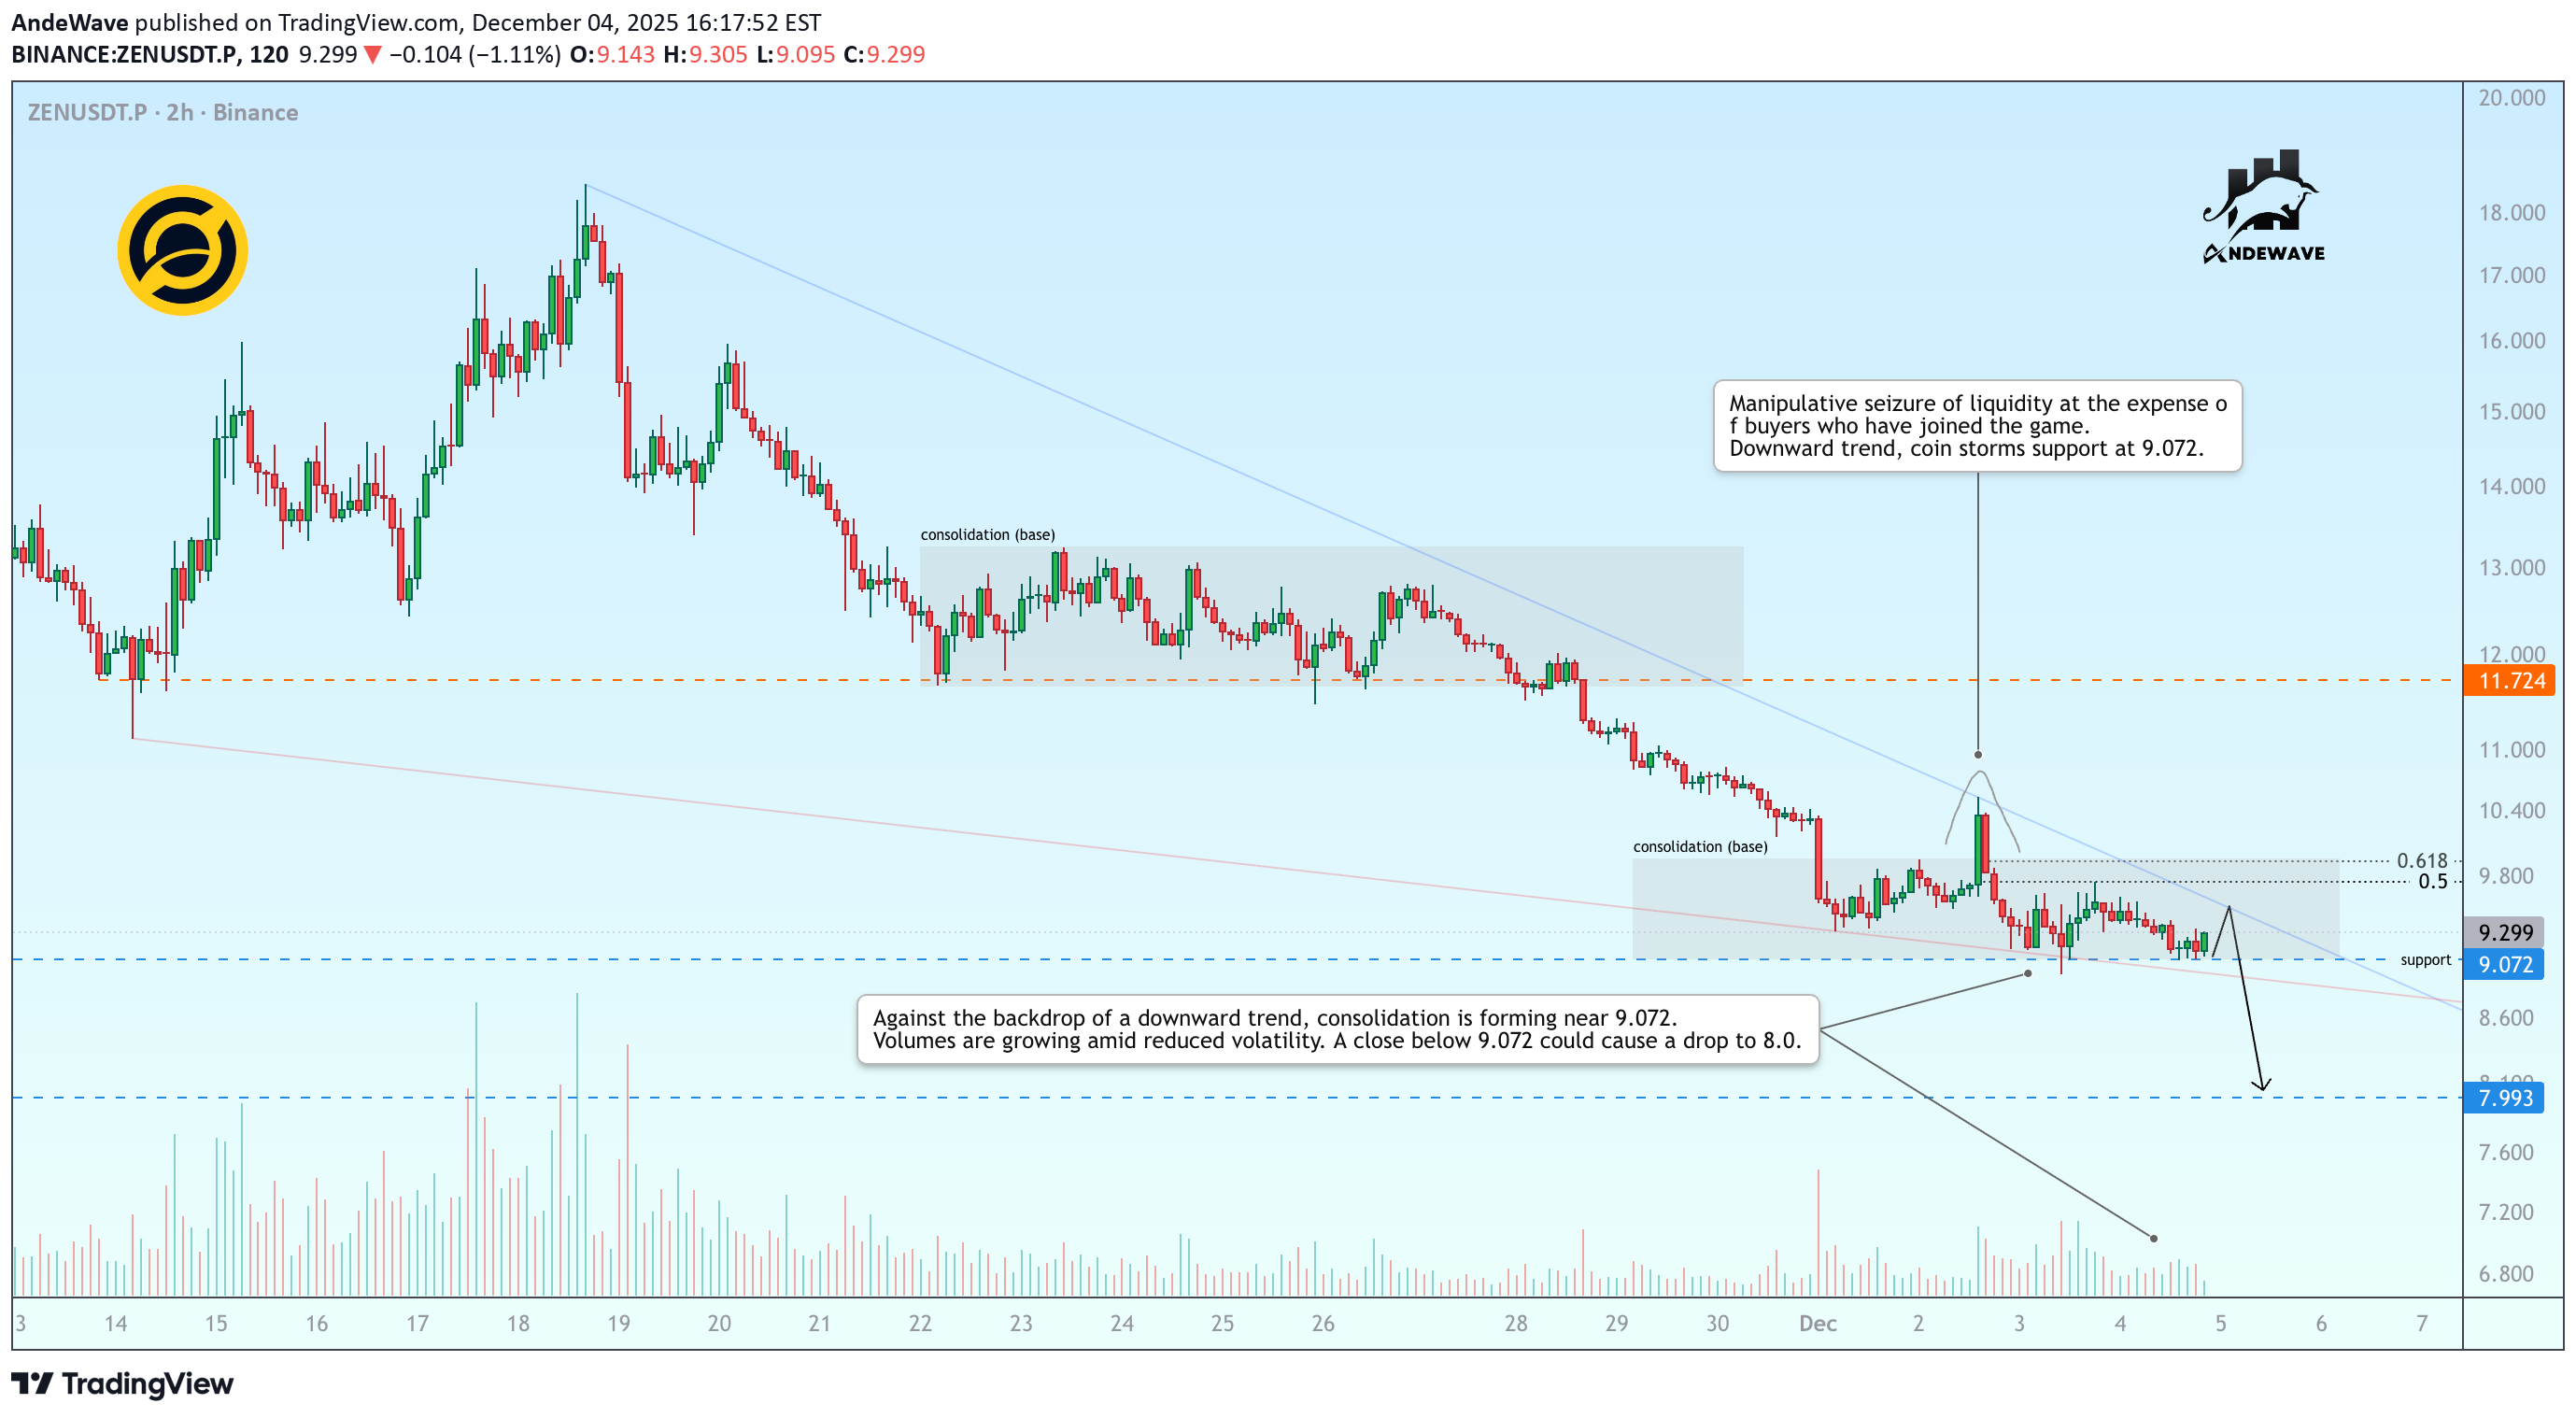
Under pressure from sellers, ZEN is storming the 9,072 support level. Global and local trends are downward. Manipulative withdrawal of liquidity at the expense of buyers who joined the game allowed large players to gather positions to continue the decline. Against the backdrop of a downward trend, consolidation is forming near 9.072. Volumes are growing amid reduced volatility. A close below 9.072 could cause a drop to 8.0
SaykoCrypto
تحلیل روزانه زن/تتر (ZEN/USDT): سطوح حیاتی رنج و اهداف لیکوئیدی احتمالی!
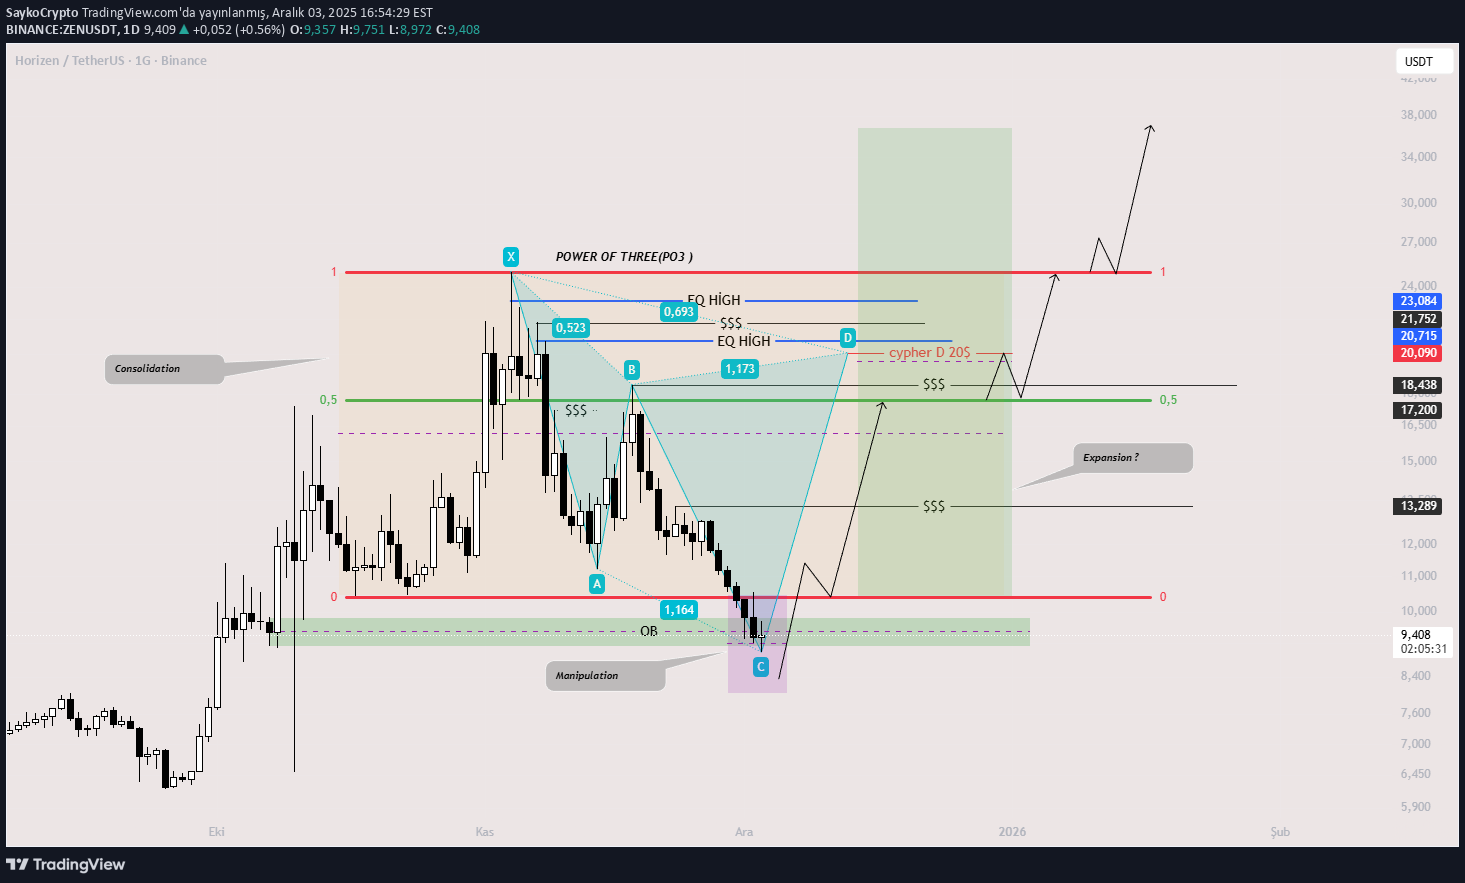
As the price enters the range on the daily chart, the target range middle band will be 18$. Our range middle band is above 18$, and after daily closings, our other target point will be range high, 25$ level. I made a possible cypher drawing. It is an imaginary drawing because point D has not been reached. When the price reaches point D, there may be profit sales. I marked the liq levels as eq highs and $$$ on the chart. When I examine the altcoin charts in general, the formations and their targets point to the 2nd week of December, let's watch and see. Will there be an explosion in the second week of December :) The chart is for tracking purposes. Open a position according to your own analysis. Good luck.

minno91
افت ناگهانی ZENUSDT: آیا آرامش بازار به پایان میرسد؟ (آماده معامله باشید)
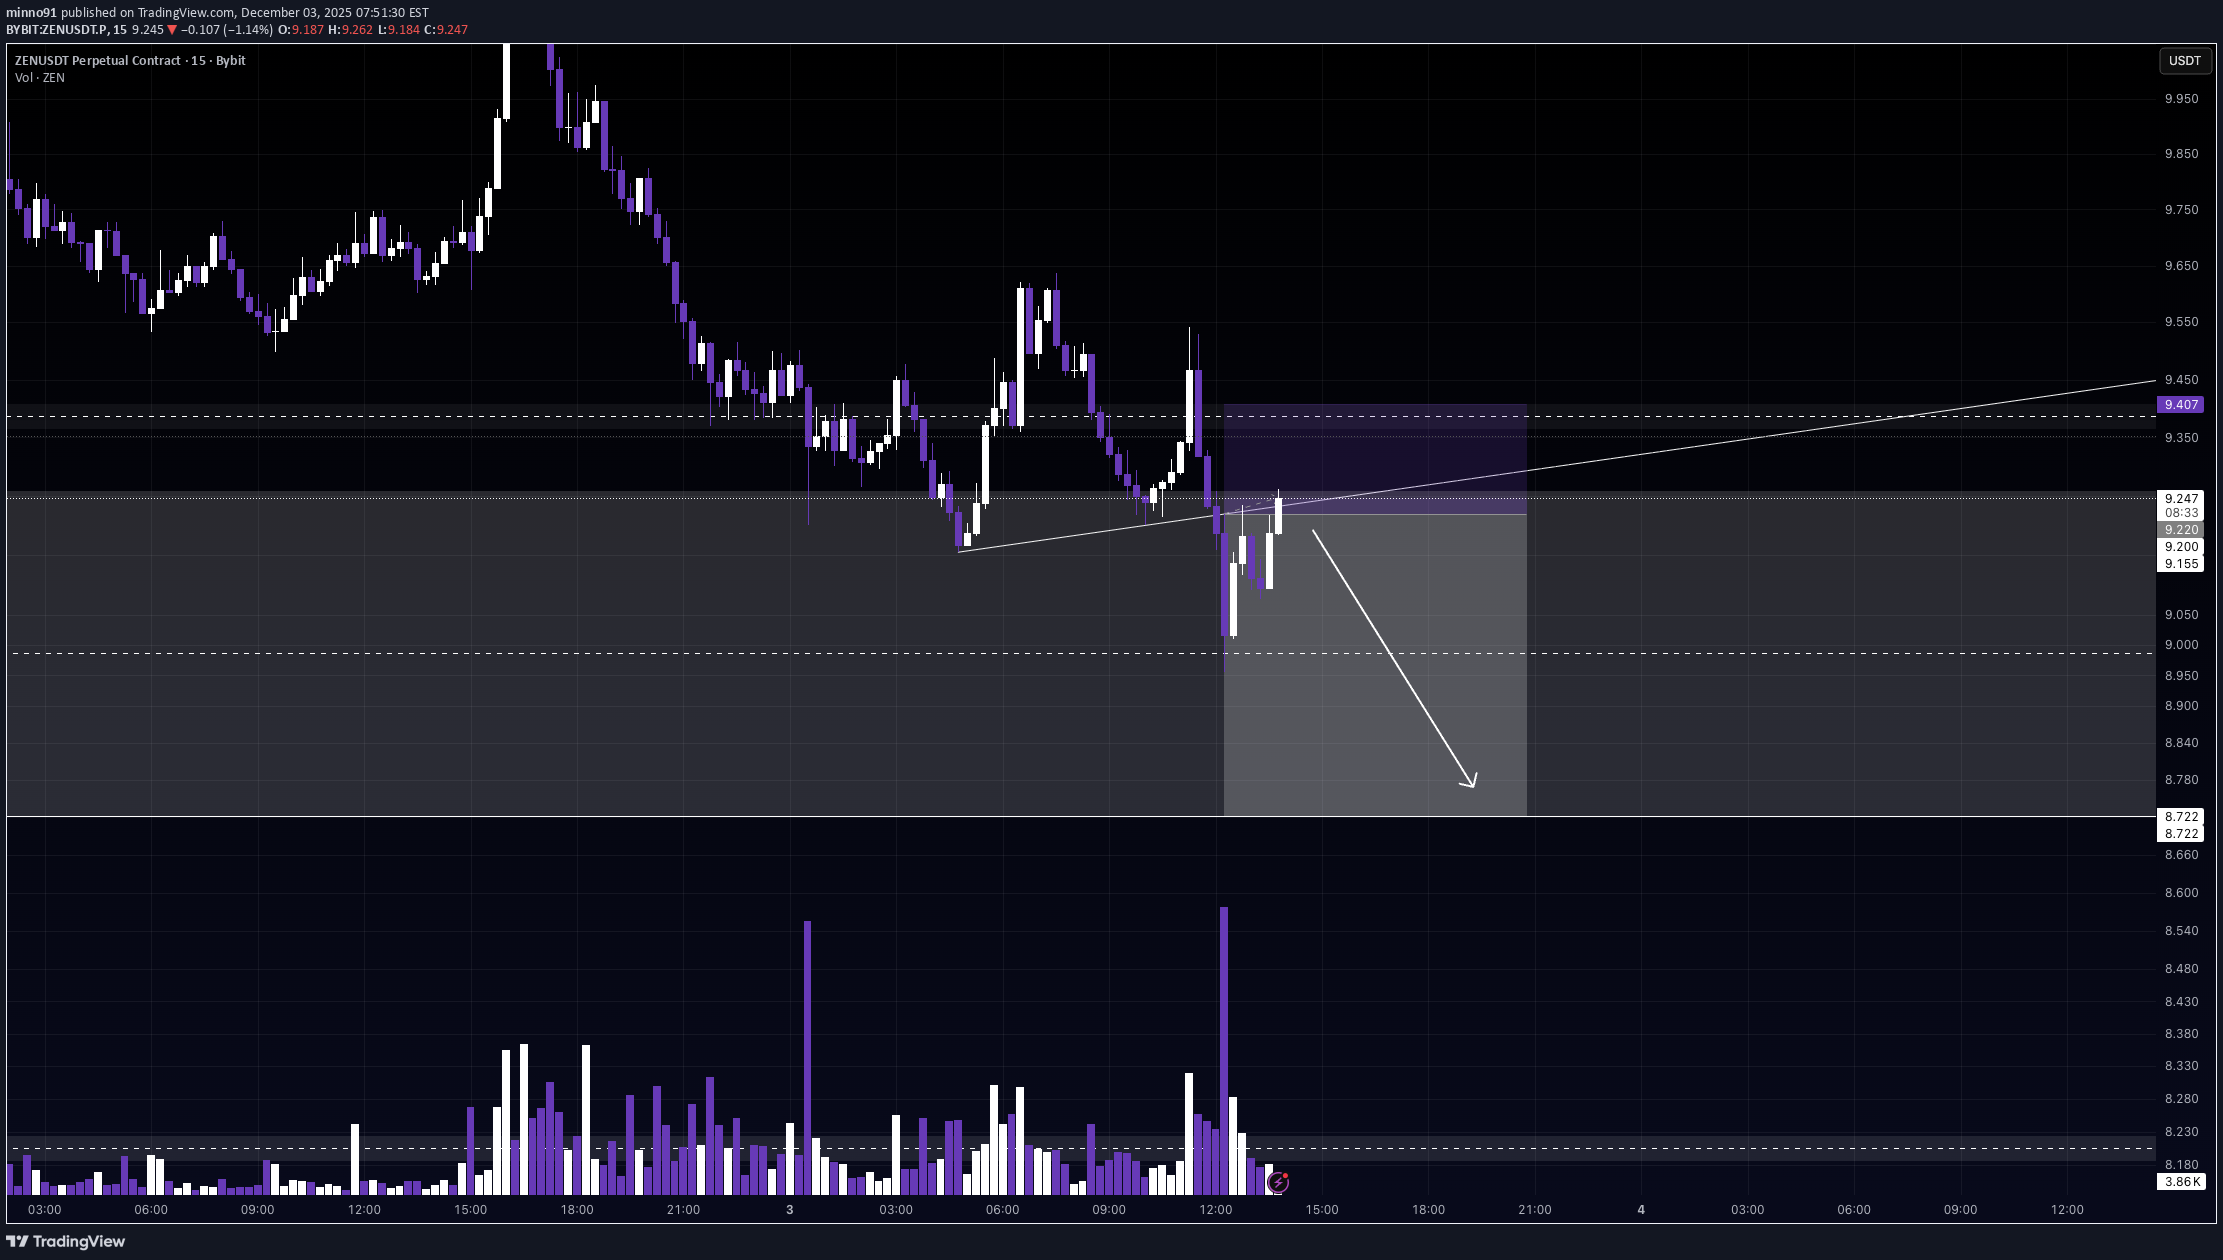
Alright traders, let’s enter our inner calm, because ZEN might be preparing a not-so-calm move down. 😅 Big picture? I still think the whole crypto market wants to go much higher in the coming days or weeks. The structure is improving, sentiment is shifting, everything looks ready for a broader pump… BUT. BTC had a pretty spicy pump yesterday, and as we all know: after every pump comes… confused sideways chop or a mini dip. (Yin and Yang, baby.) So I’m expecting a little relief pullback today or tomorrow — and that’s exactly the kind of move we can leverage in ZENUSDT.P. A small push lower, liquidity grab, maybe a wick that ruins someone’s morning — and that’s our opportunity. Nothing is guaranteed (because crypto is allergic to certainty), so be careful, stay calm, breathe deeply, and let ZEN guide you… probably… 😂 ⸻ ⚠️ Risk management ON No FOMO No YOLO Just peaceful, controlled trading like a true Zen master. Good luck traders — stay ZEN, even when the chart isn’t. 🧘♂️📉📈✨

CryptoAnalystSignal
#ZEN/USDT Long plan
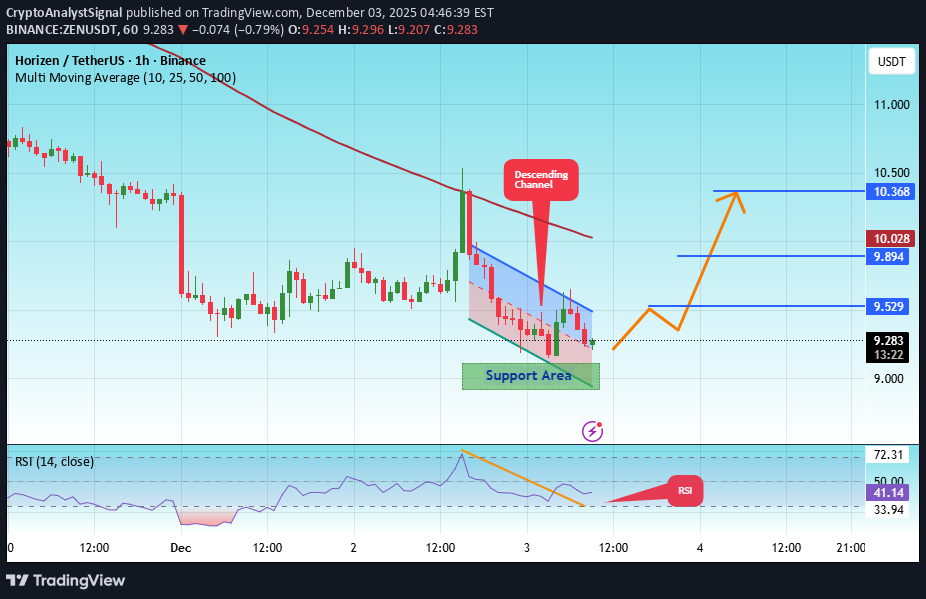
#ZEN The price is moving in a descending channel on the 1-hour timeframe. It has reached the lower boundary and is heading towards breaking above it, with a retest of the upper boundary expected. We have a downtrend on the RSI indicator, which has reached near the lower boundary, and an upward rebound is expected. There is a key support zone in green at the 296 price level. The price has bounced from this zone multiple times and is expected to bounce again. We have a trend towards stability above the 100-period moving average, as we are moving close to it, which supports the upward movement. Entry price: 9.27 First target: 9.52 Second target: 9.90 Third target: 10.36 Don't forget a simple principle: money management. Place your stop-loss below the support zone in green. For any questions, please leave a comment. Thank you.#ZEN First target: 9.52 Reached Second target: 9.90 Reached
هورایزن (ZEN): زمان بازگشت فرا رسید!
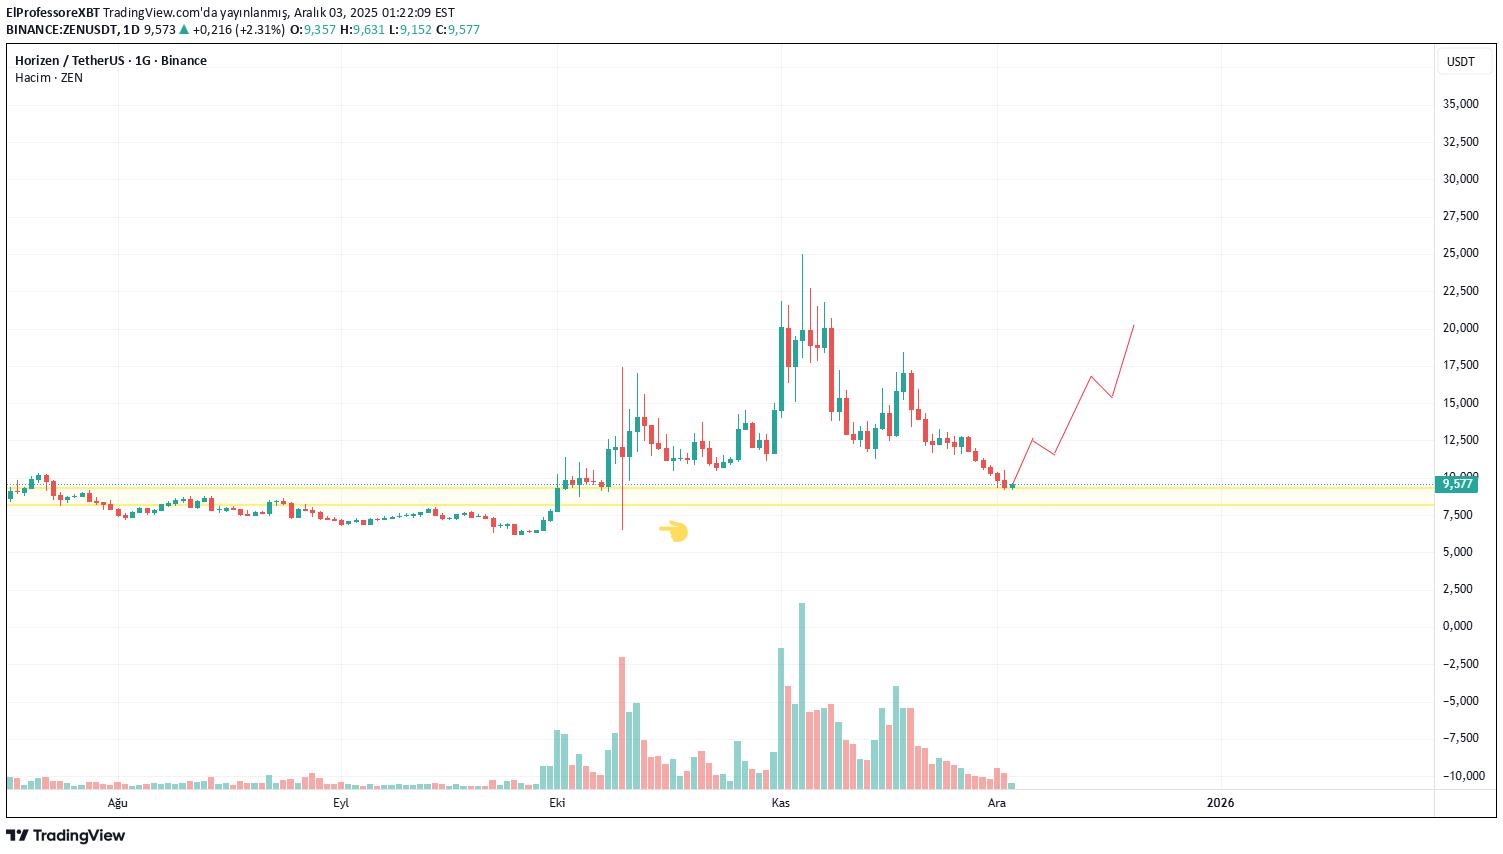
I expect something like this for HORIZEN. Time for sending it back...
Disclaimer
Any content and materials included in Sahmeto's website and official communication channels are a compilation of personal opinions and analyses and are not binding. They do not constitute any recommendation for buying, selling, entering or exiting the stock market and cryptocurrency market. Also, all news and analyses included in the website and channels are merely republished information from official and unofficial domestic and foreign sources, and it is obvious that users of the said content are responsible for following up and ensuring the authenticity and accuracy of the materials. Therefore, while disclaiming responsibility, it is declared that the responsibility for any decision-making, action, and potential profit and loss in the capital market and cryptocurrency market lies with the trader.