
Javlonbek4000
@t_Javlonbek4000

What symbols does the trader recommend buying?
Purchase History
پیام های تریدر
Filter
Javlonbek4000
BTCUSDT SHORT
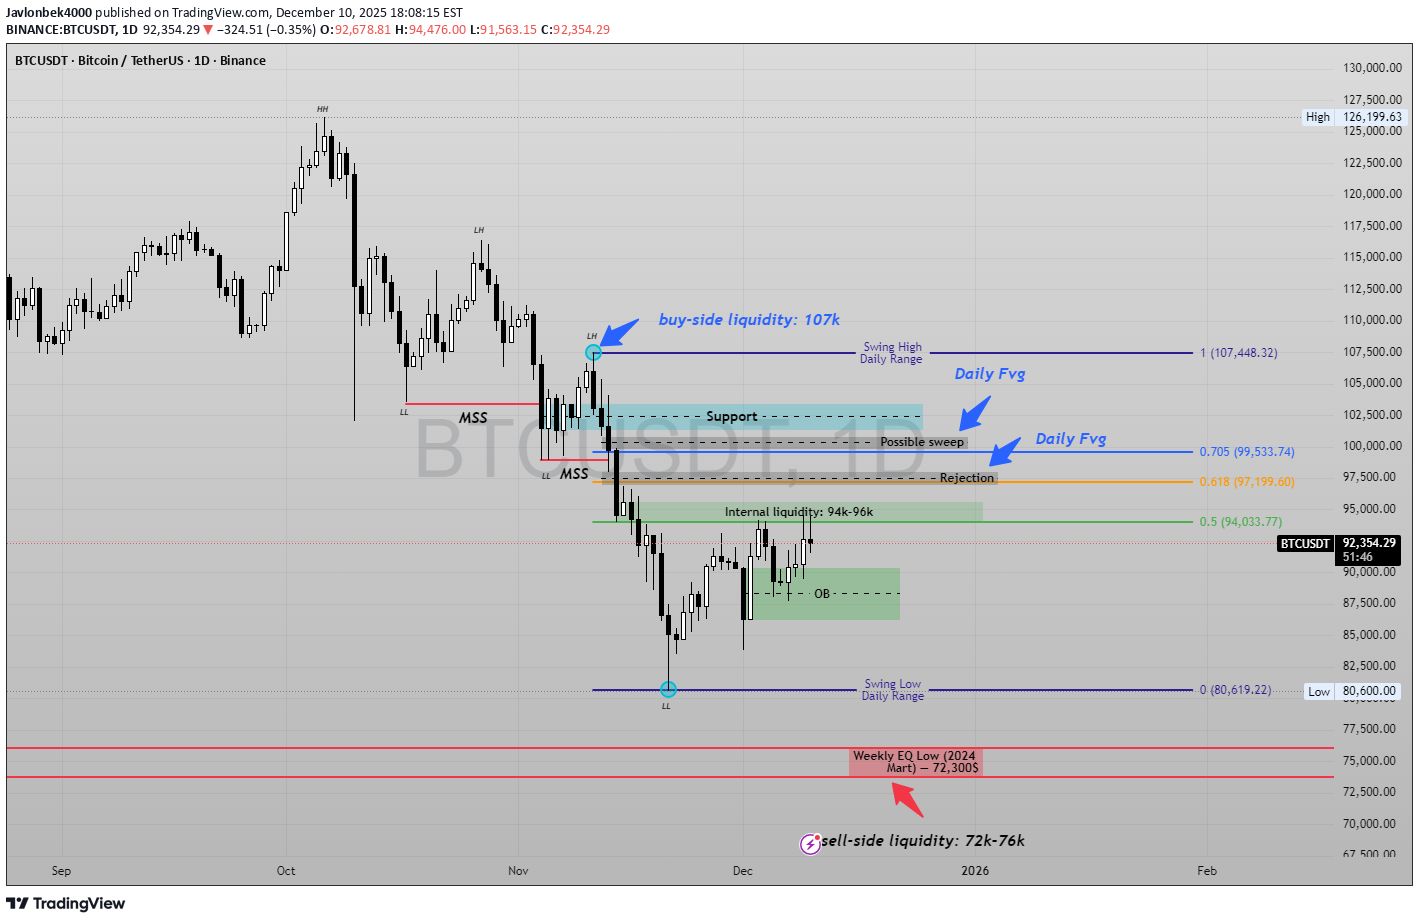
📌 BTCUSD — Institutional Daily Analysis (MPI + ICT Framework) (Professional Smart Money Market Breakdown) 1️⃣ Higher Timeframe Context Bitcoin is currently trading inside a bearish dealing range: Range High: 107,448 (Buy-side liquidity) Range Low: 80,600 (Sell-side liquidity) Within this range, price is in a retracement phase, not a reversal. 2️⃣ Market Structure (HH → LH → LL → MSS) The structure confirms a bearish environment: HH → LH → LL = bearish sequence Liquidity sweep below Internal swing high taken → MSS (Market Structure Shift) This MSS indicates the start of retracement — not a trend reversal. 3️⃣ Internal Liquidity (94k–96k) Price cleaned internal liquidity inside the 94k–96k range and confirmed the internal dealing model (IDM). This created the engine for a move into premium. 4️⃣ Premium Retracement Targets (FVG + OTE) Institutional order flow suggests price will seek higher inefficiencies: 0.618 retracement: 97,190 0.705 OTE (Institutional Entry): 99,533 Daily FVG #1: 98k–100k Daily FVG #2: 101k–103k Possible sweep zone: ~100k These are liquidity magnets before any major reversal. 5️⃣ Rejection Zone — Institutional Selling Area A high-probability sell setup sits in the premium zone: Daily FVG 0.705 OTE Old support → new resistance Breaker + inefficiency cluster This area is the most likely region for a bearish rejection. 6️⃣ Higher Timeframe Draw-on-Liquidity Once rejection occurs, institutional flow favors lower targets: TP1: 80,600 (Range Low) TP2: 76,000 (HTF imbalance) TP3: 72,300 (Weekly EQ Low – March 2024) Sell-side liquidity zone: 72k–76k This zone is the long-term liquidity objective. 7️⃣ Summary 📉 Trend remains bearish 📈 Current move = retracement into premium, not reversal 🎯 Premium zone (98k–103k) = institutional sell area 🔥 Long-term targets: 72k–76k sell-side liquidity This structure follows the classic ICT + MPI roadmap: Sweep → MSS → Retracement → Premium → Rejection → Expansion Lower
Javlonbek4000
خرید احتمالی ZEN/USDT: سیگنال صعودی قوی از منطقه تقاضای روزانه!
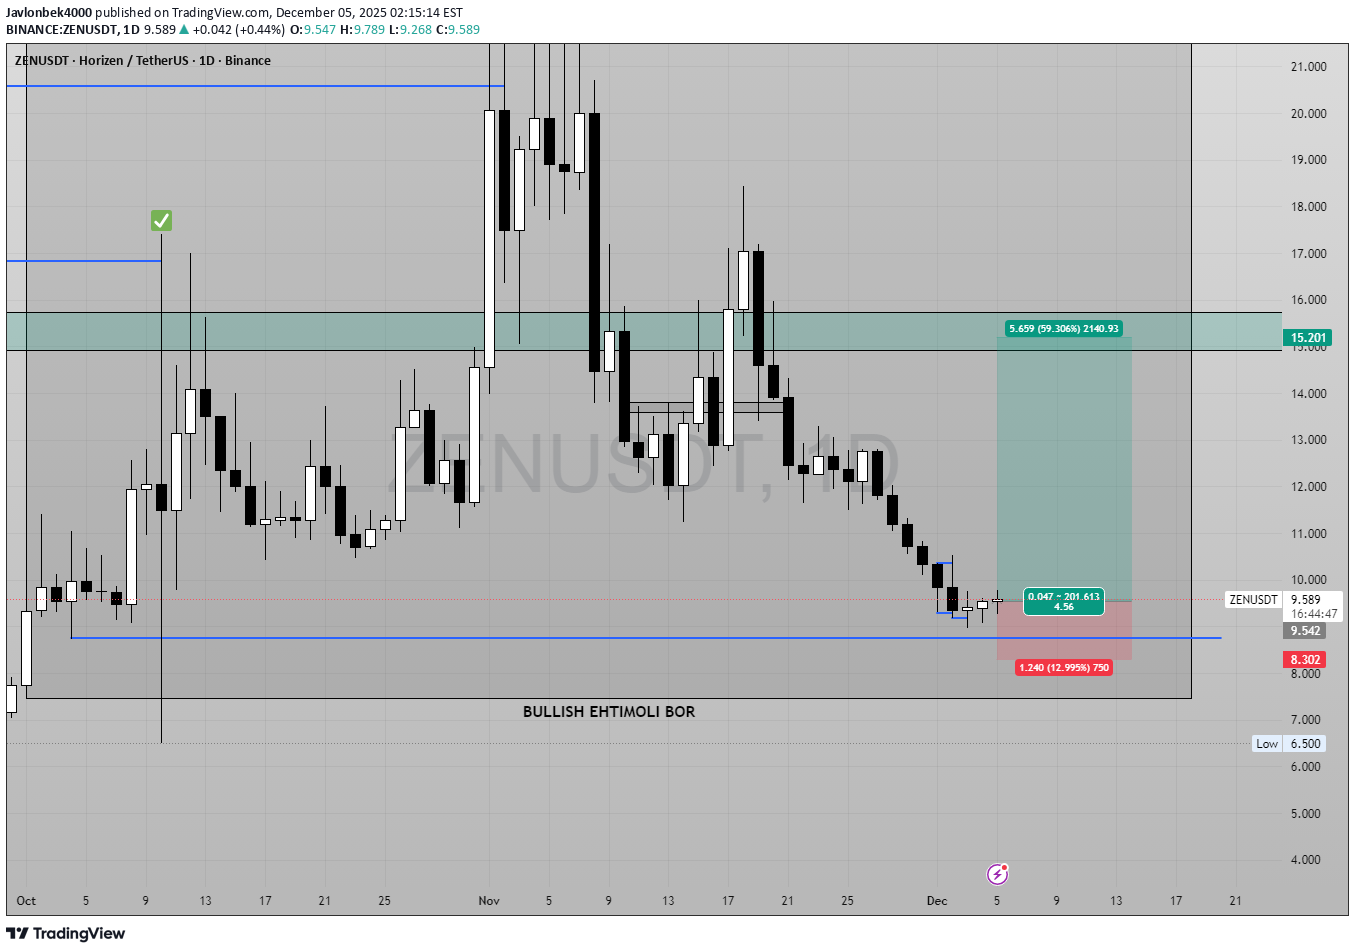
📈 ZEN/USDT – Daily Timeframe | Long Setup Explained 🟦 Market Context ZEN has reached a higher-timeframe demand zone after a prolonged correction. Daily bearish momentum is slowing down, and price is forming a potential reversal structure with consecutive equal-style lows and a rejection wick. 🔥 Why I’m Looking for a BUY Entry 1️⃣ HTF Demand Zone Price has tapped into a strong daily demand area that previously initiated a 60% impulse move. This increases the probability of a bullish reaction. 2️⃣ Liquidity Sweep The recent candle swept the previous swing low, collecting liquidity and forming a potential reversal point. 3️⃣ Bullish Reaction Candle The market printed a small bullish confirmation candle after the sweep, signaling buyer interest and absorption of selling pressure. 4️⃣ Favorable R:R Setup Defined invalidation level (SL) allows a clean long setup with a high reward potential toward untouched imbalance & supply zones above. 🎯 Target Levels TP1 — $12.00 First target at the midpoint of inefficiency + previous minor structure. Secure partial profits. TP2 — $15.20 Major daily supply zone. This is the main target where the previous drop originated. TP3 — $18.40 Extended target – the top of the macro range and the last unmitigated supply above. Price may reach this level if momentum continues. 📌 Trade Plan Summary Entry: Around $9.50 Stop-Loss: Below $8.95 TP1: $12.00 TP2: $15.20 TP3: $18.40 R:R Potential: ~6:1 to 9:1 depending on target ⚠️ Note This is not financial advice — the setup is based on HTF structure, liquidity behavior, and demand/supply dynamics.
Javlonbek4000
پیشبینی انفجار قیمت XVGUSDT: استراتژی نوسانگیری با اهداف صعودی بزرگ
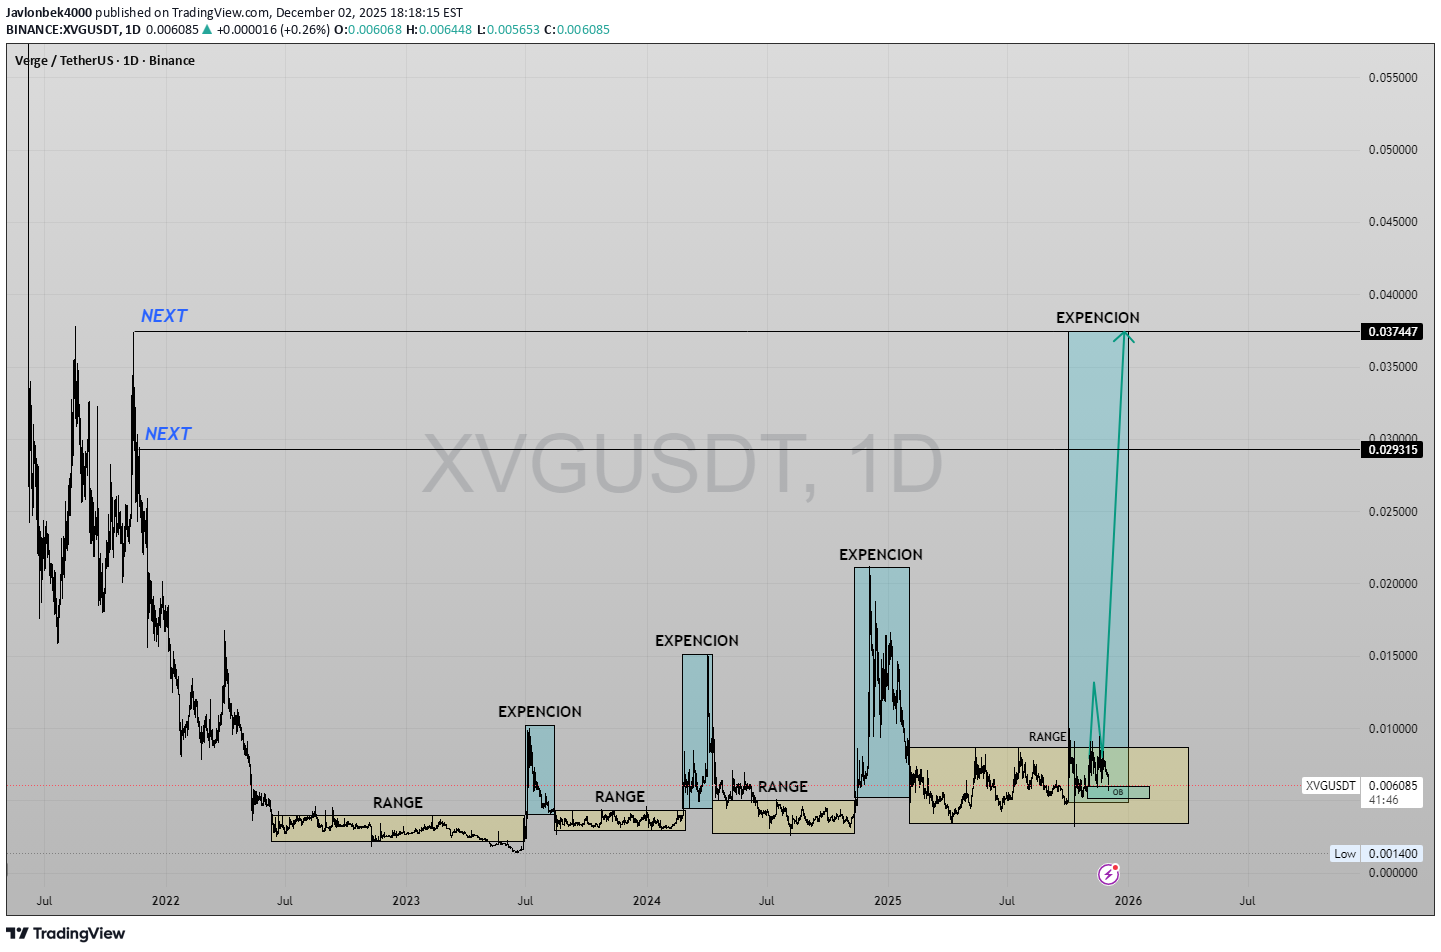
XVGUSDT – 1D | Range → Expansion Cycle, Swing Plan with Targets XVG has been respecting a very clear “range → expansion” behaviour on the daily chart. Each time price spends a long period inside a horizontal range, it is followed by a sharp vertical expansion leg. The previous cycles are marked on the chart, and the current structure is again trading inside a similar range. As long as price holds above the current range low, my bias is for one more expansion from this base. Swing idea from the current range Entry zone: around 0.0061 – inside the range and above the local demand/OB. Invalidation (SL): below 0.0047 – a clean daily break under this level means the range support has failed and the idea is invalid. Risk from entry ≈ -22%. First target (TP1): 0.0087 – retest of the range high / first liquidity pocket. Reward from entry ≈ +40%, giving roughly 1 : 1.8 R:R. If the market repeats previous “range → expansion” cycles and macro conditions stay supportive, I am looking at the following higher-timeframe expansion targets: TP2 – “NEXT” level: 0.0293 – major HTF supply zone from the last impulsive sell-off and a logical area to secure large profits if an expansion starts. TP3 – final extension: 0.0374 – upper resistance and full measured-move objective for a complete range expansion. These levels are scenario targets, not guarantees. I will reassess the structure at each target and adjust risk accordingly. This is a personal trading plan, shared for educational purposes only and not financial advice.
Javlonbek4000
تحلیل تکنیکال TURBOUSDT: سیگنال صعودی قدرتمند با پتانسیل سود ۴۰ درصدی!
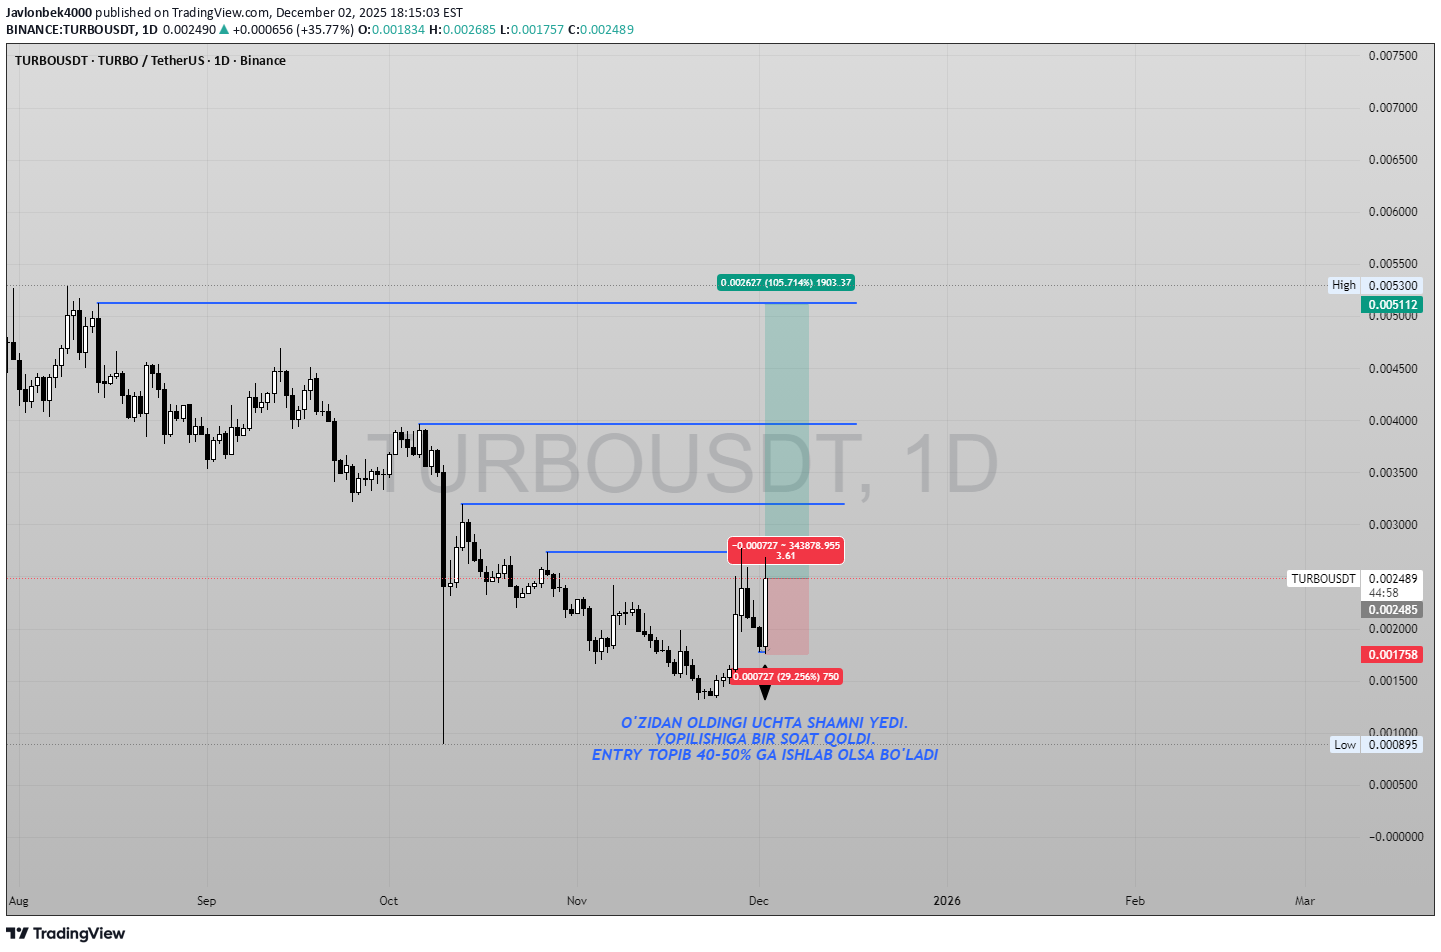
TURBOUSDT – Daily Bullish Engulfing Setup Today’s daily candle on TURBOUSDT is showing strong bullish momentum: it has engulfed the previous three candles, which indicates aggressive buying after a short-term pullback. There is about one hour left until the daily close; if the candle closes near the current levels or higher, this pattern will confirm a potential bullish reversal on the 1D timeframe. My plan for this setup: I am watching this zone for a long entry if the daily close confirms the bullish engulfing structure. The invalidaton for this idea is a clean break below today’s low – if price closes or trades convincingly below that level, the setup is no longer valid. On a successful entry, I see room for a 40–50% upside move toward the next daily resistance levels, where I will look to secure partial profits and trail the remaining position. As always, this is not financial advice – just my personal trading plan based on price action and risk management.
Javlonbek4000
سیگنال انفجاری ZEN/USDT: آیا پولبک پنهان آماده صعود به ۲۰ دلار است؟
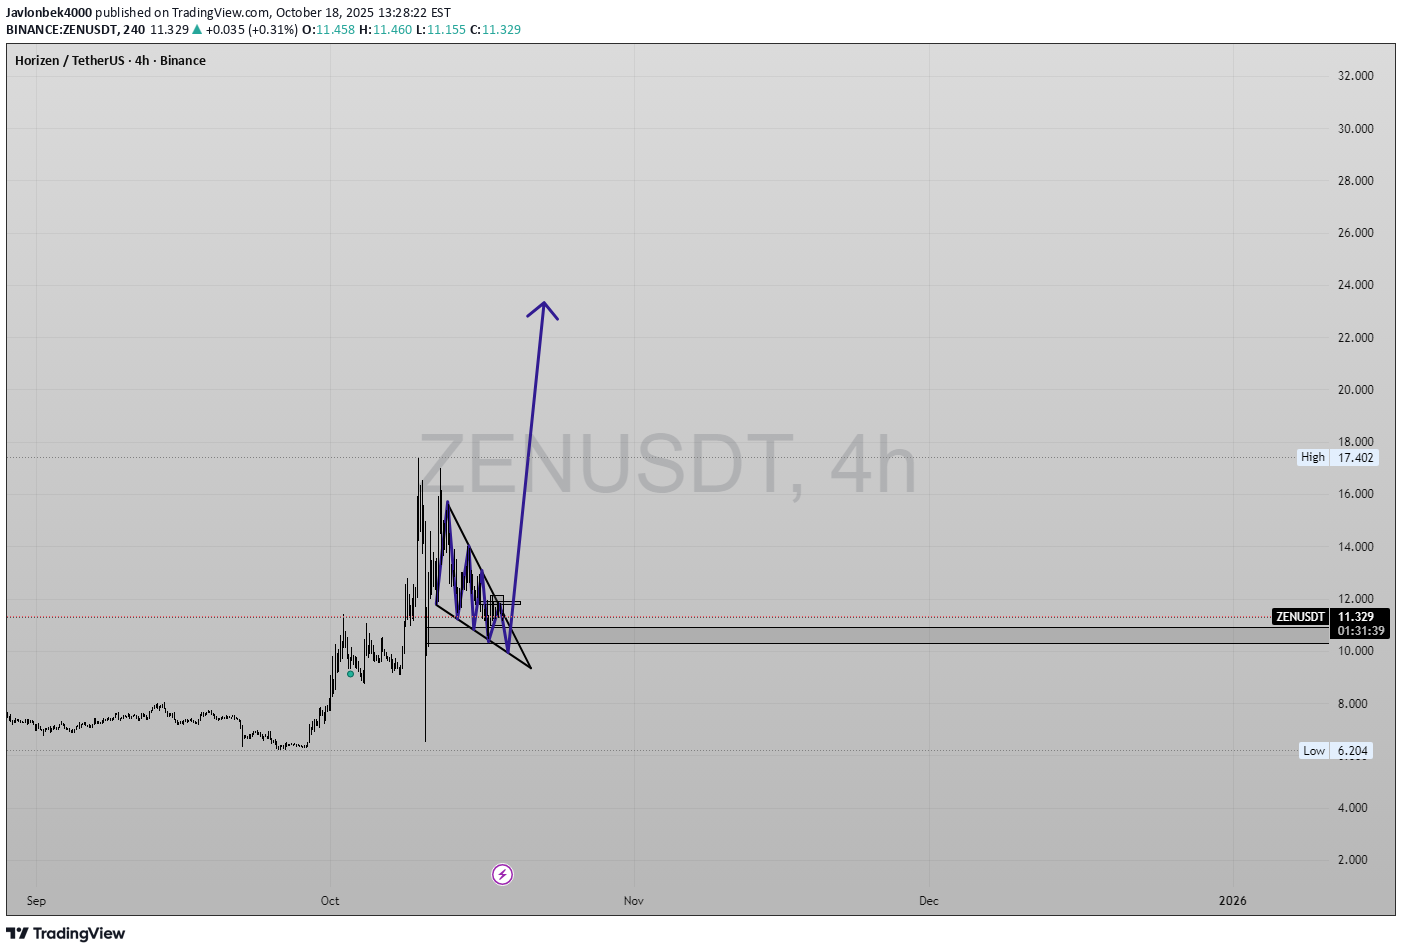
🧭 ZEN/USDT — Falling Wedge Breakout Setup ZEN/USDT is forming a descending wedge on the 4H chart after a strong impulse move. Price is consolidating near $11, showing potential for a bullish breakout if volume confirms. 1-Entry: $11.365 2-Entry: $10.46 – $10.60 Stop-Loss: $6.20 Take-Profit 1: $14.72 Take-Profit 2: $18.98 Take-Profit 3: $23.24 Trend bias remains bullish as long as $10.6 holds. A 4H close above $12.2–$12.8 would confirm structure shift and open targets up to $23. 📊 Risk/Reward ≈ 1:2.3 — solid swing setup.
Disclaimer
Any content and materials included in Sahmeto's website and official communication channels are a compilation of personal opinions and analyses and are not binding. They do not constitute any recommendation for buying, selling, entering or exiting the stock market and cryptocurrency market. Also, all news and analyses included in the website and channels are merely republished information from official and unofficial domestic and foreign sources, and it is obvious that users of the said content are responsible for following up and ensuring the authenticity and accuracy of the materials. Therefore, while disclaiming responsibility, it is declared that the responsibility for any decision-making, action, and potential profit and loss in the capital market and cryptocurrency market lies with the trader.