
YFI
yearn.finance
| تریدر | نوع سیگنال | حد سود/ضرر | زمان انتشار | مشاهده پیام |
|---|---|---|---|---|
No results found. | ||||
Price Chart of yearn.finance
سود 3 Months :
سیگنالهای yearn.finance
Filter
Sort messages by
Trader Type
Time Frame

iMoneyTeam
YFI Buy/Long Setup (4H)

Considering that we have a 3D at the bottom and the price has formed a bullish CH, on the pullback to the previous wave’s cheap zone, we can look for buy/long positions. We have two entry points enter these points using DCA. The targets are also marked on the chart. Do not enter the position without capital management and stop setting Comment if you have any questions thank youAfter hitting the entry zone, it pumped 6% and the price reached the first target

noam_chom
ییرن فایننس (YFI) در برابر زدکش (ZEC): آیا تب دیفای داغتر میشود؟
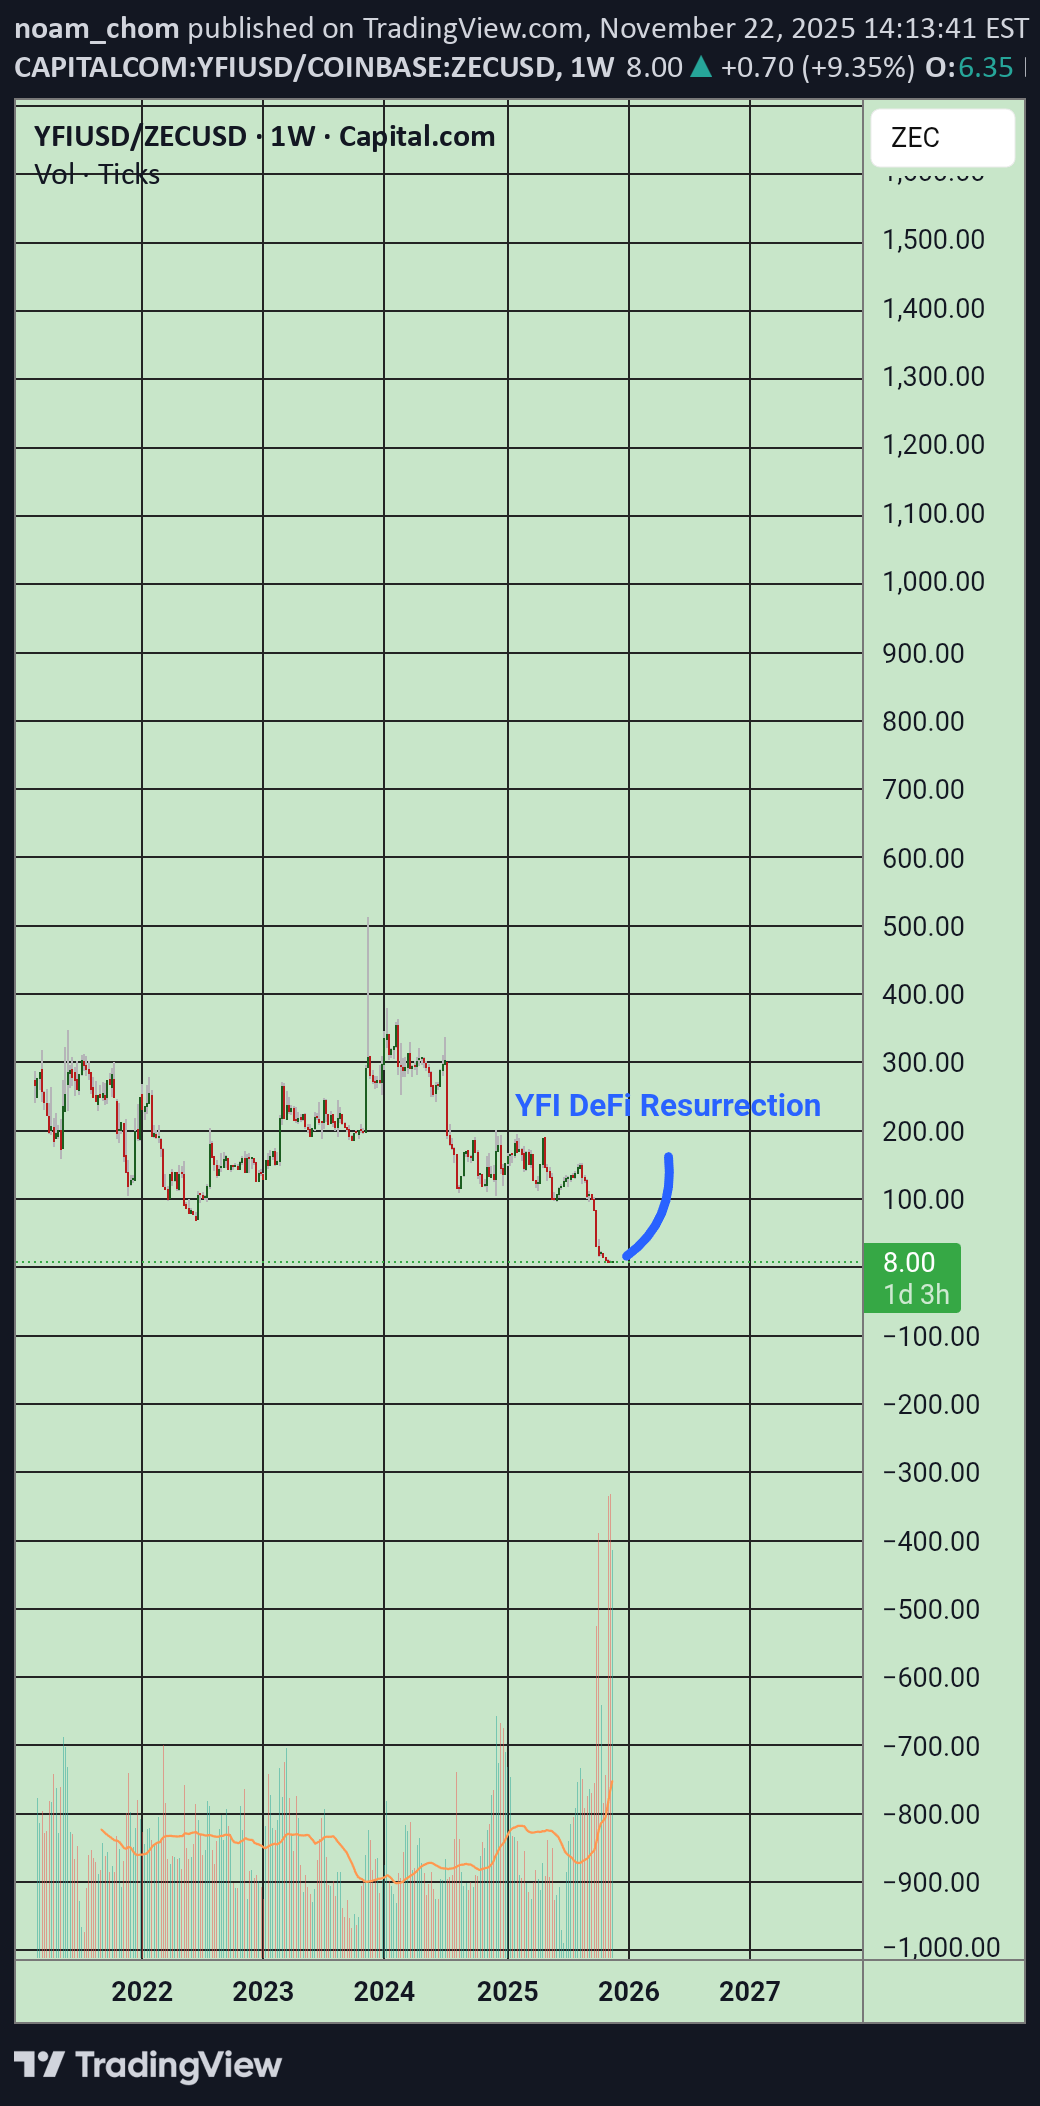
Privacy meta will cool, DeFi meta will heat up Yearn Finance is a Blue Chip

BeerdHead
هیولای بازدهی دیفای اتریوم: راز رالی بزرگ YFI از کف قیمتی!
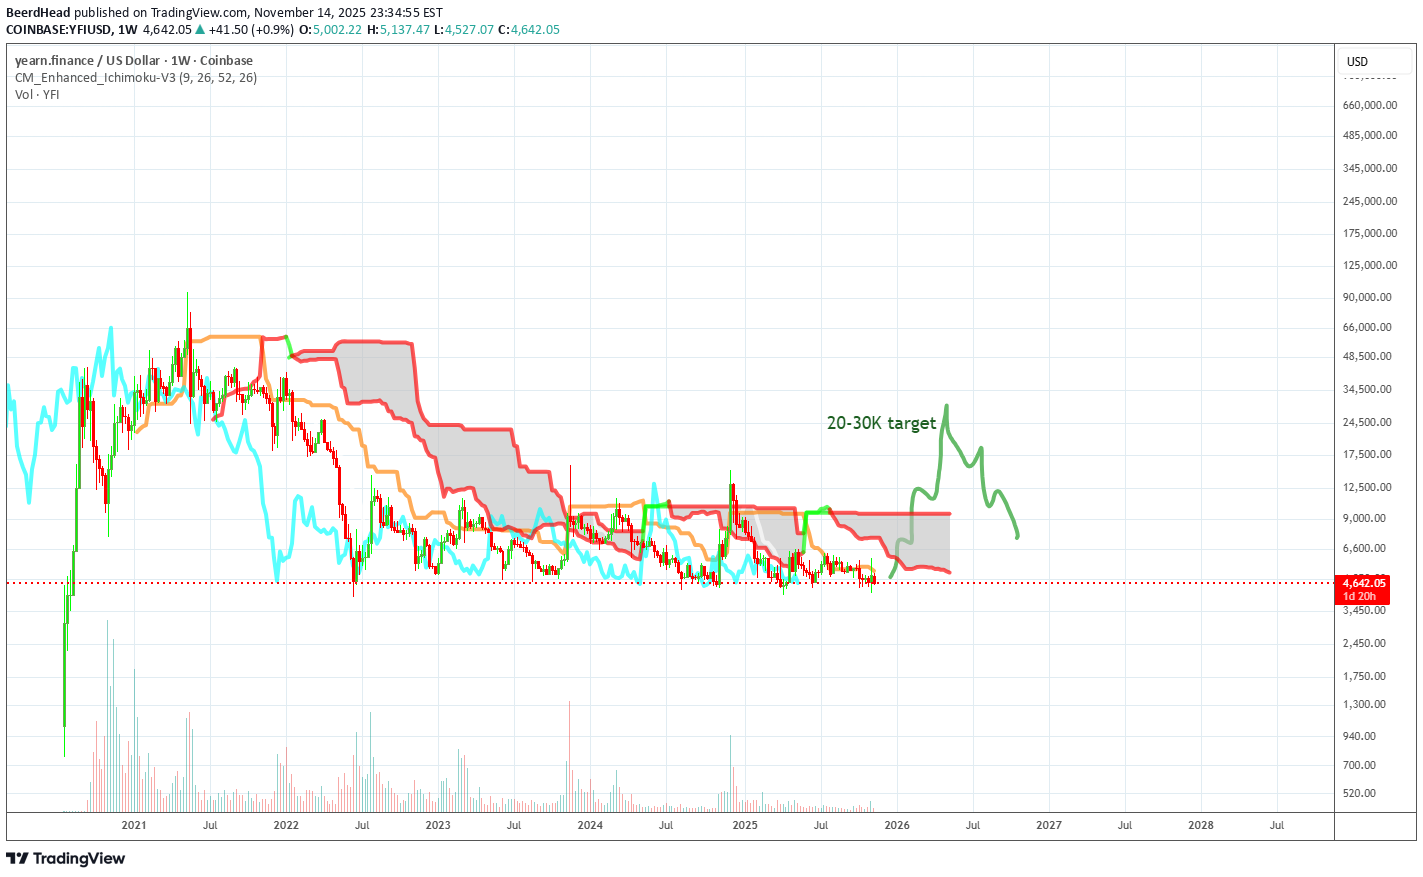
this one like many 2020 ETH DeFi blue chips can stage a huge rally off of these lows.
BeerdHead
ییلد فایننس (YFI): غول نهفته اتریوم؛ آیا زمان بازگشت فرارسیده است؟
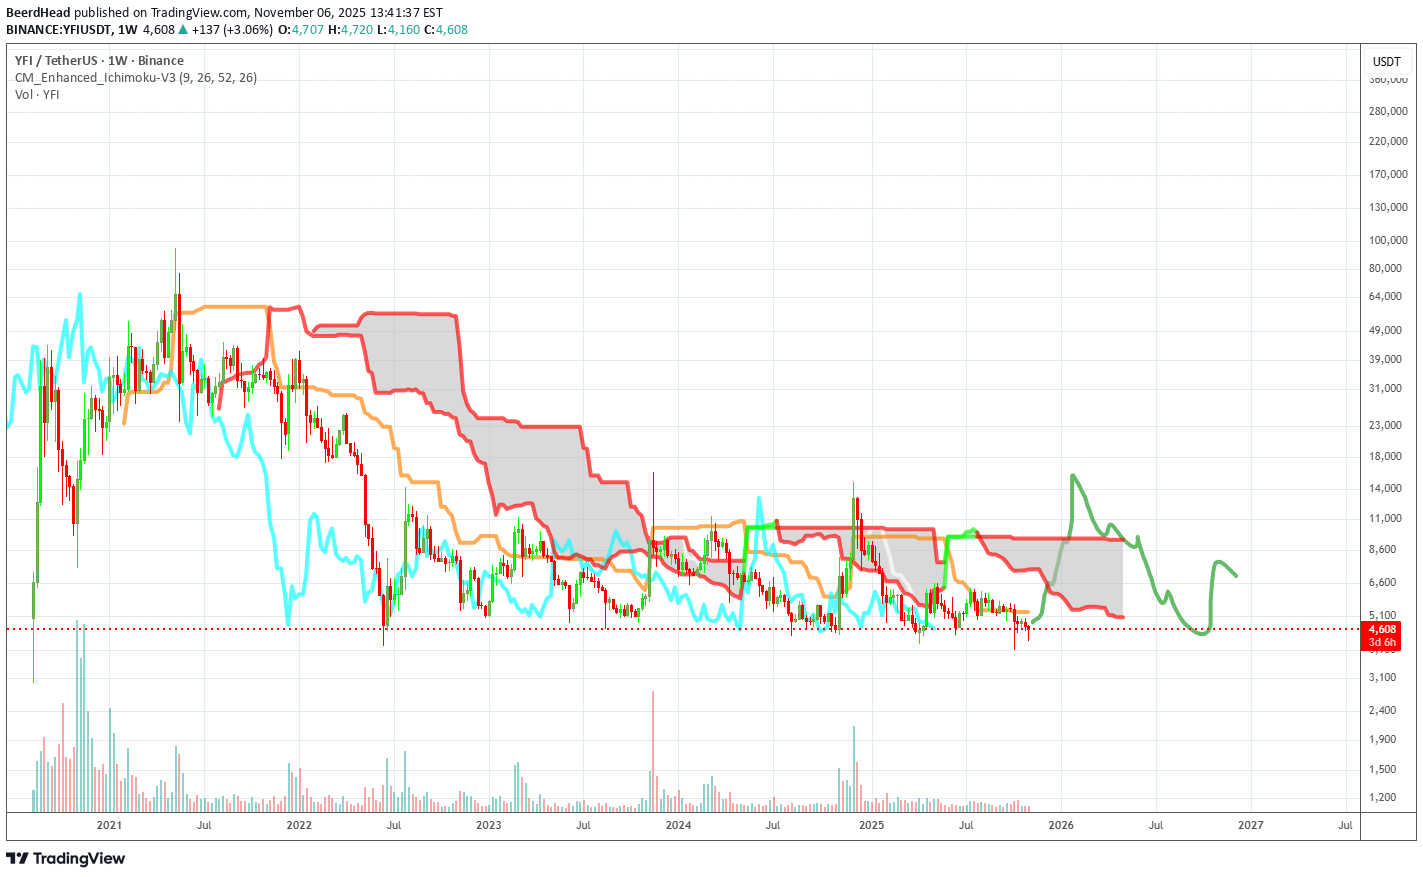
scarce token, TVL vs market cap looks good solid meme that many from 2021 will rememberyfistory.org/thebluepill

CryptoAnalystSignal
پیشبینی انفجاری YFI/USDT: آماده شکستن کانال نزولی و جهش بزرگ!
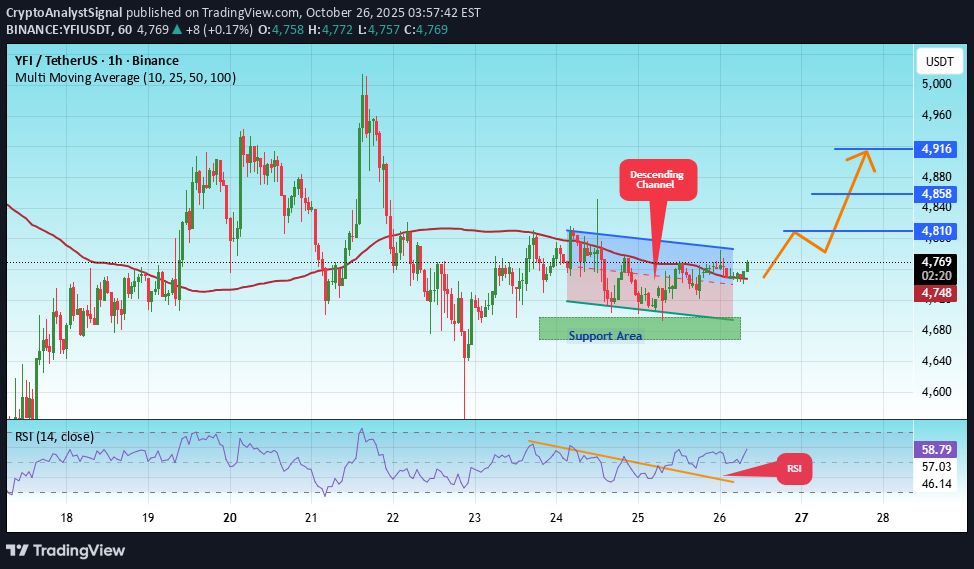
#YFI The price is moving within a descending channel on the 1-hour frame, adhering well to it, and is heading for a strong breakout and retest. We have a bearish trend on the RSI indicator that is about to be broken and retested, which supports the upward move. There is a major support area in green at 4680, which represents a strong support point. We are heading for consolidation above the 100 moving average. Entry price: 4768 First target: 4810 Second target: 4858 Third target: 4916 Don't forget a simple matter: capital management. When you reach the first target, save some money and then change your stop-loss order to an entry order. For inquiries, please leave a comment. Thank you.#YFI First target: 4810 Reached Second target: 4858 Reached Third target: 4916 Reached

AloneTrader_
تحلیل تکنیکال YFIUSDT.P: فرصت خرید یا مقاومت پیش رو؟
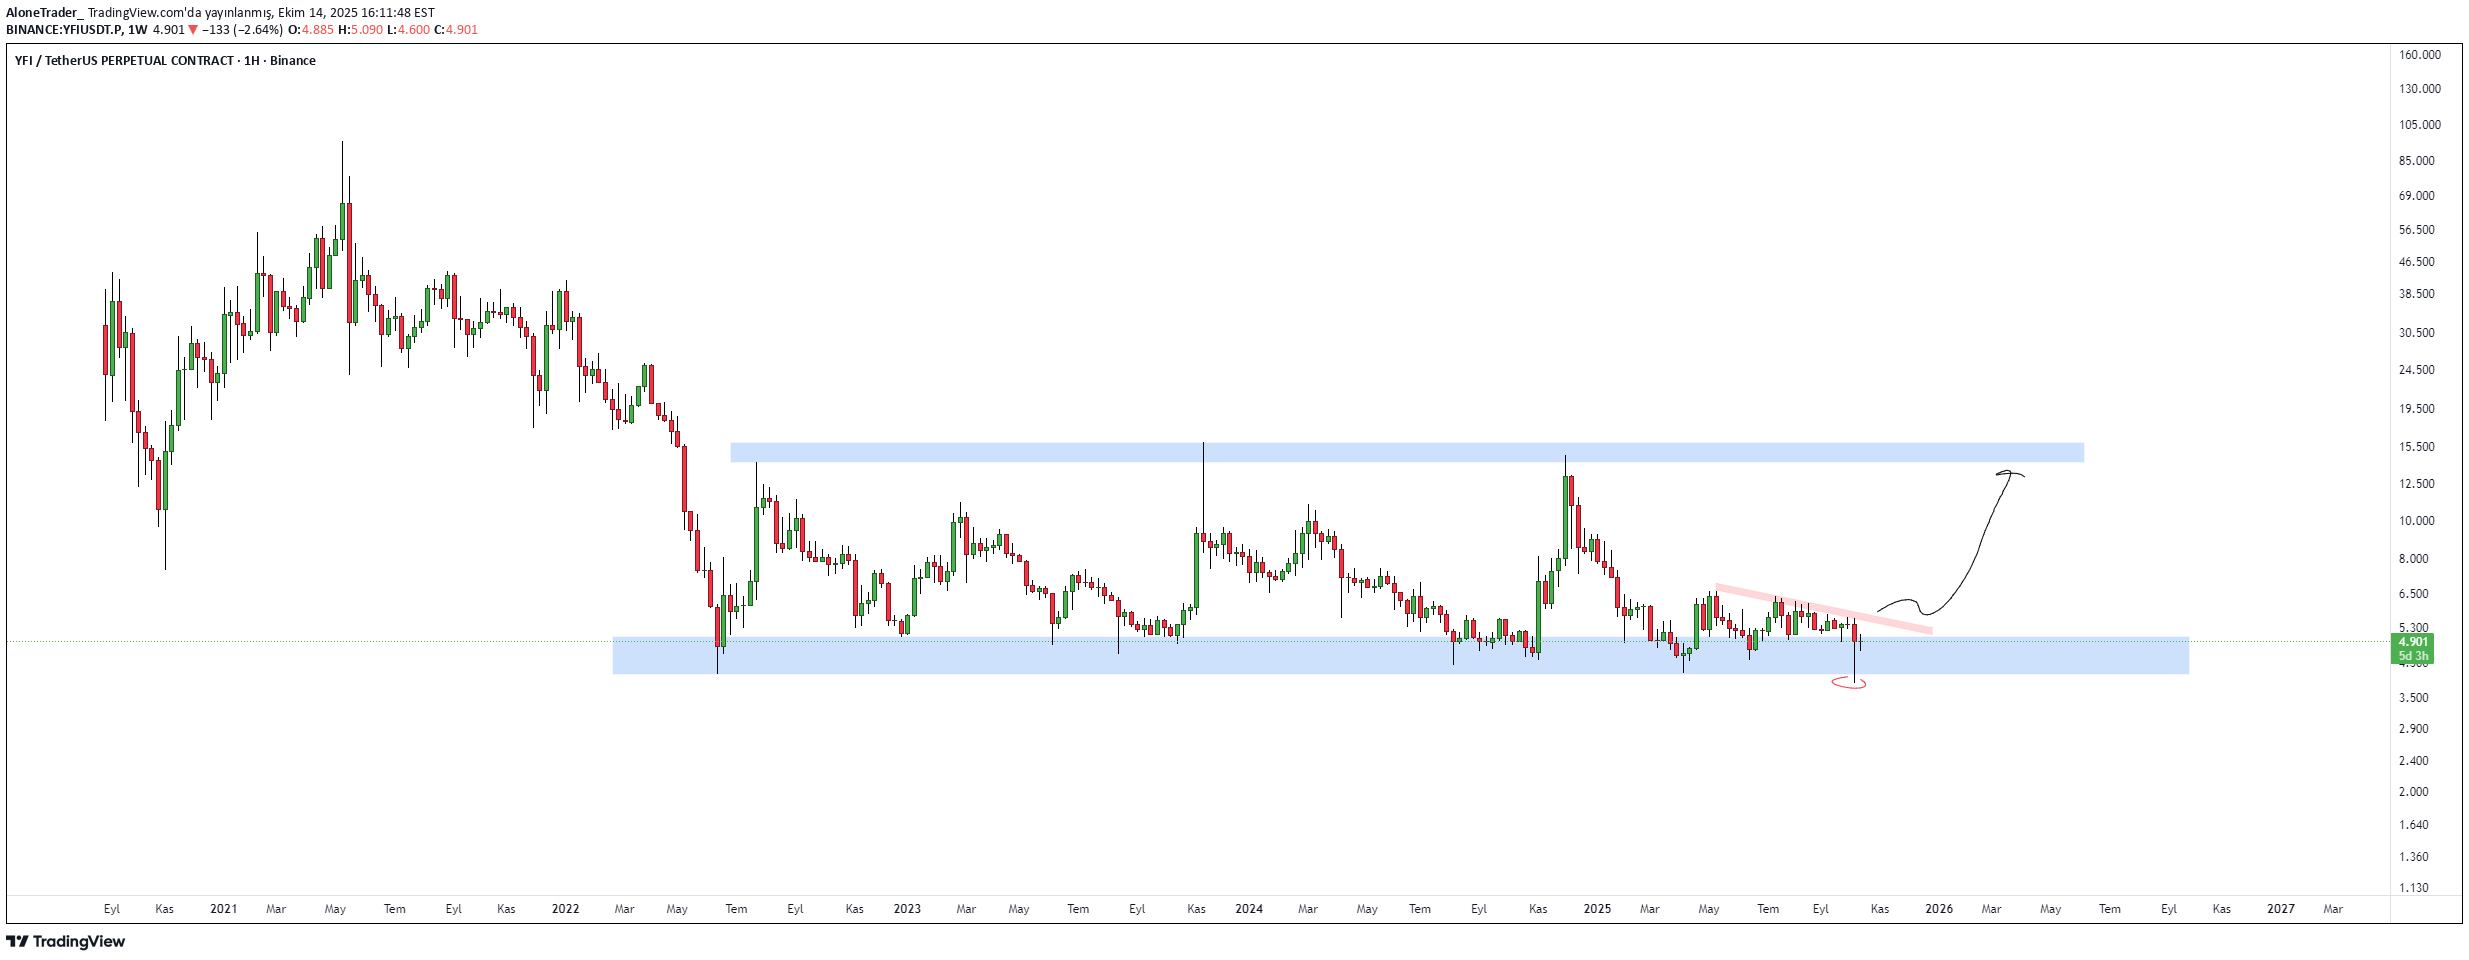
I see it holding a long support and I think it has margin to resistance above.

BandForBands


Worldofchartsfx
yfi looking very good

Getting Ready For Massive Rally, Yfi Need To Clear This Range, After That It Can Easily Give 2x, Closing Below This Trendline + Horizontal Area Would Invalidate This Setup, It Can Be A Good Risk Reward Entry

CryptoNuclear
YFI/USDT — Multi-Year Demand Zone: Rebound or Breakdown?
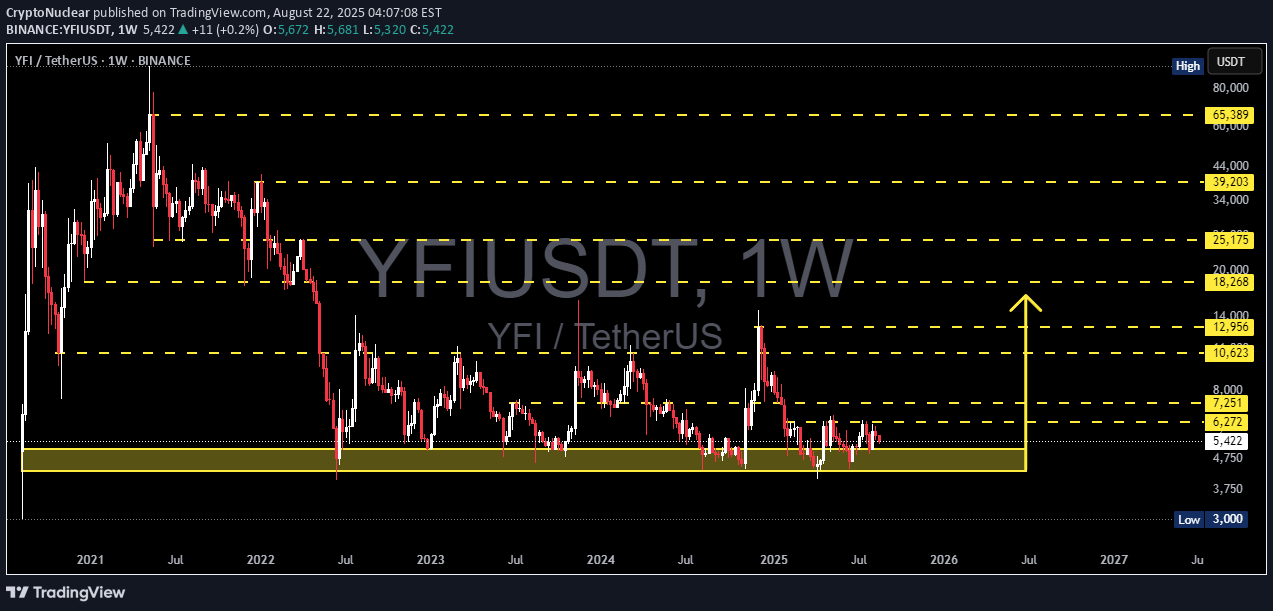
🔎 Full Analysis On the weekly timeframe, YFI/USDT is trading right above a multi-year demand zone around $3,800 – $4,750 (yellow box). This area has repeatedly acted as a strong support since 2022, where buyers step in to prevent deeper declines. After a sharp drop from its 2021 peak, price action has formed a long-term base/accumulation structure, suggesting that while selling pressure has slowed down, there’s still no strong bullish momentum to drive a sustainable uptrend. Looking upward, we can identify historical resistance levels as key barriers and potential targets if price breaks higher: $6,272 → short-term resistance $7,251 → major resistance (bullish confirmation if broken) $10,623 → $12,956 → $18,268 → $25,175 → mid-to-long term targets $65,389 → ultimate historical high, only realistic in a strong macro bull cycle --- 🐂 Bullish Scenario 1. Rebound from demand → As long as weekly closes remain above $4,750, buyers can attempt to defend this zone. 2. First breakout trigger → A weekly close above $6,272 opens the door toward $7,251. 3. Momentum continuation → Breaking $7,251 with volume may confirm a shift back into a bullish cycle, targeting $10,623 – $12,956 – $18,268. 💡 Strategy: Swing traders may accumulate within the demand zone with tight stops below $3,800. Conservative traders may wait for a breakout above $6,272/$7,251 before entering. --- 🐻 Bearish Scenario 1. Breakdown of demand zone → A weekly close below $3,800 – $4,750 would invalidate multi-year support. 2. Downside targets → The next major support sits near $3,000, with further downside possible if selling accelerates. 3. False breakout risk → A rally toward $7k–$10k followed by a sharp rejection could send price back into the demand zone, increasing the chance of a breakdown. 💡 Strategy: If breakdown occurs, short setups or waiting for entries at lower supports may provide better risk/reward. --- 📐 Pattern Structure Accumulation Base / Long-Term Range → price consolidating for multiple years above a key demand zone. Range-Bound Market → current trading range remains between $3,800 – $7,251. Decision Point → the longer the consolidation, the more powerful the breakout will likely be. --- 🔑 Key Takeaways YFI is at a critical decision point: hold above demand or break down to new lows. Bullish Case: breakout above $6,272 → confirmation at $7,251 → potential rally to $10k – $12k+. Bearish Case: breakdown below $3,800 – $4,750 → likely move to $3,000 or lower. The yellow zone = the battleground that will define YFI’s multi-month trend. --- 📝 Important Note This analysis is based on price action & historical levels. Always combine with indicators (RSI, MACD, volume) and keep an eye on market sentiment (BTC dominance, macro conditions). This is not financial advice — do your own research before making trading decisions. #YFI #YFIUSDT #YearnFinance #Crypto #TechnicalAnalysis #SupportResistance #PriceAction #SwingTrading #Altcoin

andrewdresselhaus12345

Disclaimer
Any content and materials included in Sahmeto's website and official communication channels are a compilation of personal opinions and analyses and are not binding. They do not constitute any recommendation for buying, selling, entering or exiting the stock market and cryptocurrency market. Also, all news and analyses included in the website and channels are merely republished information from official and unofficial domestic and foreign sources, and it is obvious that users of the said content are responsible for following up and ensuring the authenticity and accuracy of the materials. Therefore, while disclaiming responsibility, it is declared that the responsibility for any decision-making, action, and potential profit and loss in the capital market and cryptocurrency market lies with the trader.