Technical analysis by CryptoNuclear about Symbol YFI: Buy recommendation (8/22/2025)

CryptoNuclear
YFI/USDT — Multi-Year Demand Zone: Rebound or Breakdown?
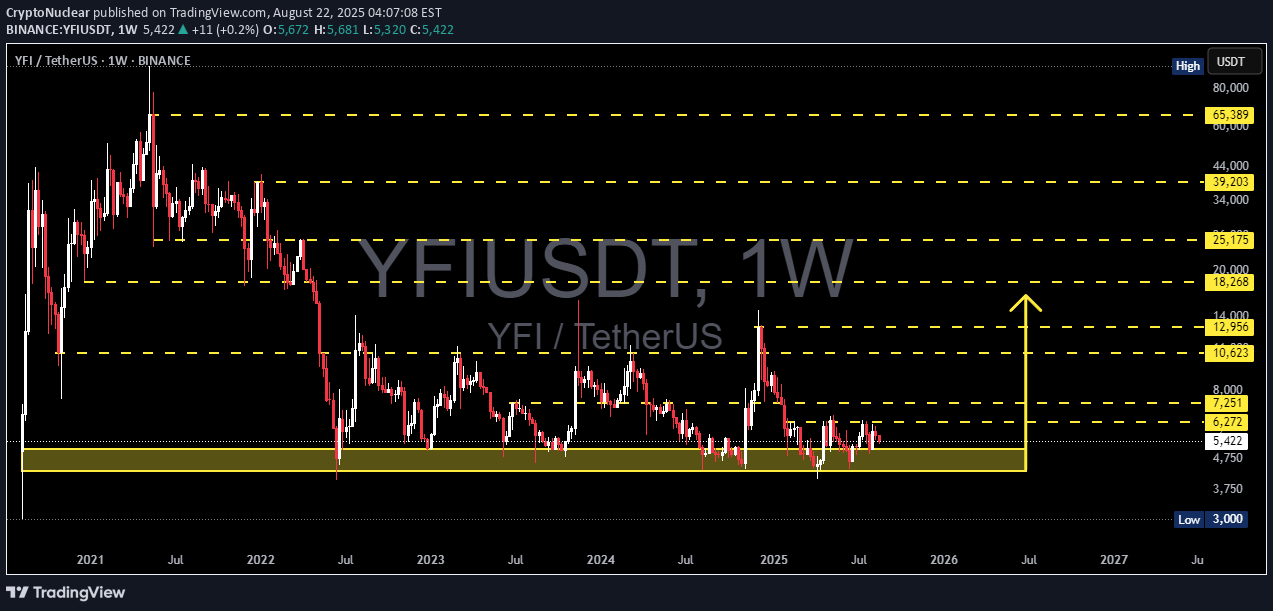
🔎 Full Analysis On the weekly timeframe, YFI/USDT is trading right above a multi-year demand zone around $3,800 – $4,750 (yellow box). This area has repeatedly acted as a strong support since 2022, where buyers step in to prevent deeper declines. After a sharp drop from its 2021 peak, price action has formed a long-term base/accumulation structure, suggesting that while selling pressure has slowed down, there’s still no strong bullish momentum to drive a sustainable uptrend. Looking upward, we can identify historical resistance levels as key barriers and potential targets if price breaks higher: $6,272 → short-term resistance $7,251 → major resistance (bullish confirmation if broken) $10,623 → $12,956 → $18,268 → $25,175 → mid-to-long term targets $65,389 → ultimate historical high, only realistic in a strong macro bull cycle --- 🐂 Bullish Scenario 1. Rebound from demand → As long as weekly closes remain above $4,750, buyers can attempt to defend this zone. 2. First breakout trigger → A weekly close above $6,272 opens the door toward $7,251. 3. Momentum continuation → Breaking $7,251 with volume may confirm a shift back into a bullish cycle, targeting $10,623 – $12,956 – $18,268. 💡 Strategy: Swing traders may accumulate within the demand zone with tight stops below $3,800. Conservative traders may wait for a breakout above $6,272/$7,251 before entering. --- 🐻 Bearish Scenario 1. Breakdown of demand zone → A weekly close below $3,800 – $4,750 would invalidate multi-year support. 2. Downside targets → The next major support sits near $3,000, with further downside possible if selling accelerates. 3. False breakout risk → A rally toward $7k–$10k followed by a sharp rejection could send price back into the demand zone, increasing the chance of a breakdown. 💡 Strategy: If breakdown occurs, short setups or waiting for entries at lower supports may provide better risk/reward. --- 📐 Pattern Structure Accumulation Base / Long-Term Range → price consolidating for multiple years above a key demand zone. Range-Bound Market → current trading range remains between $3,800 – $7,251. Decision Point → the longer the consolidation, the more powerful the breakout will likely be. --- 🔑 Key Takeaways YFI is at a critical decision point: hold above demand or break down to new lows. Bullish Case: breakout above $6,272 → confirmation at $7,251 → potential rally to $10k – $12k+. Bearish Case: breakdown below $3,800 – $4,750 → likely move to $3,000 or lower. The yellow zone = the battleground that will define YFI’s multi-month trend. --- 📝 Important Note This analysis is based on price action & historical levels. Always combine with indicators (RSI, MACD, volume) and keep an eye on market sentiment (BTC dominance, macro conditions). This is not financial advice — do your own research before making trading decisions. #YFI #YFIUSDT #YearnFinance #Crypto #TechnicalAnalysis #SupportResistance #PriceAction #SwingTrading #Altcoin