
XTZ
Tezos
| تریدر | نوع سیگنال | حد سود/ضرر | زمان انتشار | مشاهده پیام |
|---|---|---|---|---|
No results found. | ||||
Price Chart of Tezos
سود 3 Months :
سیگنالهای Tezos
Filter
Sort messages by
Trader Type
Time Frame

Bithereum_io
تحلیل تکنیکال تزوس (XTZ/USDT): انتظار برای جهش از کف حمایت یا سقوط بیشتر؟
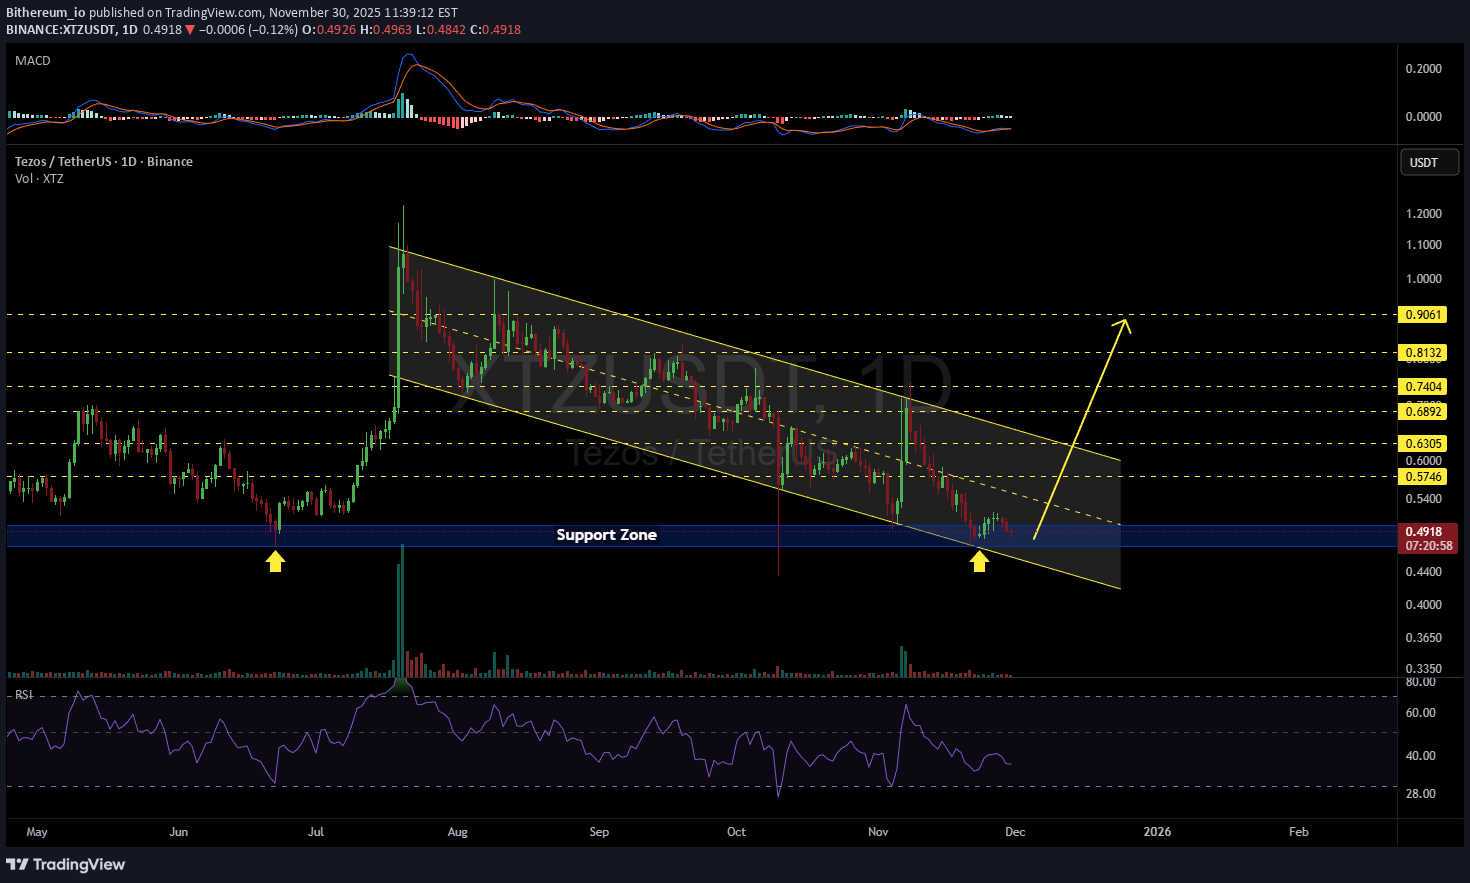
#XTZ is moving inside a descending channel on the daily timeframe and is currently sitting on the support zone. For the bullish scenario, it must bounce from this zone with strong volume. Do not enter here yet — volume is weak, and the RSI suggests there is still room for further downside. If a successful bounce occurs, we can look for the following short-term targets: 🎯 $0.5746 🎯 $0.6305 And if price breaks above the channel resistance, the next upside targets are: 🎯 $0.6892 🎯 $0.7404 🎯 $0.8132 🎯 $0.9061 ❌ Invalidation: a daily candle closing below the channel support. ⚠️ Always remember to use a tight stop-loss and maintain proper risk management.

MohamedSewid
XTZ: کلید نجات تاریخی در ۰.۳۱۷ دلار؛ آیا بازگشت بزرگ در راه است؟
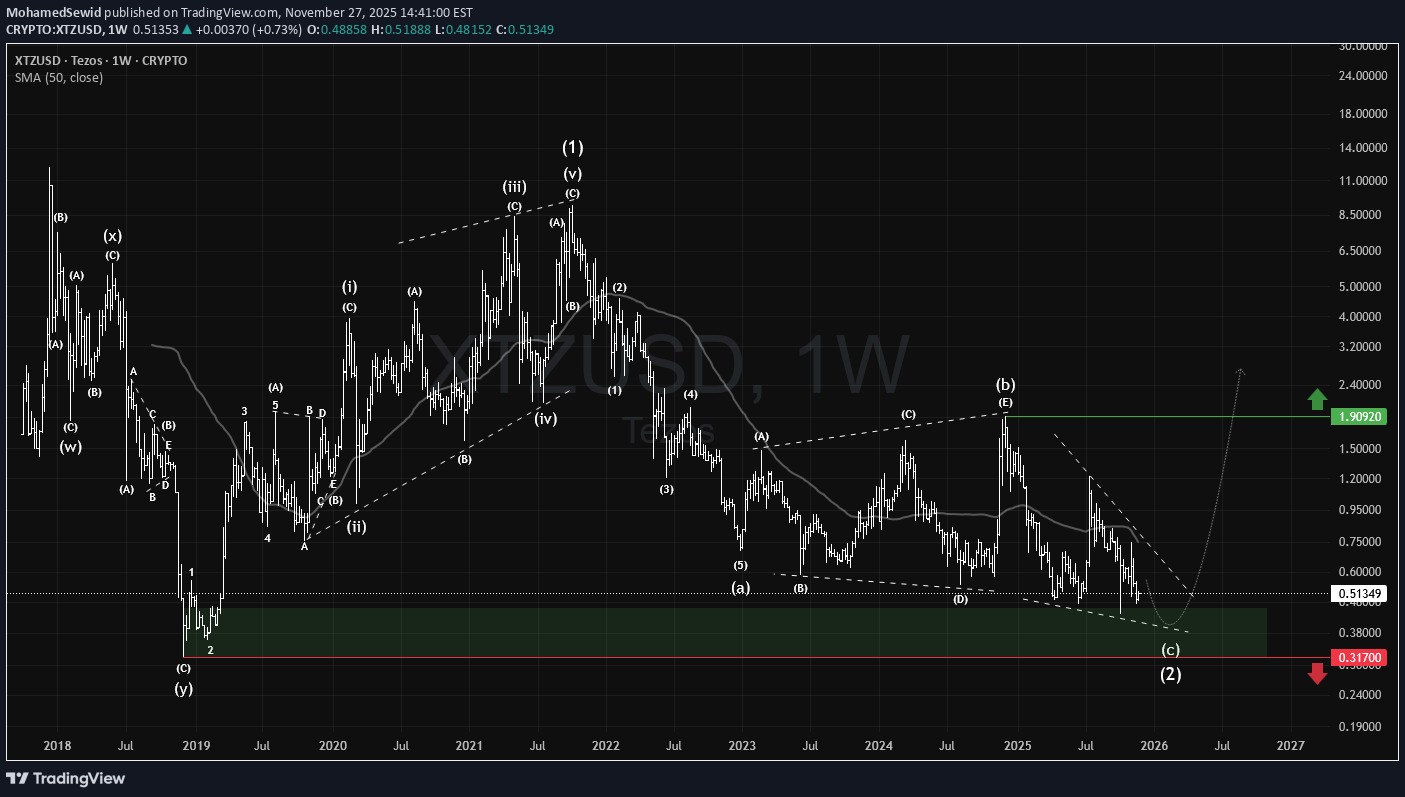
#XTZ has been a leading old coin few years ago. After a long decline from its late 2021 top, it continues to hold above a key historical support level. As long as it stays above the $0.317 stop-loss, a strong bullish comeback remains possible. #Tezos

معامله الگوریتمی XTZ/USDT: راز استراتژی سودآور با تست کامل تاریخچه!
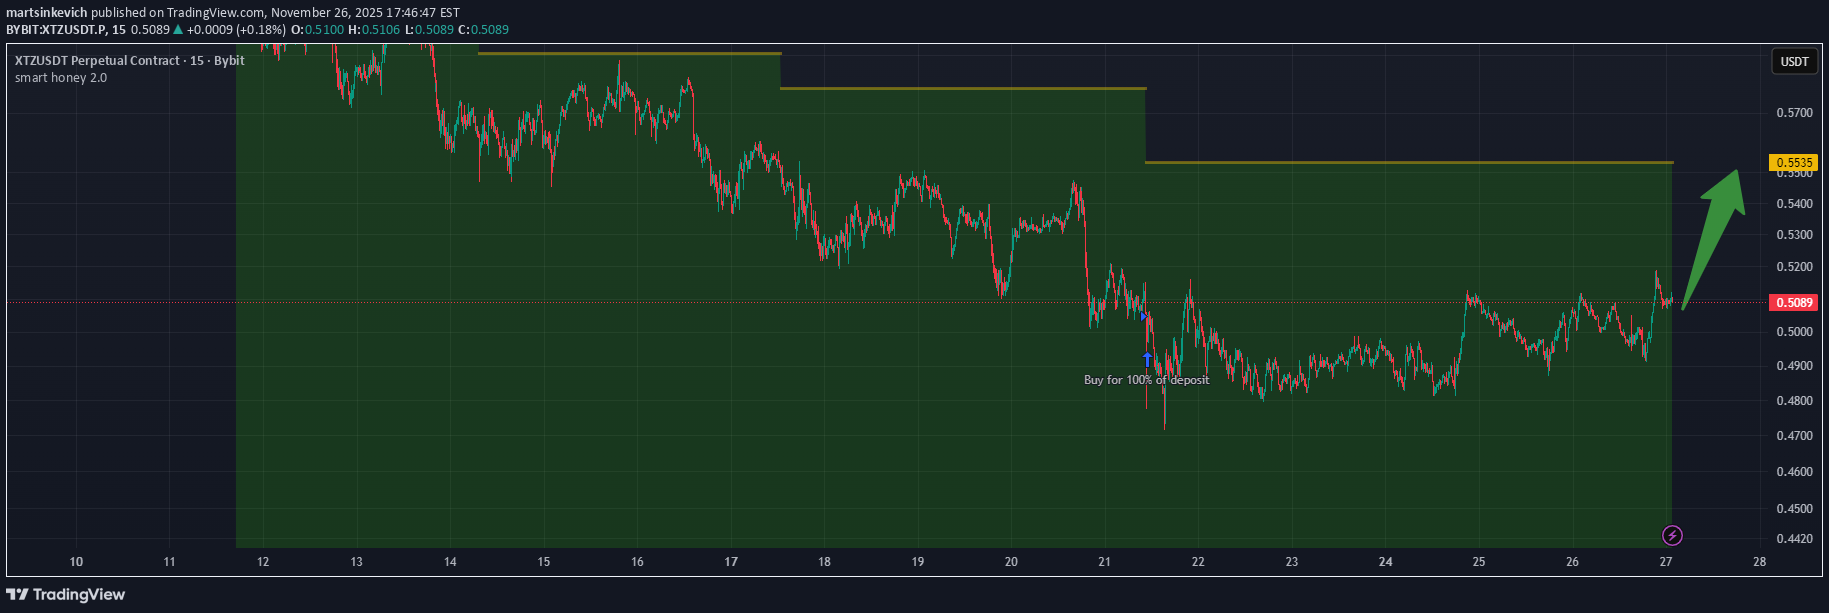
Press "Grab this chart", run strategy tester for entire history and make sure that is good time for a long to yellow line

mastercrypto2020
سیگنال خرید قوی XTZ/USDT: استراتژی بلندمدت با اهداف سود هیجانانگیز (اهرم پیشنهادی)

--- 📢 Trade Idea: XTZ/USDT Type: Long Entry Zone: 0.579 – 0.590 🎯 Take-Profit Targets (Partial Exits): • TP1 = 0.604 • TP2 = 0.616 • TP3 = 0.626 • TP4 = 0.637 • TP5 = 0.665 🛑 Stop-Loss: 0.568 ⏱ Timeframe: 1H ⚖️ Risk/Reward Ratio: 2.86 💥 Suggested Leverage: 5x – 10x --- 🧠 Technical Analysis Summary: XTZ is showing a potential bullish reversal from the 0.57–0.58 accumulation zone, supported by higher lows and a tightening price range. A confirmed breakout above 0.60 may trigger upward continuation toward 0.63–0.66 resistance levels. RSI has recovered from the oversold area, and the 20 EMA is flattening, indicating a possible momentum shift in favor of buyers. --- ⚙️ Trade Management Tips: • Take partial profits at TP1, and move SL to entry once reached. • For higher targets (TP3–TP5), consider trailing stop-loss to secure profits. • Avoid re-entry if price closes below 0.568 on 1H. --- ⚠️ Disclaimer: This setup is for educational purposes only and not financial advice. Always DYOR and manage your capital responsibly. --- 📌 Hashtags for TradingView: #XTZUSDT #CryptoSignal #LongSetup #TechnicalAnalysis #CryptoTrading #TradingViewIdeas #Tezos --
mastercrypto2020
سیگنال خرید قوی XTZ/USDT: فرصت رشد با اهداف 0.680!
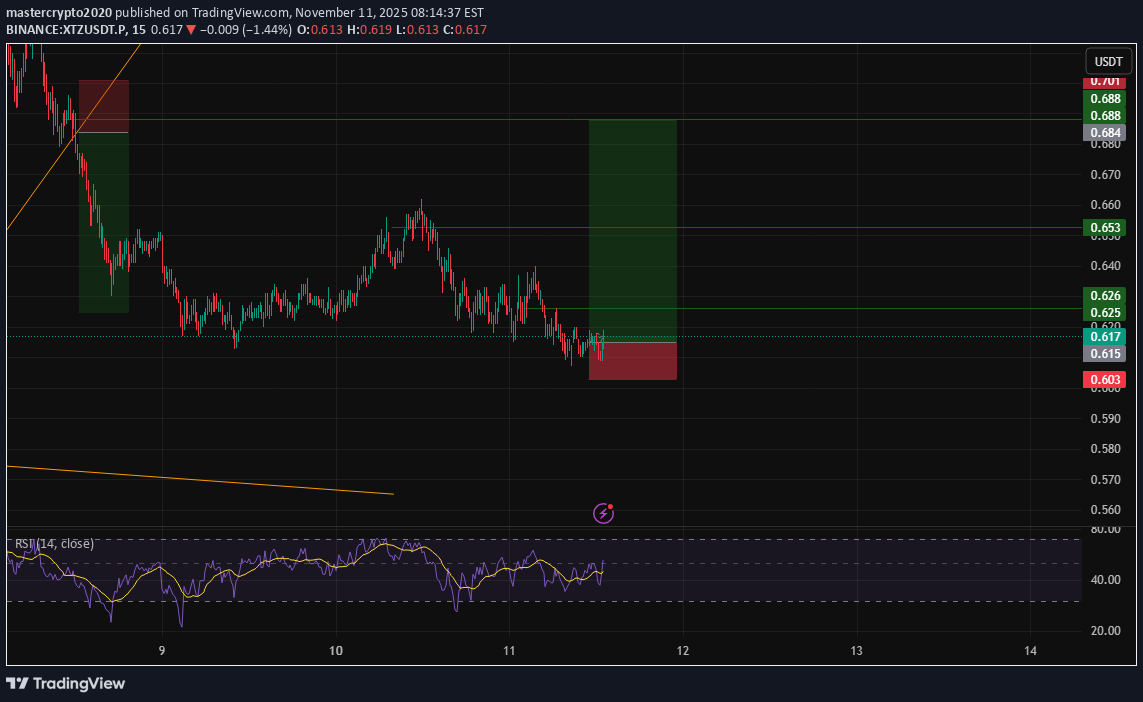
--- 📢 Signal Alert 🔹 Pair: XTZ / USDT 📈 Trade Type: Long 💰 Entry: Market Price 🎯 Take-Profit Targets (Partial Management): ▫️ TP1 = 0.626 ▫️ TP2 = 0.653 ▫️ TP3 = 0.680 🛑 Stop-Loss: 0.600 📊 Timeframe: 1H ⚖️ Risk/Reward Ratio: 6.0 📌 Suggested Leverage: 5x – 10x ⚠️ Capital management is mandatory. 💬 Please review the chart before entering the trade. --- 🧠 Technical Analysis Summary: XTZ is forming a bullish reversal pattern from the 0.60–0.61 support area. Momentum is strengthening with higher lows and rising volume, indicating potential for upward continuation. If price sustains above 0.620, a push toward 0.653–0.680 is expected. RSI confirms recovery from the oversold zone, and EMA 20 crossover suggests a short-term bullish trend. --- ⚙️ Trade Management Tip: • Take partial profit at TP1, move SL to entry once price holds above 0.63. • Trail your stop for TP2–TP3 to secure profits. • Avoid re-entry if price drops below 0.600. --- ⚠️ Disclaimer: This analysis is for educational purposes only and not financial advice. Always DYOR (Do Your Own Research) and apply proper risk management. ---
mastercrypto2020
سیگنال خرید AAVE/USDT: ورود قدرتمند با ریسک به ریوارد 3 به 1!

--- 📢 Signal Alert 🔹 Pair: AAVE / USDT 📈 Trade Type: Long 💰 Entry Zone: 198.05 – 200.92 🎯 Take-Profit Targets (with partial management): ▫️ TP1 = 204.35 ▫️ TP2 = 208.68 ▫️ TP3 = 212.00 ▫️ TP4 = 214.84 🛑 Stop-Loss: 196.00 📊 Timeframe: 1H ⚖️ Risk/Reward Ratio: 3.0 📌 Suggested Leverage: 5x – 10x ⚠️ Capital management is mandatory. 💬 Please review the chart carefully before entry. --- 🧠 Technical Analysis Summary: AAVE shows a bullish continuation pattern after finding strong support near 198–199 USD. The price has broken above a local resistance zone and is forming higher lows, signaling potential upward momentum. Volume is rising, confirming buyers’ control. Momentum indicators such as RSI (above 55) and MACD bullish crossover strengthen the long bias. A sustained close above 201.0 could accelerate the move toward 208–214 levels. --- ⚙️ Trade Management Tip: After TP1 hits, move Stop-Loss to Entry and secure partial profits. Allow the rest to ride toward TP3–TP4 for maximum gain. --- ⚠️ Disclaimer: This setup is for educational purposes only and not financial advice. Always manage your risk and perform independent analysis (DYOR) before trading. ---
mastercrypto2020
سیگنال خرید بلندمدت XTZ/USDT: فرصت سود 5 برابری با اهرم 10x!
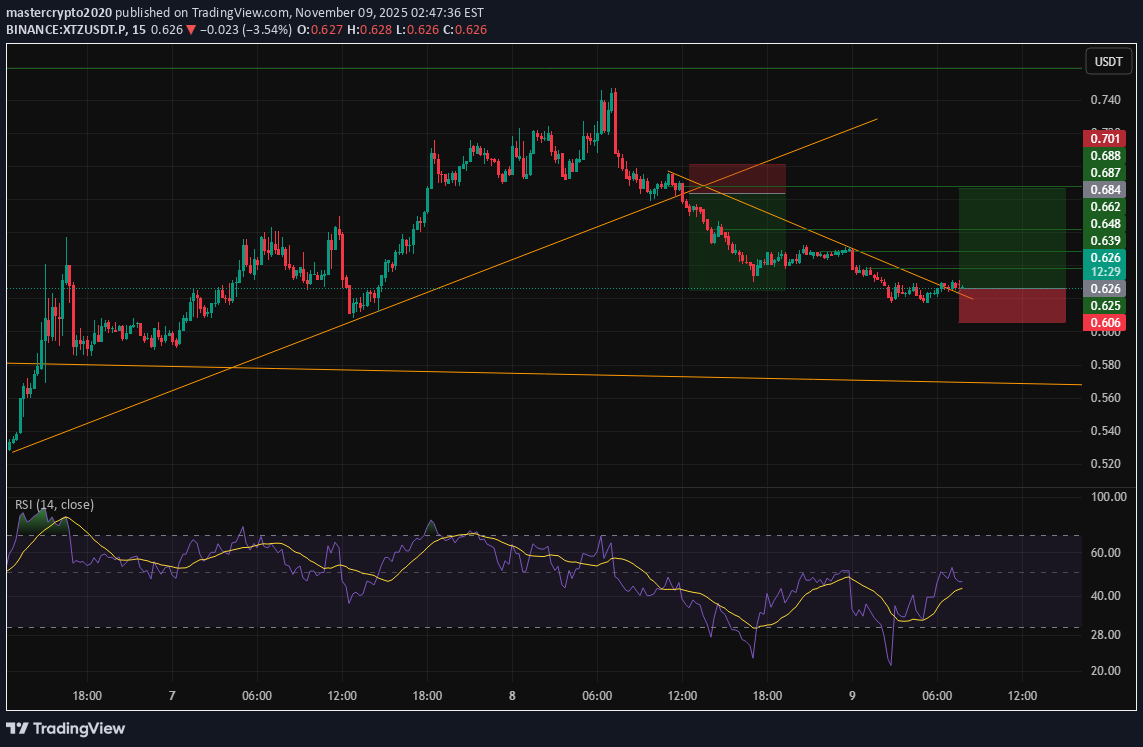
--- 📢 Signal Alert 🔹 Pair: XTZ / USDT 📈 Trade Type: Long 💰 Entry: 0.626 🎯 Take-Profit Targets (Partial Management): ▫️ TP1 = 0.639 ▫️ TP2 = 0.648 ▫️ TP3 = 0.662 ▫️ TP4 = 0.683 🛑 Stop-Loss: 0.605 📊 Timeframe: 1H ⚖️ Risk/Reward Ratio: 5.73 📌 Suggested Leverage: 5x – 10x ⚠️ Capital management is mandatory. 💬 Please review the chart before entering the trade. --- 🧠 Technical Analysis Summary: XTZ is currently rebounding from a strong support level near 0.615, forming a bullish reversal pattern on lower timeframes. A clean breakout above 0.630 would confirm bullish continuation toward 0.648 – 0.683. The RSI has crossed above 50, showing renewed bullish momentum, and MACD is forming a positive crossover. Stop-loss is placed just below the latest swing low to protect against volatility. --- ⚙️ Trade Management Tip: Take partial profit at TP1, then move stop-loss to breakeven. Let the rest of the position run toward TP3–TP4 if momentum continues. Avoid entering before confirmation candle close above 0.628. --- ⚠️ Disclaimer: This signal is for educational purposes only and not financial advice. Always DYOR (Do Your Own Research) and use proper risk management before trading. ---
mastercrypto2020
سیگنال فروش فوری تتا (XTZ/USDT): ورود به معامله شورت با اهداف سود چشمگیر
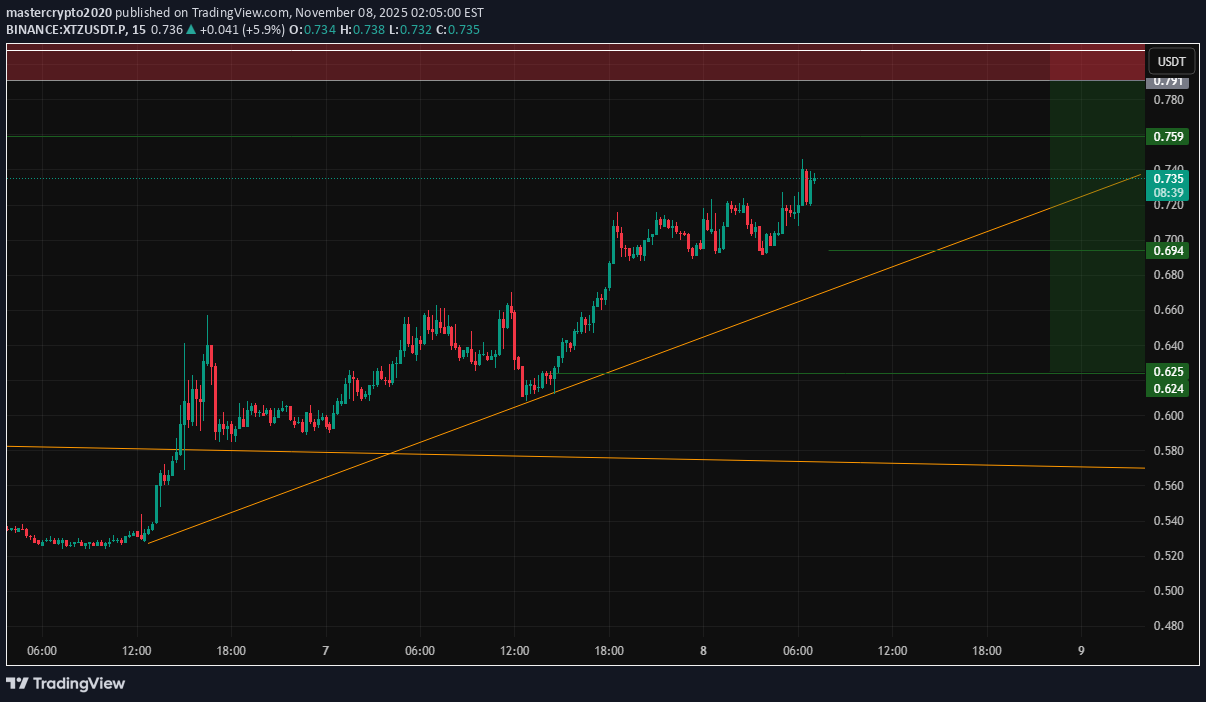
--- 📢 Signal Alert 🔹 Pair: XTZ / USDT 📉 Trade Type: Short 💰 Entry Zone: 0.790 – 0.845 🎯 Take-Profit Targets: TP1 = 0.759 TP2 = 0.695 TP3 = 0.625 🛑 Stop-Loss: 0.846 📊 Timeframe: 1H ⚖️ Risk/Reward Ratio: 3.0 📌 Suggested Leverage: 3x – 5x ⚠️ Capital management is mandatory. Please analyze the chart carefully before entering the trade. --- 🧠 Technical Analysis Summary: XTZ is showing clear bearish pressure after rejecting the 0.84–0.85 resistance zone, which previously acted as a strong supply area. Price action confirms a lower-high structure with bearish candles gaining strength. 🔸 Key Observations: RSI has crossed below 50, supporting bearish continuation. Volume is increasing on red candles, showing strong seller dominance. EMA alignment favors short positions, confirming downside momentum. First target (0.759) aligns with short-term support; deeper targets (0.695–0.625) match major daily demand zones. Stop-loss is placed safely above recent liquidity highs to avoid false breakouts. --- ⚙️ Trade Management Tip: Once TP1 is reached, move SL to Entry and take partial profit to secure gains. Let the rest ride toward TP2–TP3 for extended profits. --- ⚠️ Disclaimer: This analysis is for educational and informational purposes only and not financial advice. Always Do Your Own Research (DYOR) and use proper risk management before entering any trade. ---

Devin_coffee01
واگرایی صعودی XTZ در تایم فریم ماهانه: آیا منتظر انفجار قیمتی هستیم؟
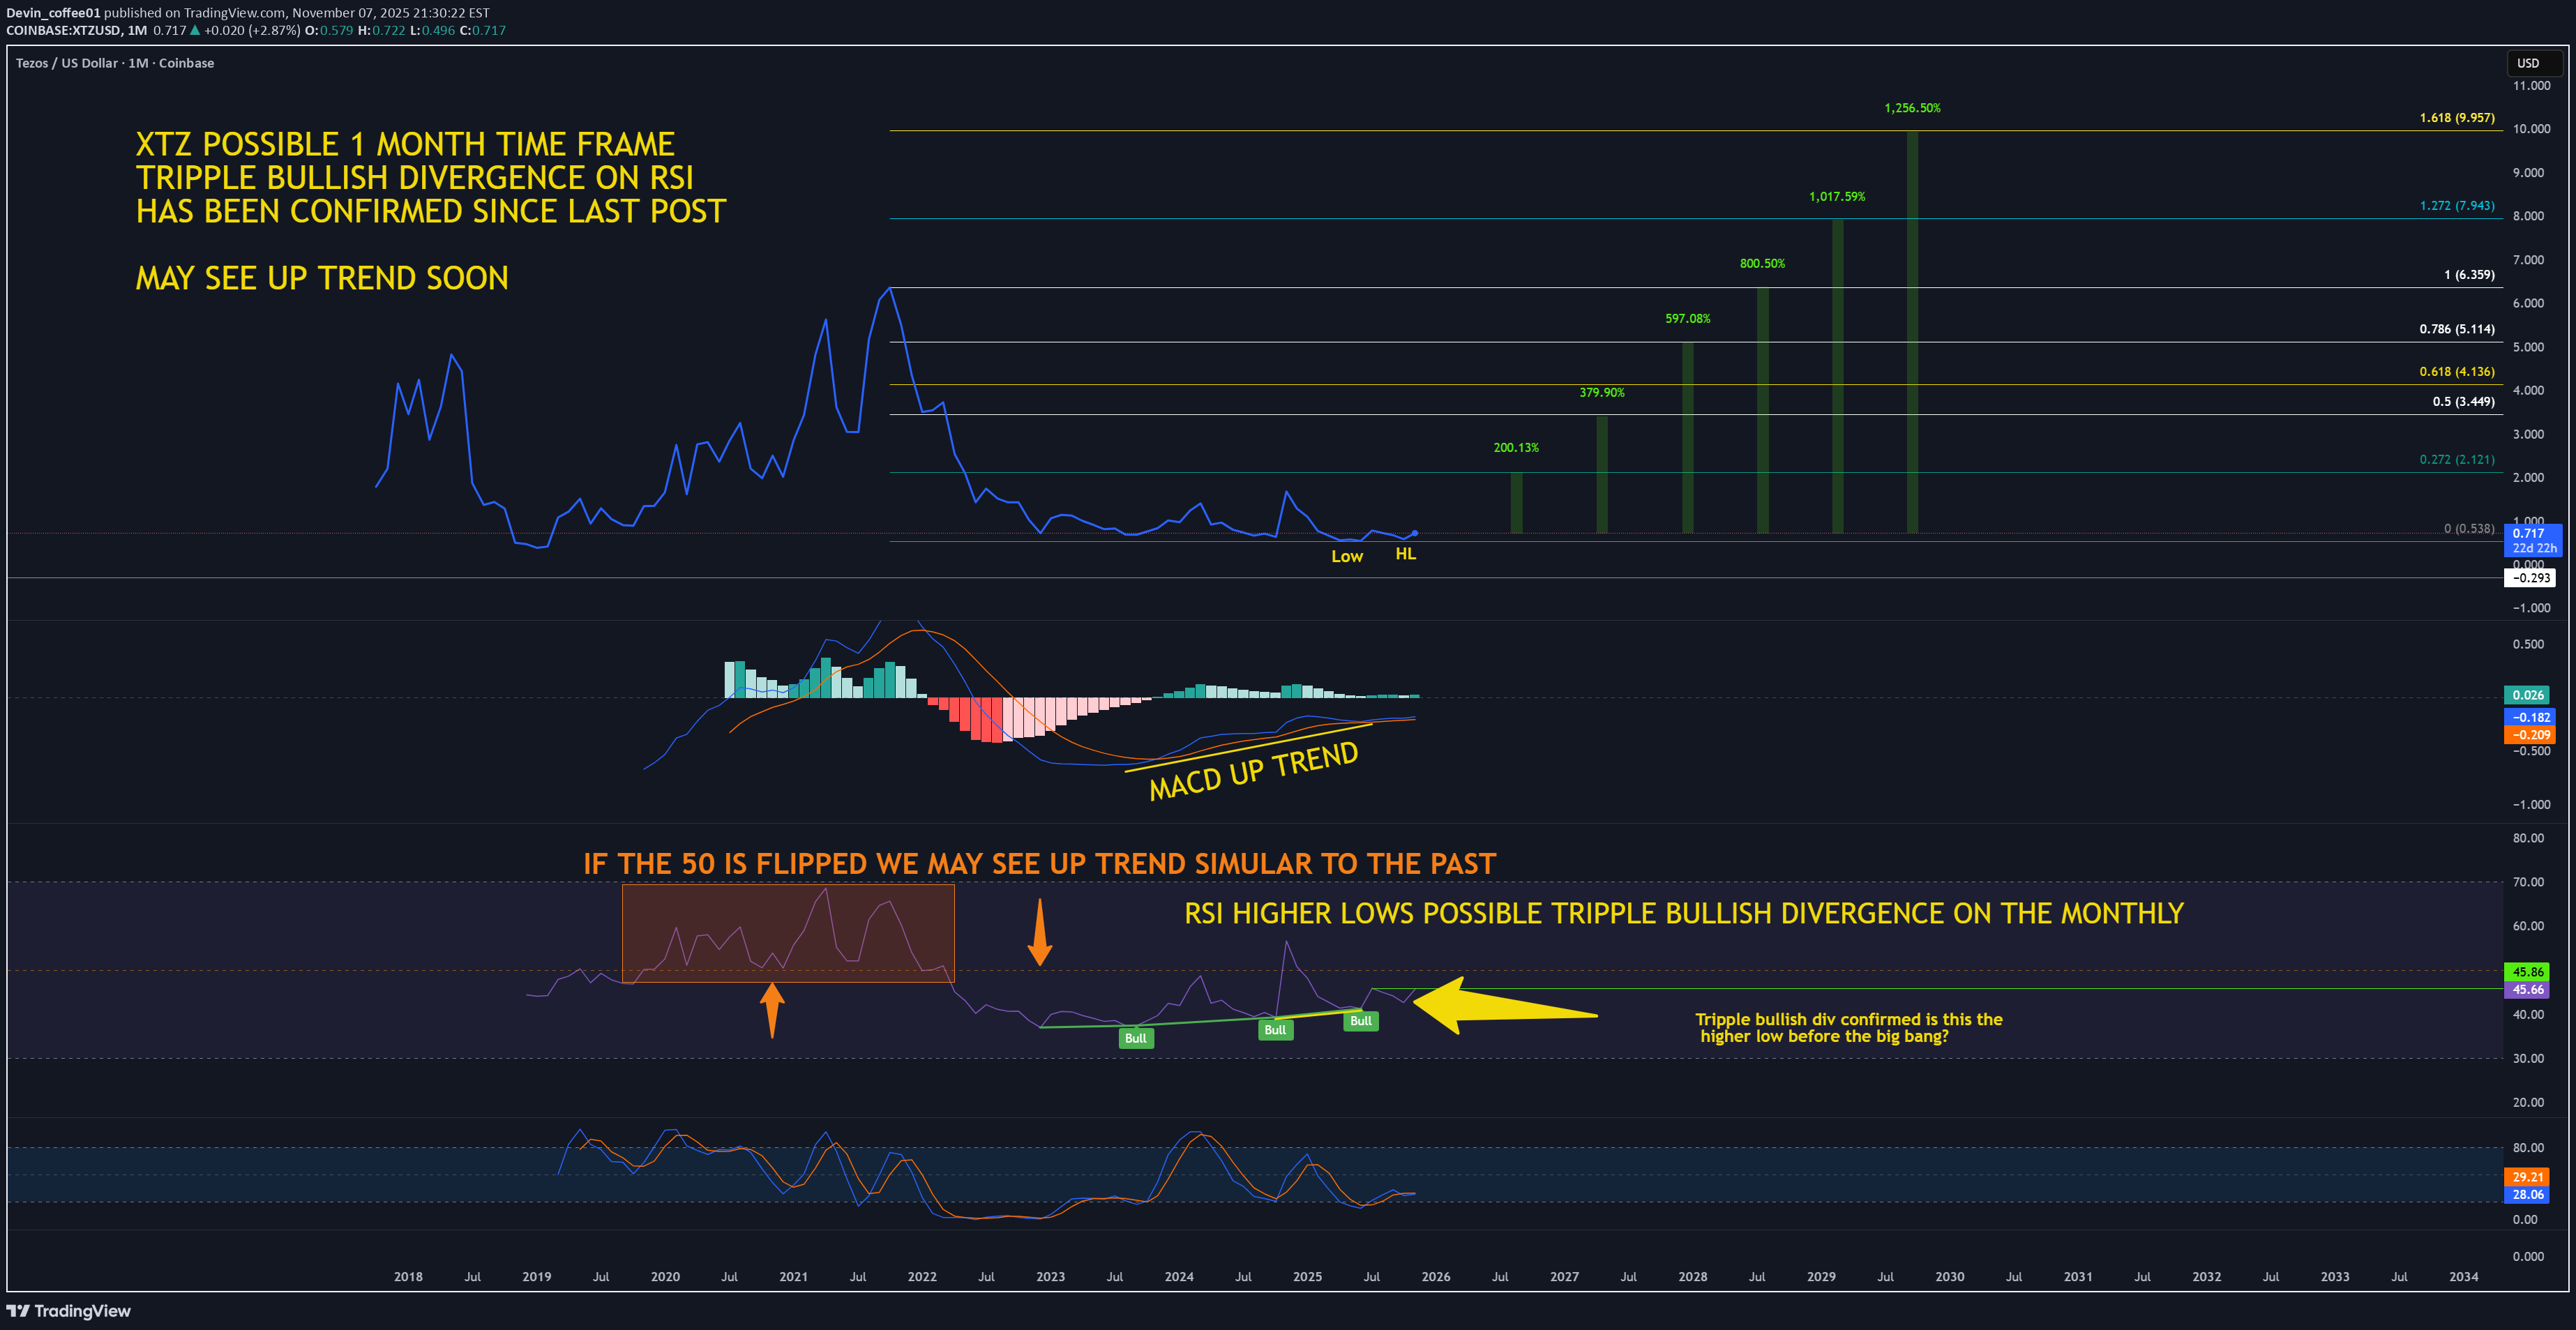
Bullish divergence on the one month could be foreshadowing a big move. As we know with Divergence, the higher the timeframe the bigger the move potentially that is. XTZ has been one of the quiet cryptos not much news, price popping and dropping. It is now making a possible higher low after bullish divergence. Lets see what happens. 🍿

Alpha-GoldFX
الگوی گُوِه نزولی در تِزوس (XTZ): آیا جهش ۹۰ درصدی در راه است؟
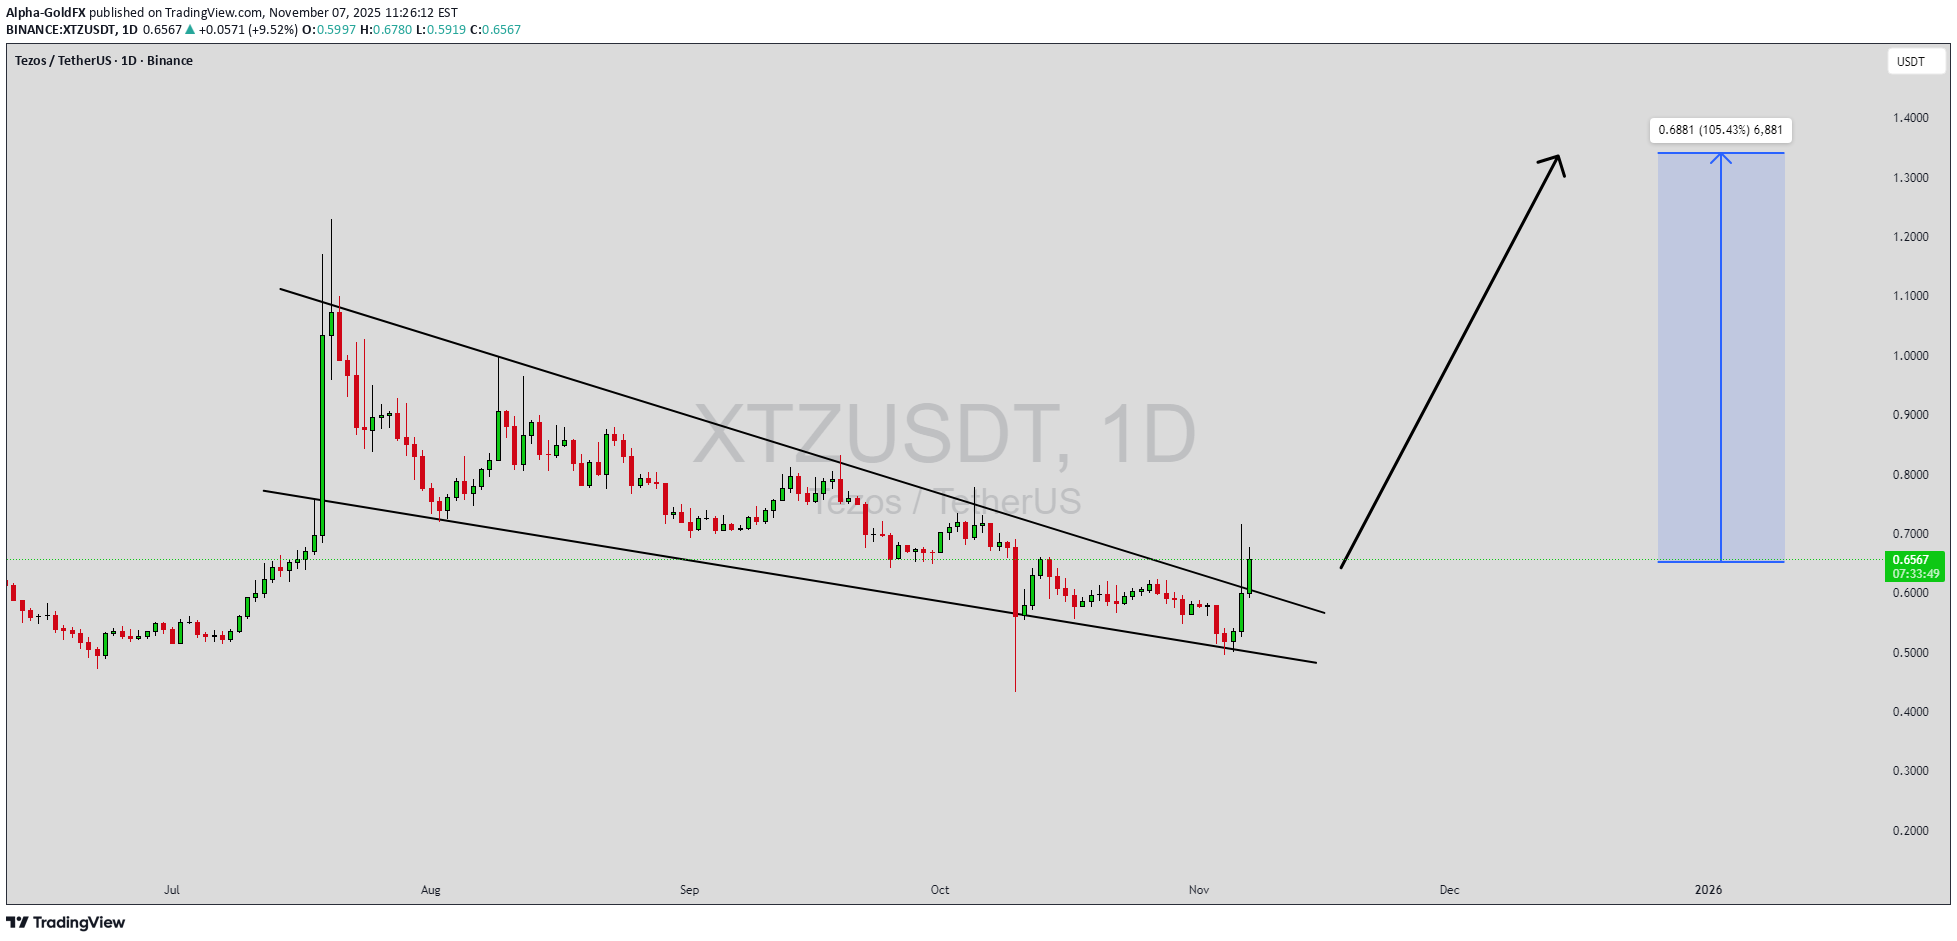
XTZUSDT is forming a clear falling wedge pattern, a classic bullish reversal signal that often indicates an upcoming breakout. The price has been consolidating within a narrowing range around $0.65 USDT, suggesting that selling pressure is weakening while buyers are beginning to regain control amid a recent 20% surge to multi-week highs. With consistent volume confirming accumulation at lower levels exceeding $180 million daily, the setup hints at a potential bullish breakout soon. The projected move could lead to an impressive gain of 90% to 100%+ once the price breaks above the wedge resistance, igniting interest in XTZUSDT price prediction for Tezos enthusiasts. This falling wedge pattern is typically seen at the end of downtrends or corrective phases, and it represents a potential shift in market sentiment from bearish to bullish. Traders closely watching XTZUSDT are noting the strengthening momentum as it nears a breakout zone near $0.70, fueled by Etherlink L2 launches and RWA tokenization momentum. The good trading volume adds confidence to this pattern, showing that market participants are positioning early in anticipation of a reversal in this self-amending layer 1 blockchain token. Investors’ growing interest in XTZUSDT reflects rising confidence in the project’s long-term fundamentals and current technical strength, especially with integrations like Google cloud credits for builders and European asset expansions. If the breakout confirms with sustained volume, this could mark the start of a fresh bullish leg. Traders might find this a valuable setup for medium-term gains, especially as the wedge pattern completes and buying momentum accelerates in falling wedge breakout crypto plays. ✅ Show your support by hitting the like button and ✅ Leaving a comment below! (What is You opinion about this Coin) Your feedback and engagement keep me inspired to share more insightful market analysis with you!
Disclaimer
Any content and materials included in Sahmeto's website and official communication channels are a compilation of personal opinions and analyses and are not binding. They do not constitute any recommendation for buying, selling, entering or exiting the stock market and cryptocurrency market. Also, all news and analyses included in the website and channels are merely republished information from official and unofficial domestic and foreign sources, and it is obvious that users of the said content are responsible for following up and ensuring the authenticity and accuracy of the materials. Therefore, while disclaiming responsibility, it is declared that the responsibility for any decision-making, action, and potential profit and loss in the capital market and cryptocurrency market lies with the trader.