Technical analysis by Yurino86 about Symbol XTZ: Buy recommendation (11/6/2025)

Yurino86
خرید تزوس (XTZ) اکنون: تحلیل شگفتانگیز با پتانسیل سود 13 برابری!
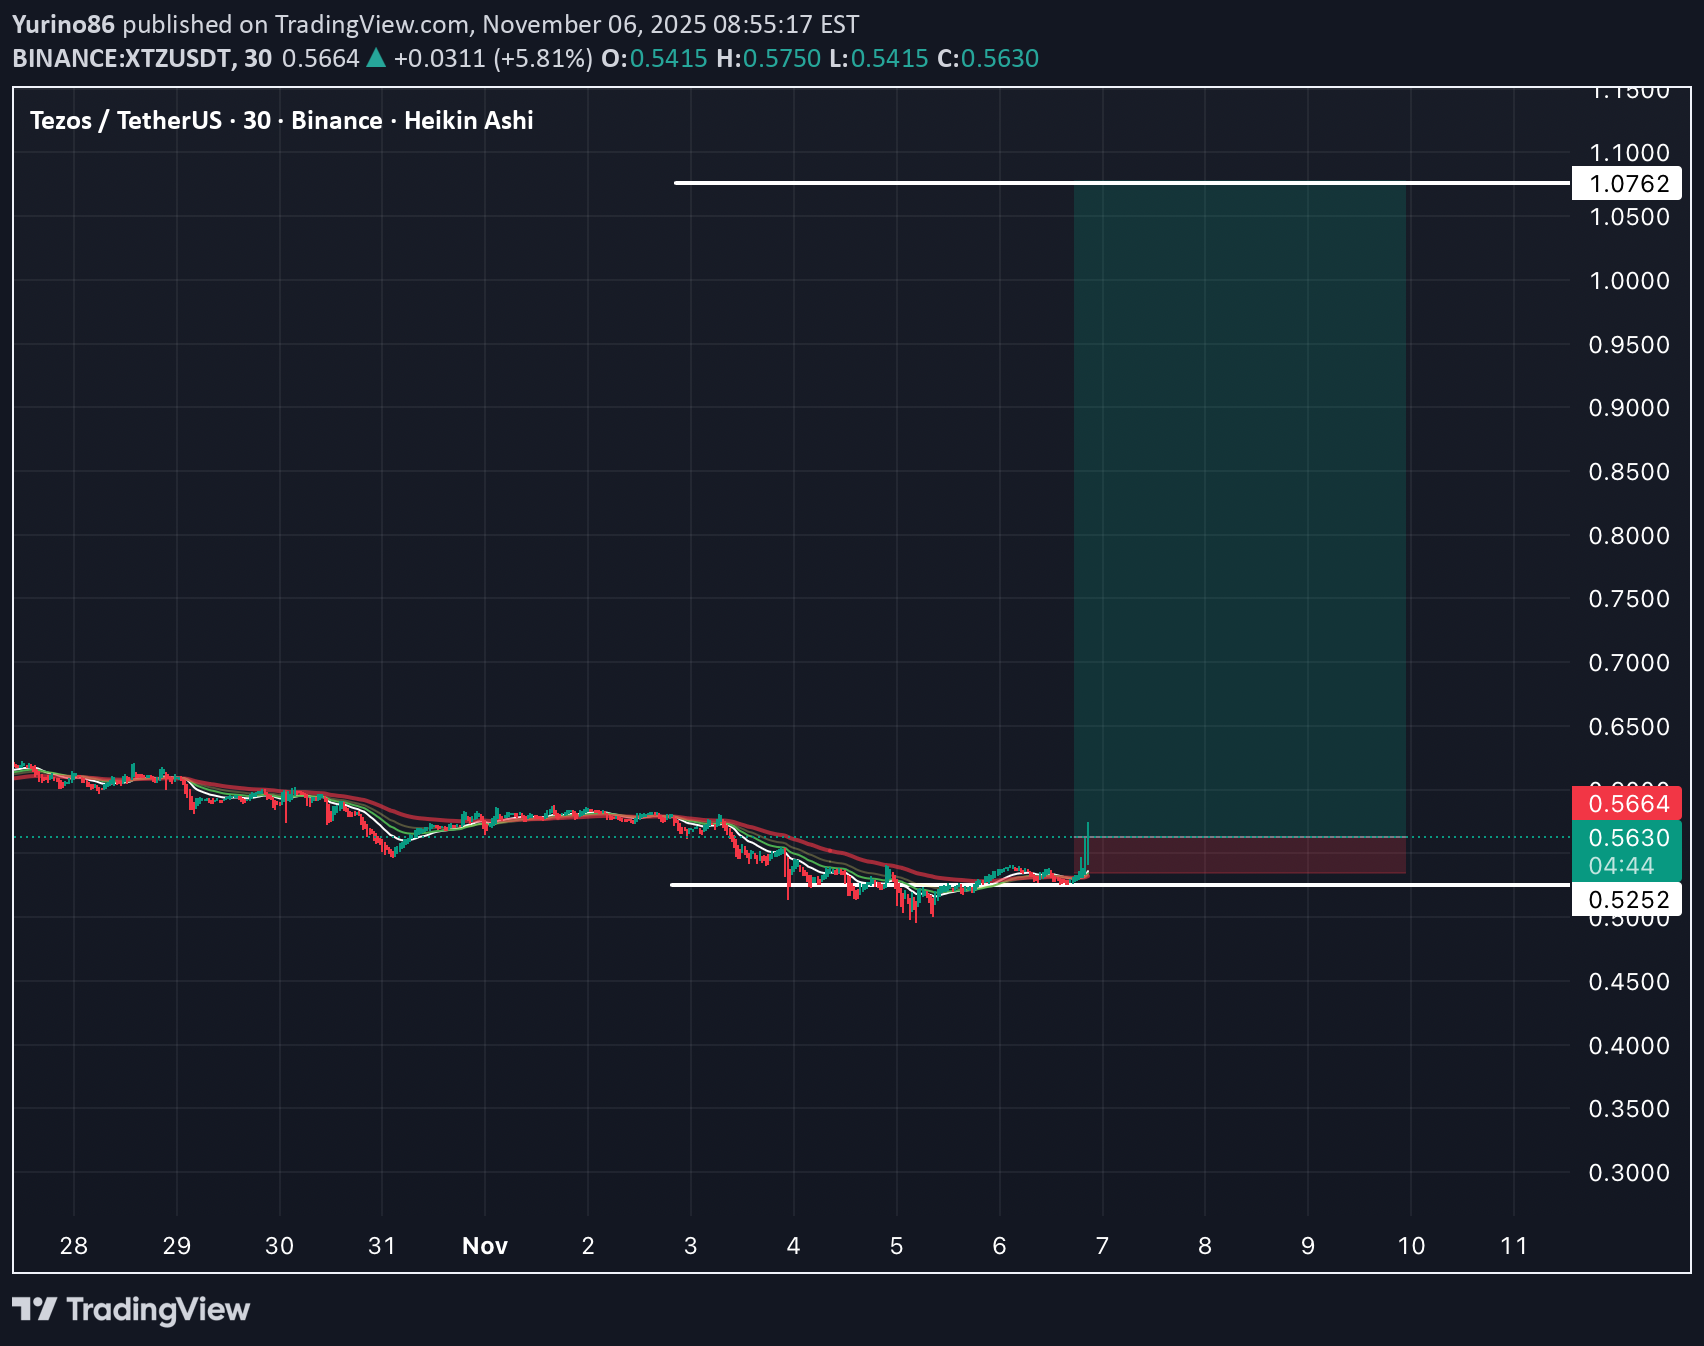
Based on the XTZ/USDT 30-minute chart using Heikin Ashi candles: • Current Price: The price is around $0.5636 (as of 20:49 on November 06, 2025). • Support Zone: The chart shows a strong support area around $0.5252. The price has touched and held firm above this level in recent days, showing consolidation in this region, which indicates buying pressure is starting to emerge and preventing the price from dropping lower. • Trade Setup: • Entry: Currently around the market price, approximately $0.5636. • Stop Loss: Placed below the nearest support zone, around $0.5252 (or slightly lower to avoid wick-hunts). • Take Profit: A relatively distant target, around $1.0762 (based on the peak level drawn on the chart). • Candlestick Signal: Using Heikin Ashi candles, small green candles are starting to appear after a period of red accumulation, which is an early sign of a reversal or at least an impending upward move. • Risk/Reward Ratio (R:R): With Risk: $0.5636 - $0.5252 = $0.0384 and Reward: $1.0762 - $0.5636 = $0.5126. The R:R ratio is $0.5126 / $0.0384 \approx 13.3:1. This is an extremely attractive ratio, suggesting that a successful trade could yield massive profits relative to the risk.