
XNO
Nano
| تریدر | نوع سیگنال | حد سود/ضرر | زمان انتشار | مشاهده پیام |
|---|---|---|---|---|
No results found. | ||||
Price Chart of Nano
سود 3 Months :
سیگنالهای Nano
Filter
Sort messages by
Trader Type
Time Frame

پیشبینی جسورانه ارز XNO: موج سوم آغاز شد؟ (تحلیل فنی)
XNOUSDT Wave 2 looks complete, and the recent breakout suggests the early development of wave 3. As long as price holds above the recent low, the bullish setup remains valid. =This is not financial advice.

FortuneAI
XNO آماده انفجار است؟ تحلیل تکنیکال صعودی و رمز موفقیت در بازار
XNO Technicals look very bullish and it may outperform market. Use Proper Risk Management

ساختار موج 3 ارز XNO: آیا این تازه شروع یک صعود بزرگ است؟
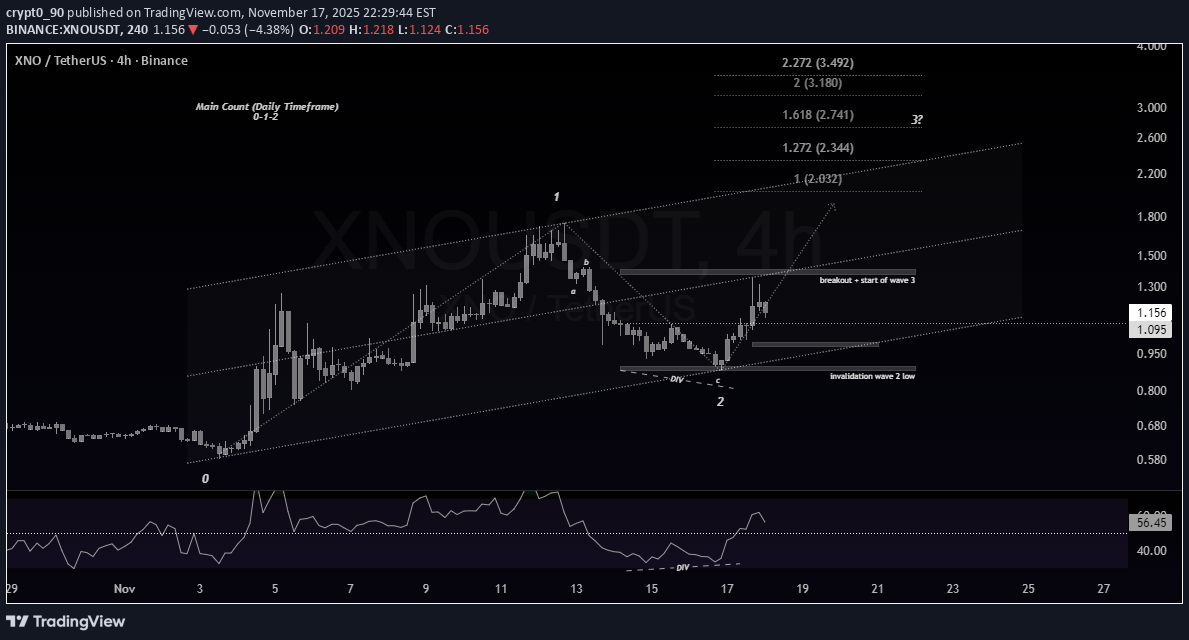
XNOUSDT XNO is forming a clean Elliott Wave structure at the moment. The main wave count is taken from the daily timeframe, where Wave 1 and Wave 2 are already established. On the 4H chart, Wave 2 ended with a clear bullish RSI divergence, and price respected the support zone perfectly. The break above the internal “b-wave” high confirms the early development of Wave 3. As long as price holds above the Wave-2 low, the bullish setup remains valid. I’ll update Wave 3 targets as Wave i unfolds and provides clearer levels. This is a personal wave count, not financial advice.

zainfaraan
آمادگی برای جهش بزرگ: تحلیل تکنیکال صعودی با الگوهای کلیدی
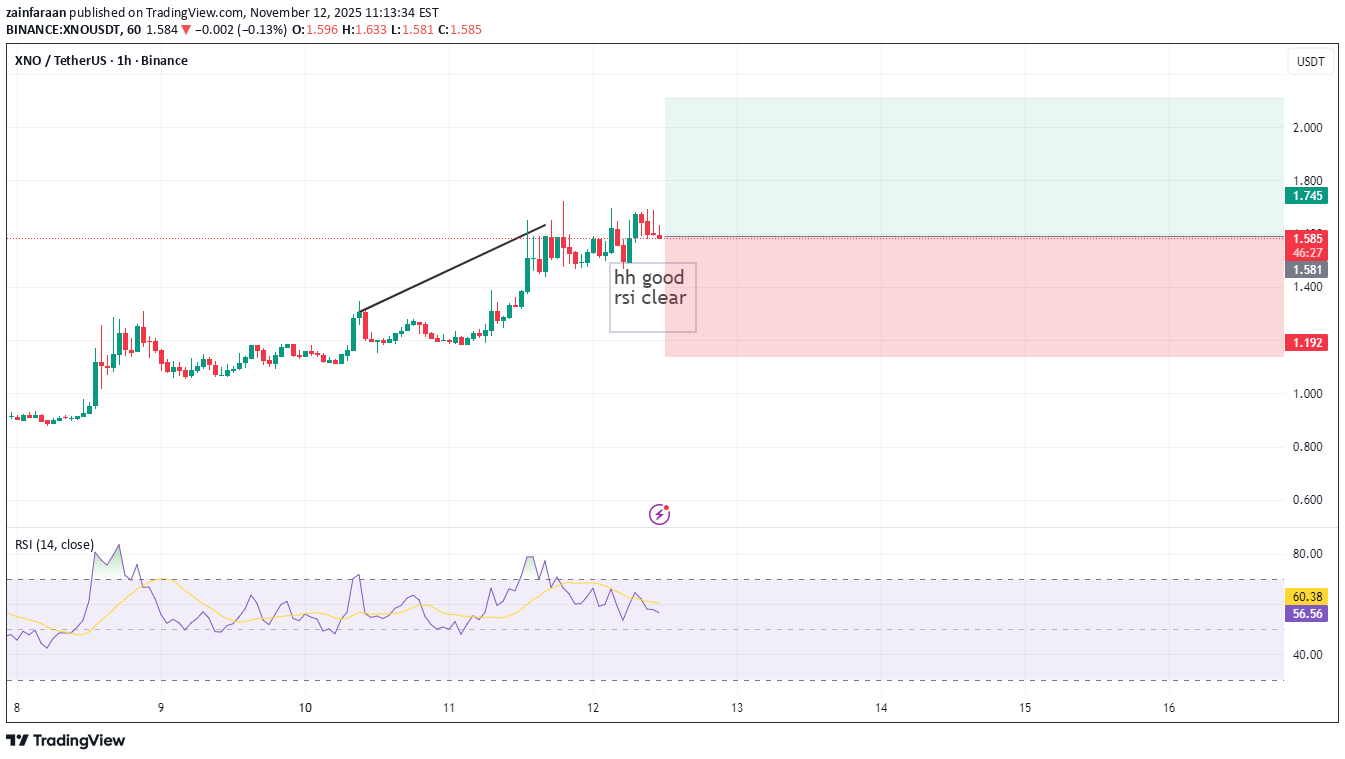
take a stratiest 2 shot list higher high make rsi d clear ascending channel. flag

Alpha-GoldFX
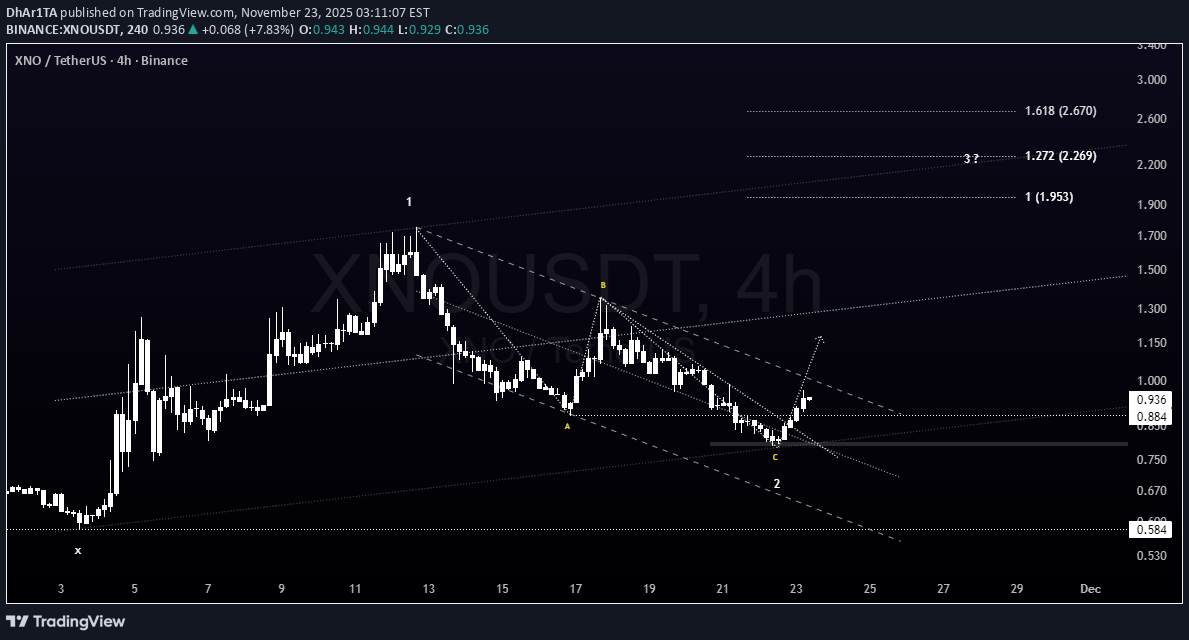
الگوی گوه نزولی XNO/USDT: راز انفجار 70 درصدی قیمت چیست؟
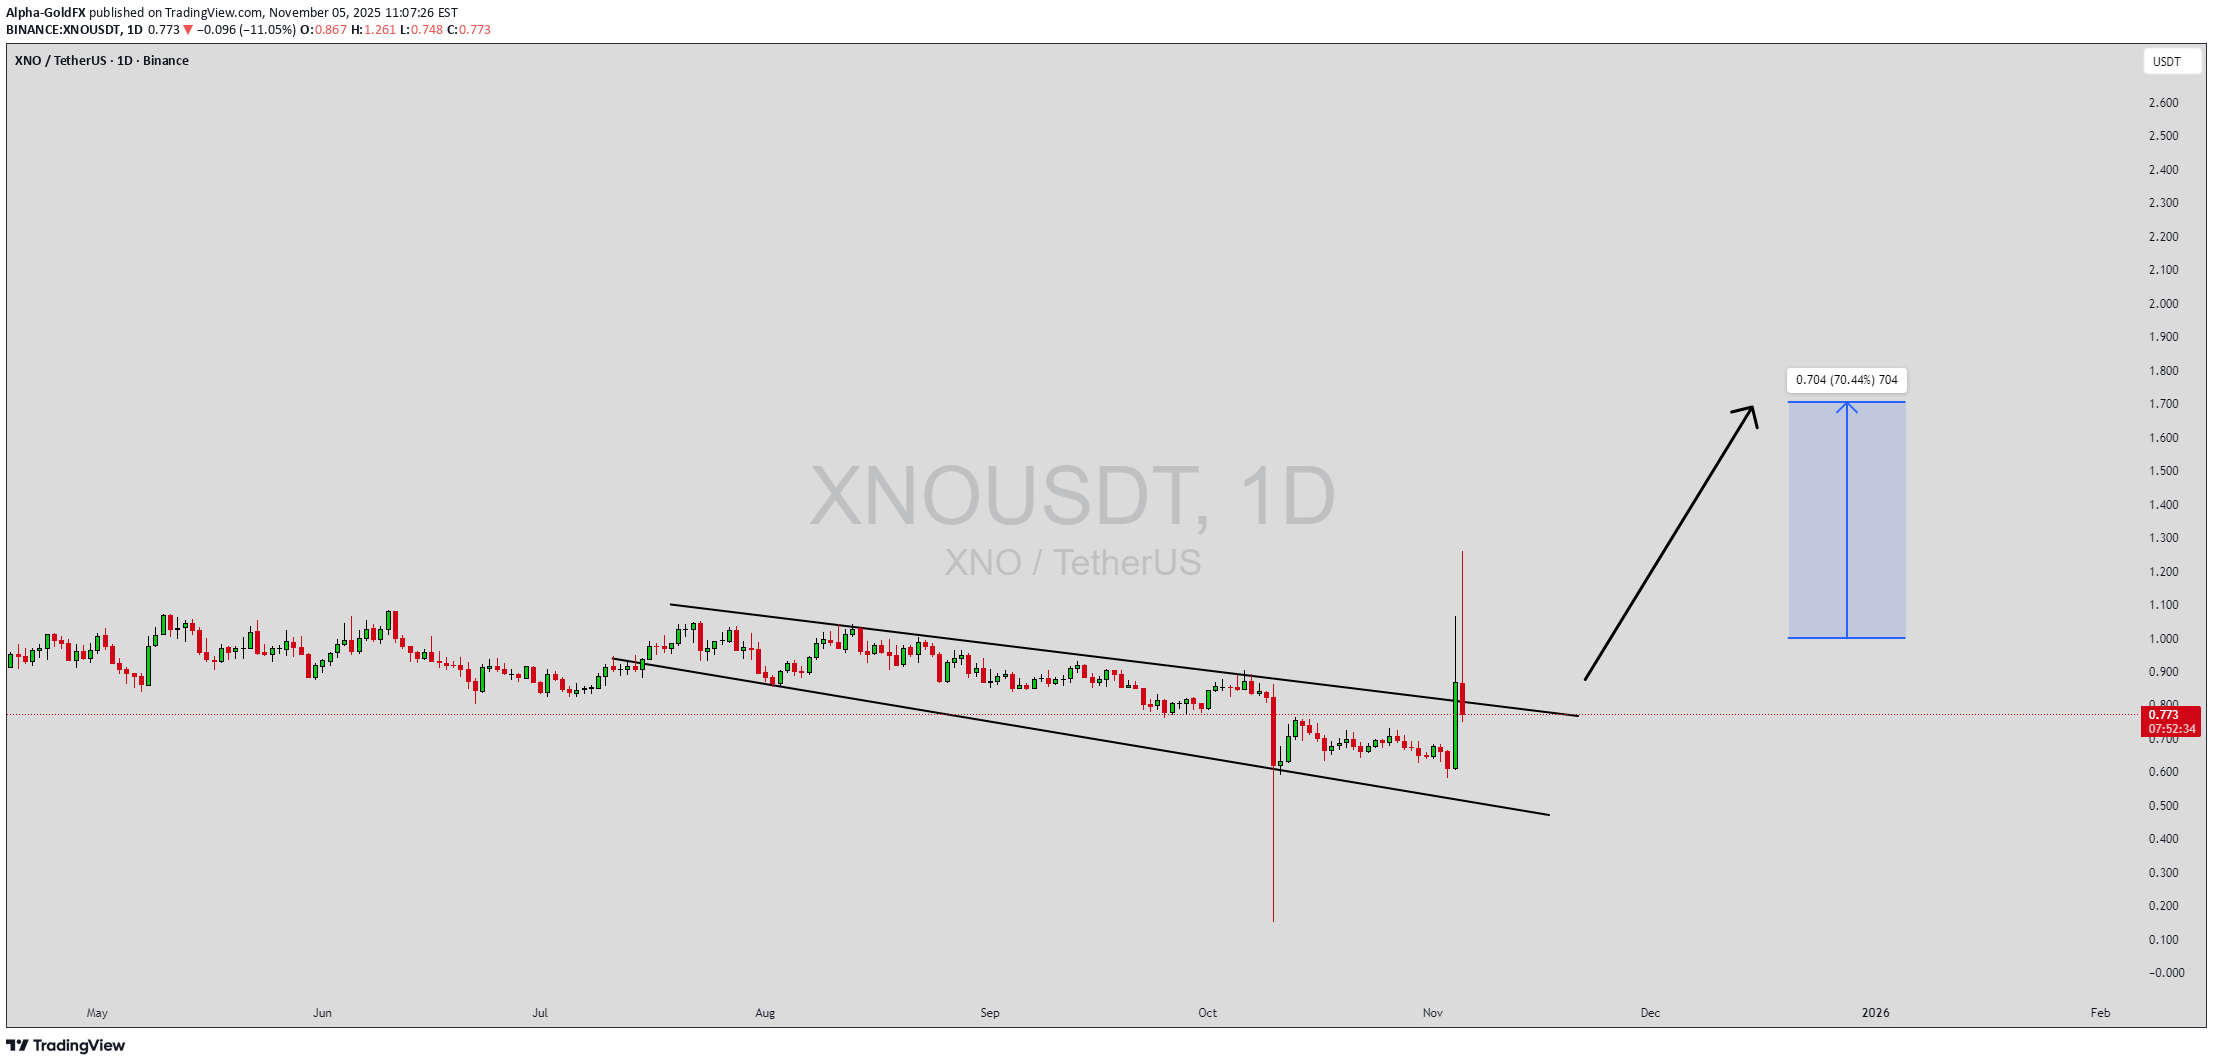
XNOUSDT is currently forming a falling wedge pattern, a powerful bullish setup that often signals the end of a downtrend and the beginning of a strong upward move. The price action shows a narrowing range with lower highs and lower lows, reflecting a period of consolidation before a potential breakout. The pattern, combined with good trading volume, indicates that buying pressure is gradually increasing, and a breakout to the upside could soon trigger a 60% to 70% rally from current levels. This formation suggests that bearish momentum is weakening while smart money accumulation is taking place. Traders are watching closely as the price approaches the wedge’s resistance line, where a confirmed breakout could invite more investors to join the move. The volume behavior supports this bullish outlook, with steady participation showing that market confidence in XNOUSDT is building. Investors are becoming increasingly optimistic about this project due to its solid fundamentals and technical positioning. The potential for a bullish reversal has attracted significant attention across trading communities, with many anticipating a breakout-driven surge. If momentum continues to strengthen, XNOUSDT could enter a new uptrend phase, delivering impressive short- to mid-term gains. ✅ Show your support by hitting the like button and ✅ Leaving a comment below! (What is You opinion about this Coin) Your feedback and engagement keep me inspired to share more insightful market analysis with you!

CryptoWithJames
سیگنال انفجاری XNO: خروج از الگوی گوه نزولی و پتانسیل رشد 130% تا 2 دلار!
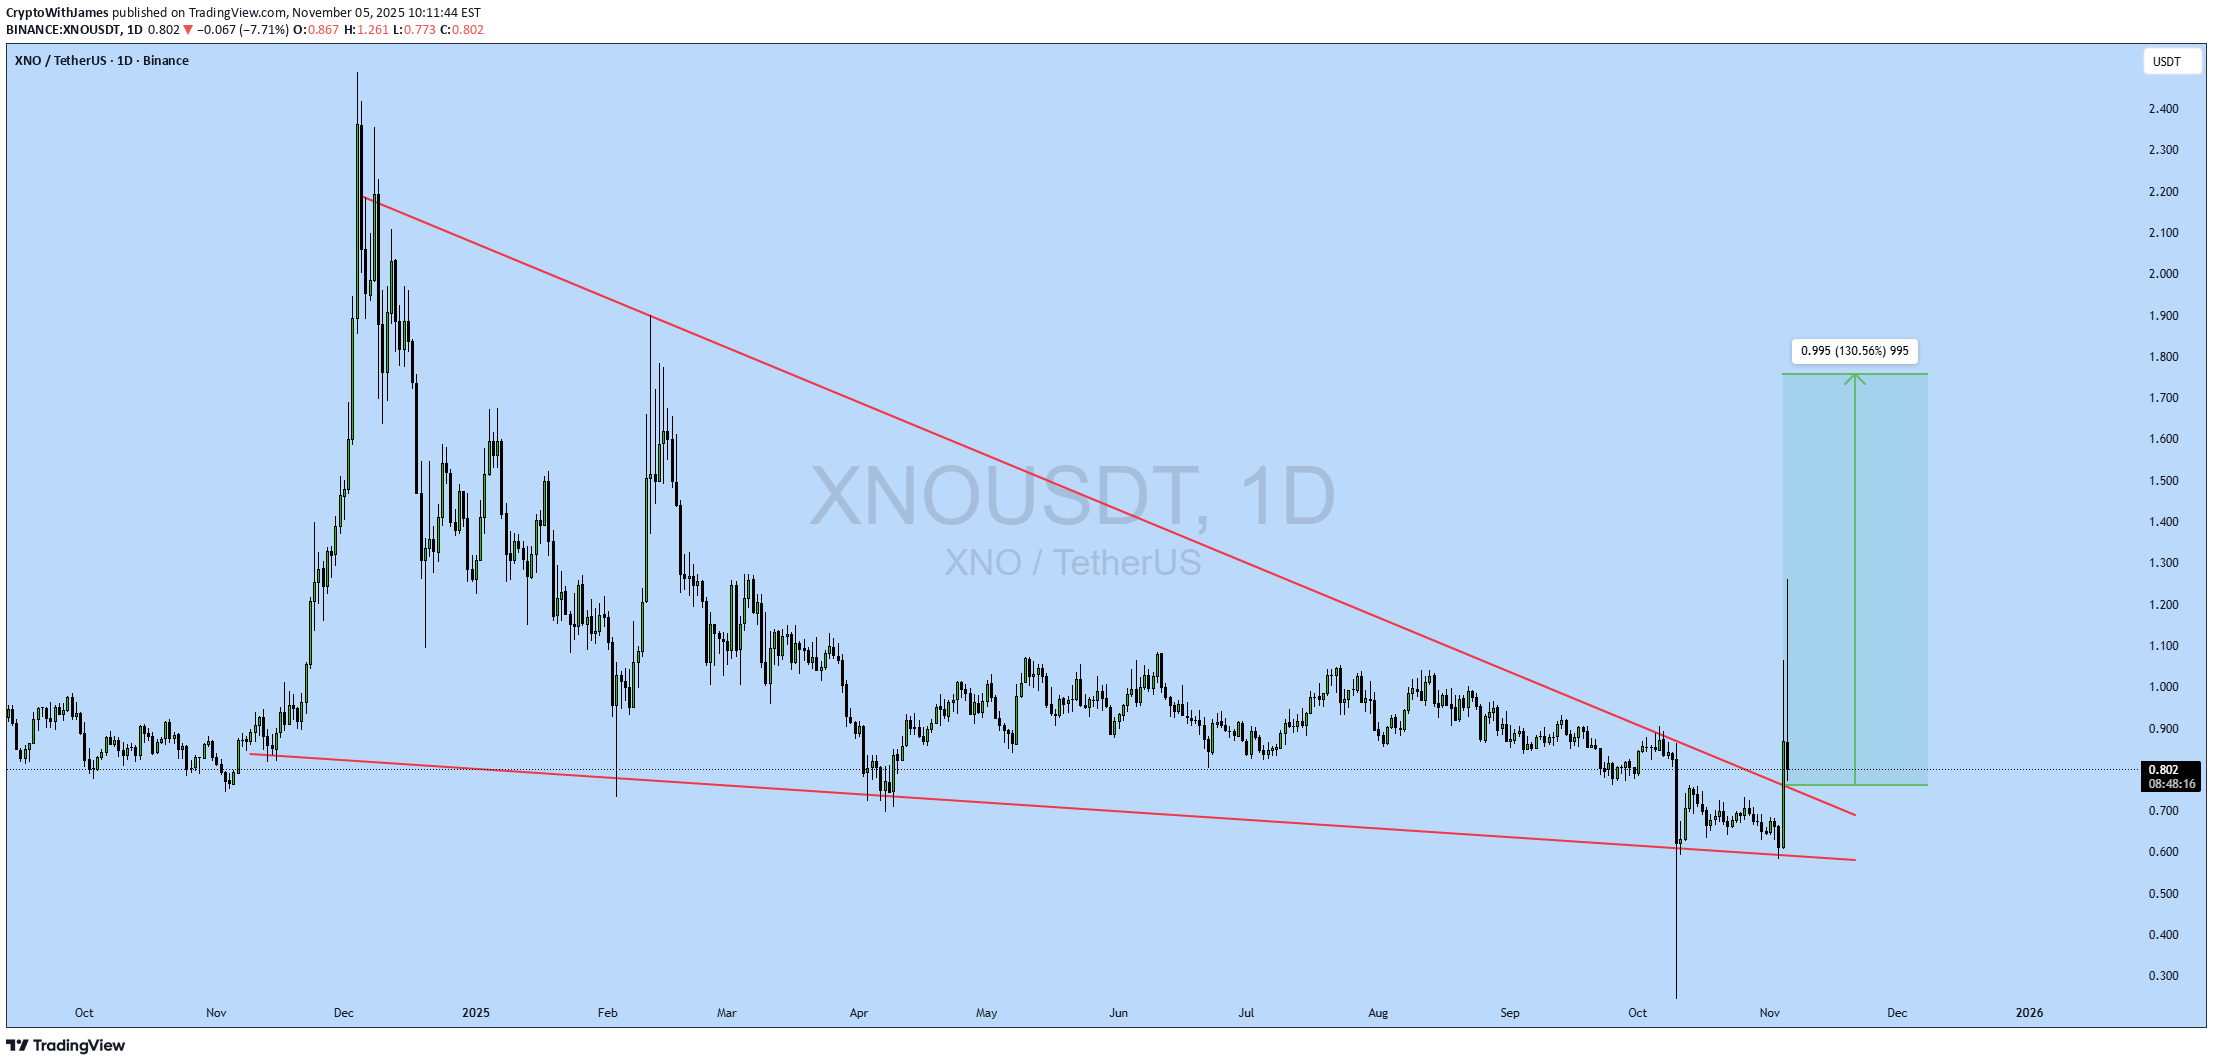
#XNO UPDATE XNOUSDT Technical Setup Pattern: Falling Wedge Breakout Current Price: $0.809 Target Price: $1.995 Target % Gain: 130.56% Technical Analysis: XNO has broken out of a falling wedge pattern on the 1D chart, indicating strong bullish momentum. Volume is picking up, and the price has surged above key resistance levels, confirming the breakout. Time Frame: 1D Risk Management Tip: Always use proper risk management.

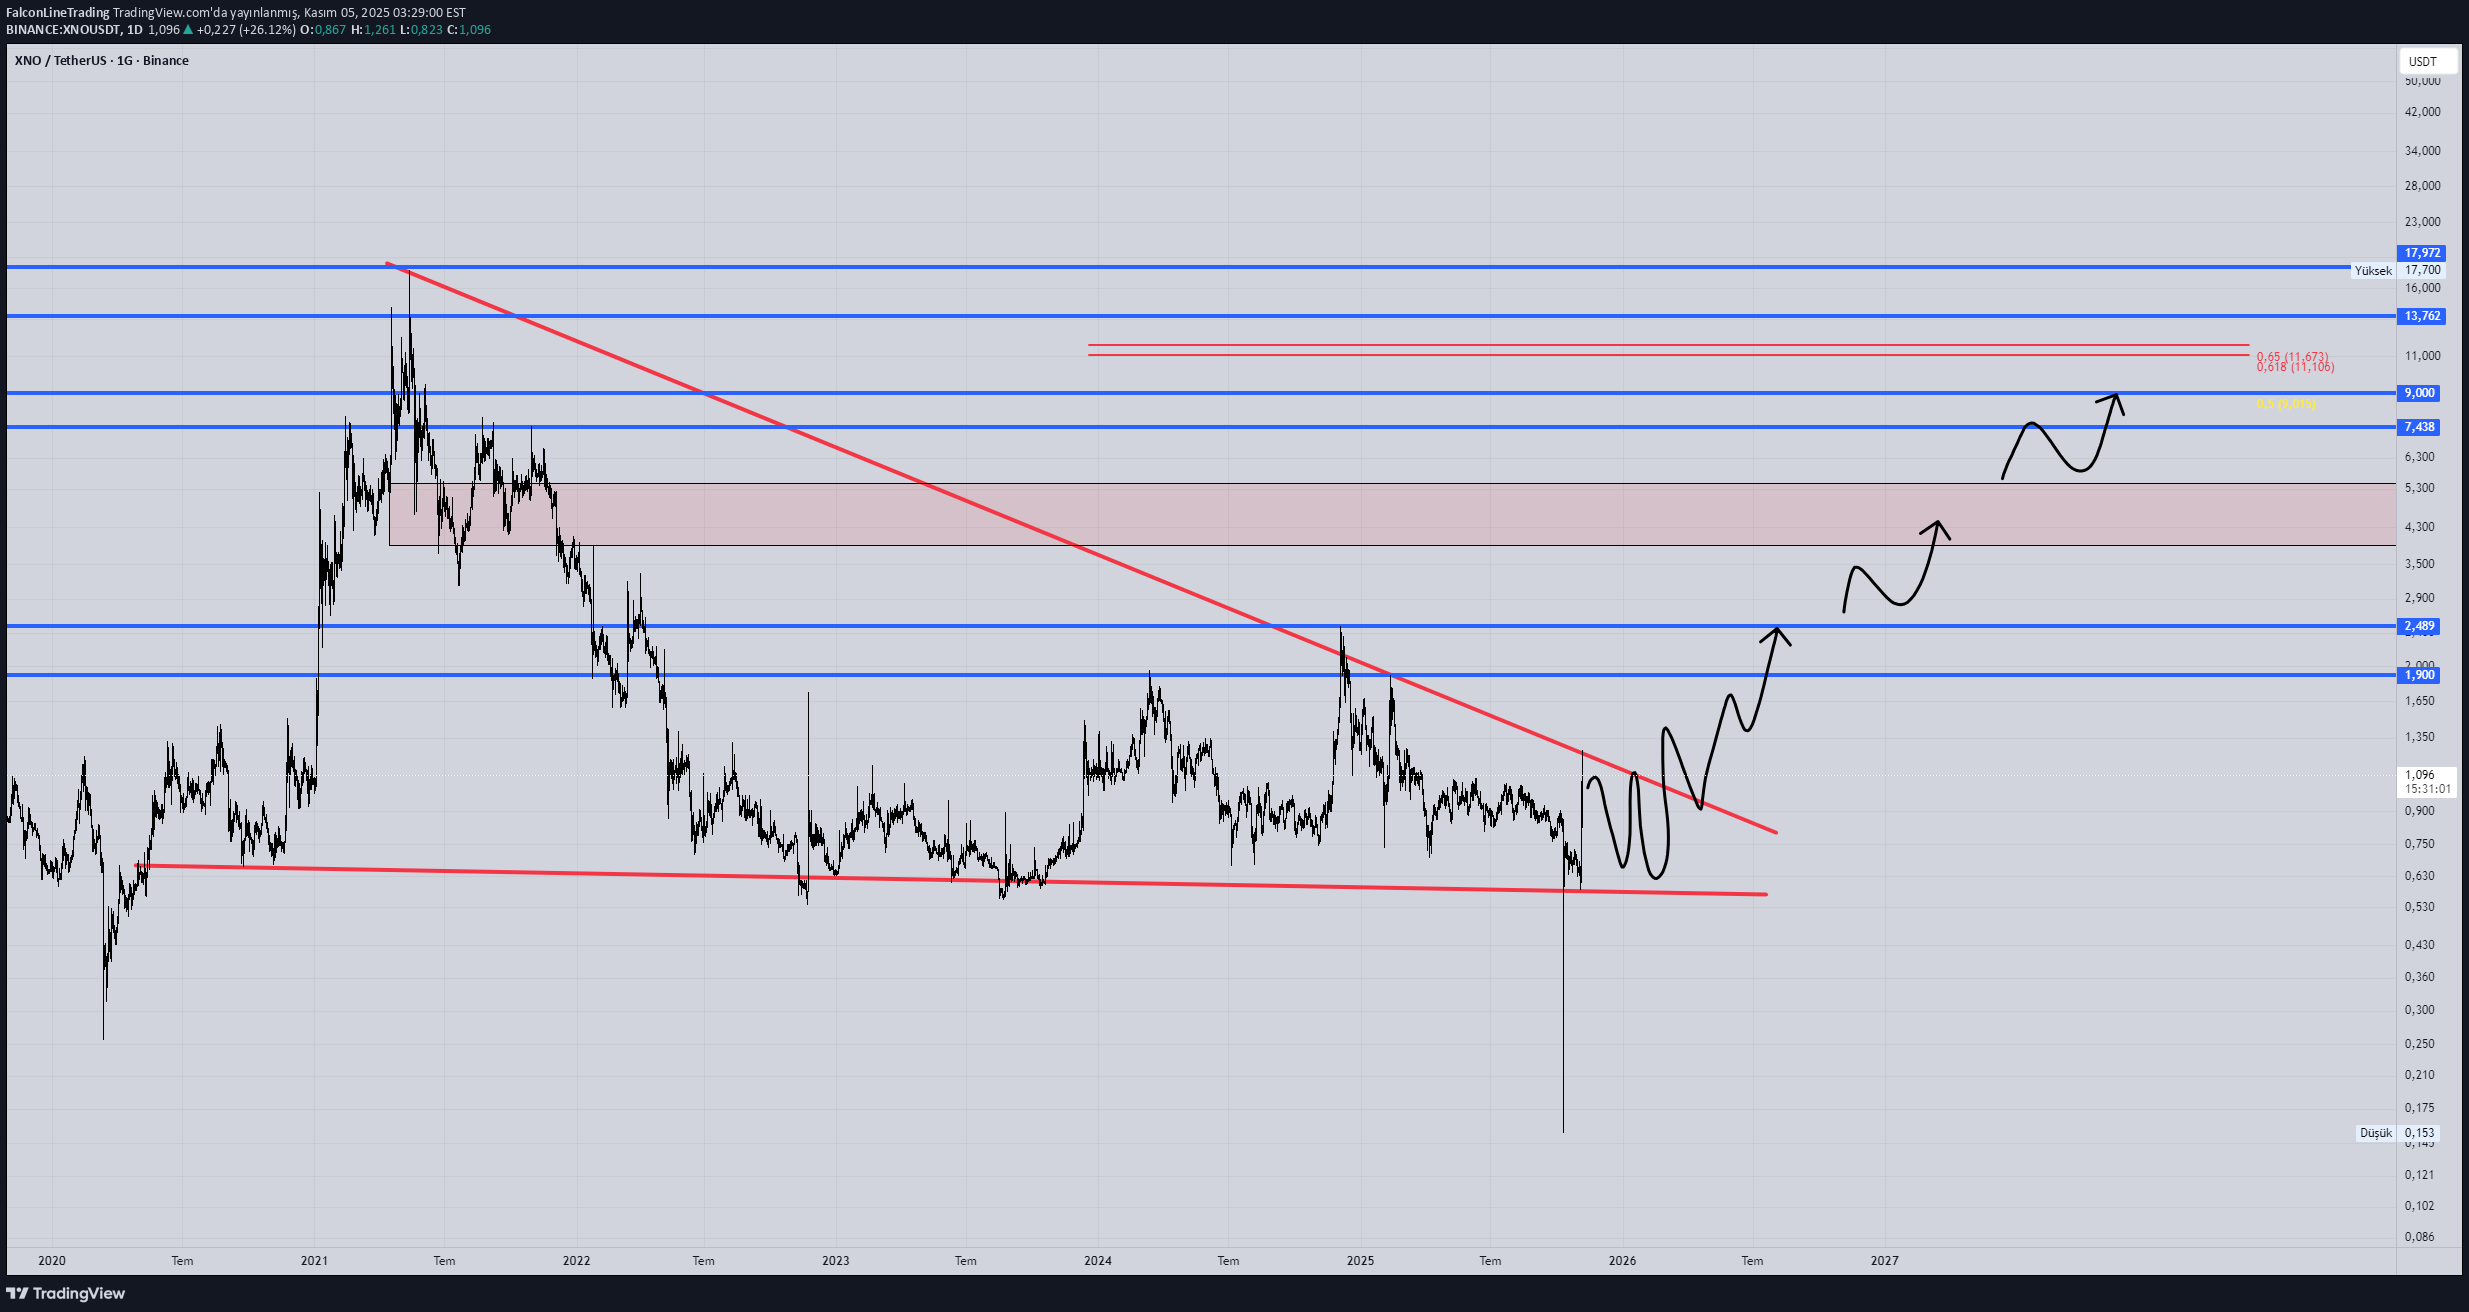
FalconLineTrading

UmutTrades
XNOUSDT - BOUGHT THE DIP, SOLD THE TOP, NOW WHAT ?
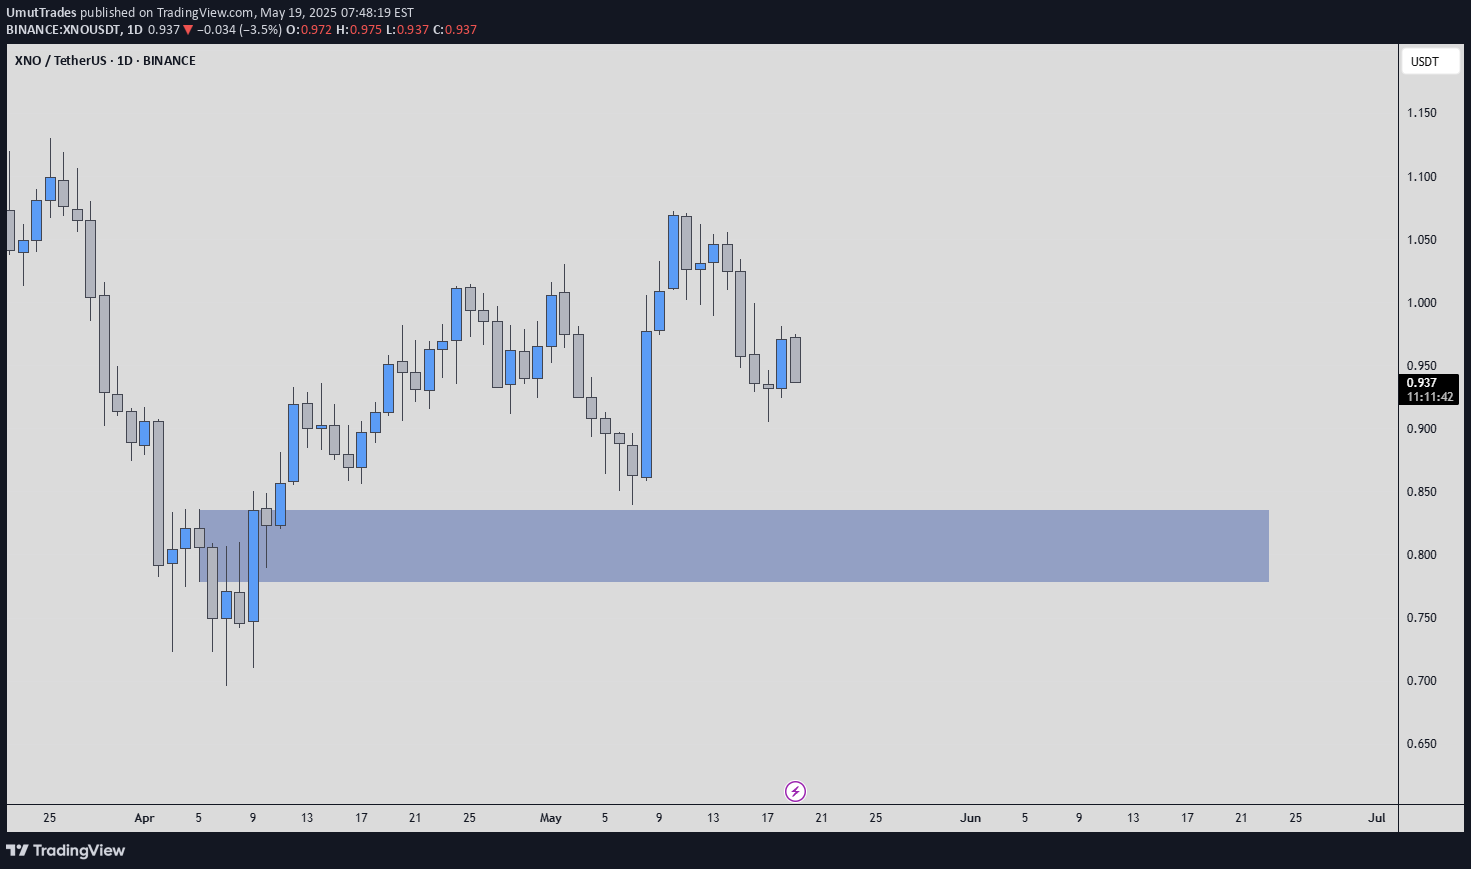
What we have done before in XNO is already history, first of all, we gave an 80% rise ( tradingview.com/chart/XNOUSDT/JVHKeRc5-XNOUSDT-Analysis-Volume-Spike-with-a-Promising-Blue-Box-Entry/) and then a 40% fall ( tradingview.com/chart/XNOUSDT/MjECAMSx-XNOUSDT-The-Market-Moves-We-React/) with incredible accuracy. Now when I look at the price, I see neither an increase nor a decrease. Yes, the last increase was sold, but not with high volume, and right now there is selling pressure, yes, but not with high volume. I think it is right to wait until the price decides on the direction. It is useful to say that the price gives upward signals even if it does not have a full trend. A selling climax passing with low volume is most likely bullish. That's why I'm approaching bullish and I think long opportunities can be evaluated on 4h upward breakouts. However, although it's too early to say anything about giving a spot entry, I don't think it's wrong to alert the blue box and look for a breakout in the low time frame.%28 profit.

Cryptolistica
XNO 2025 Targets
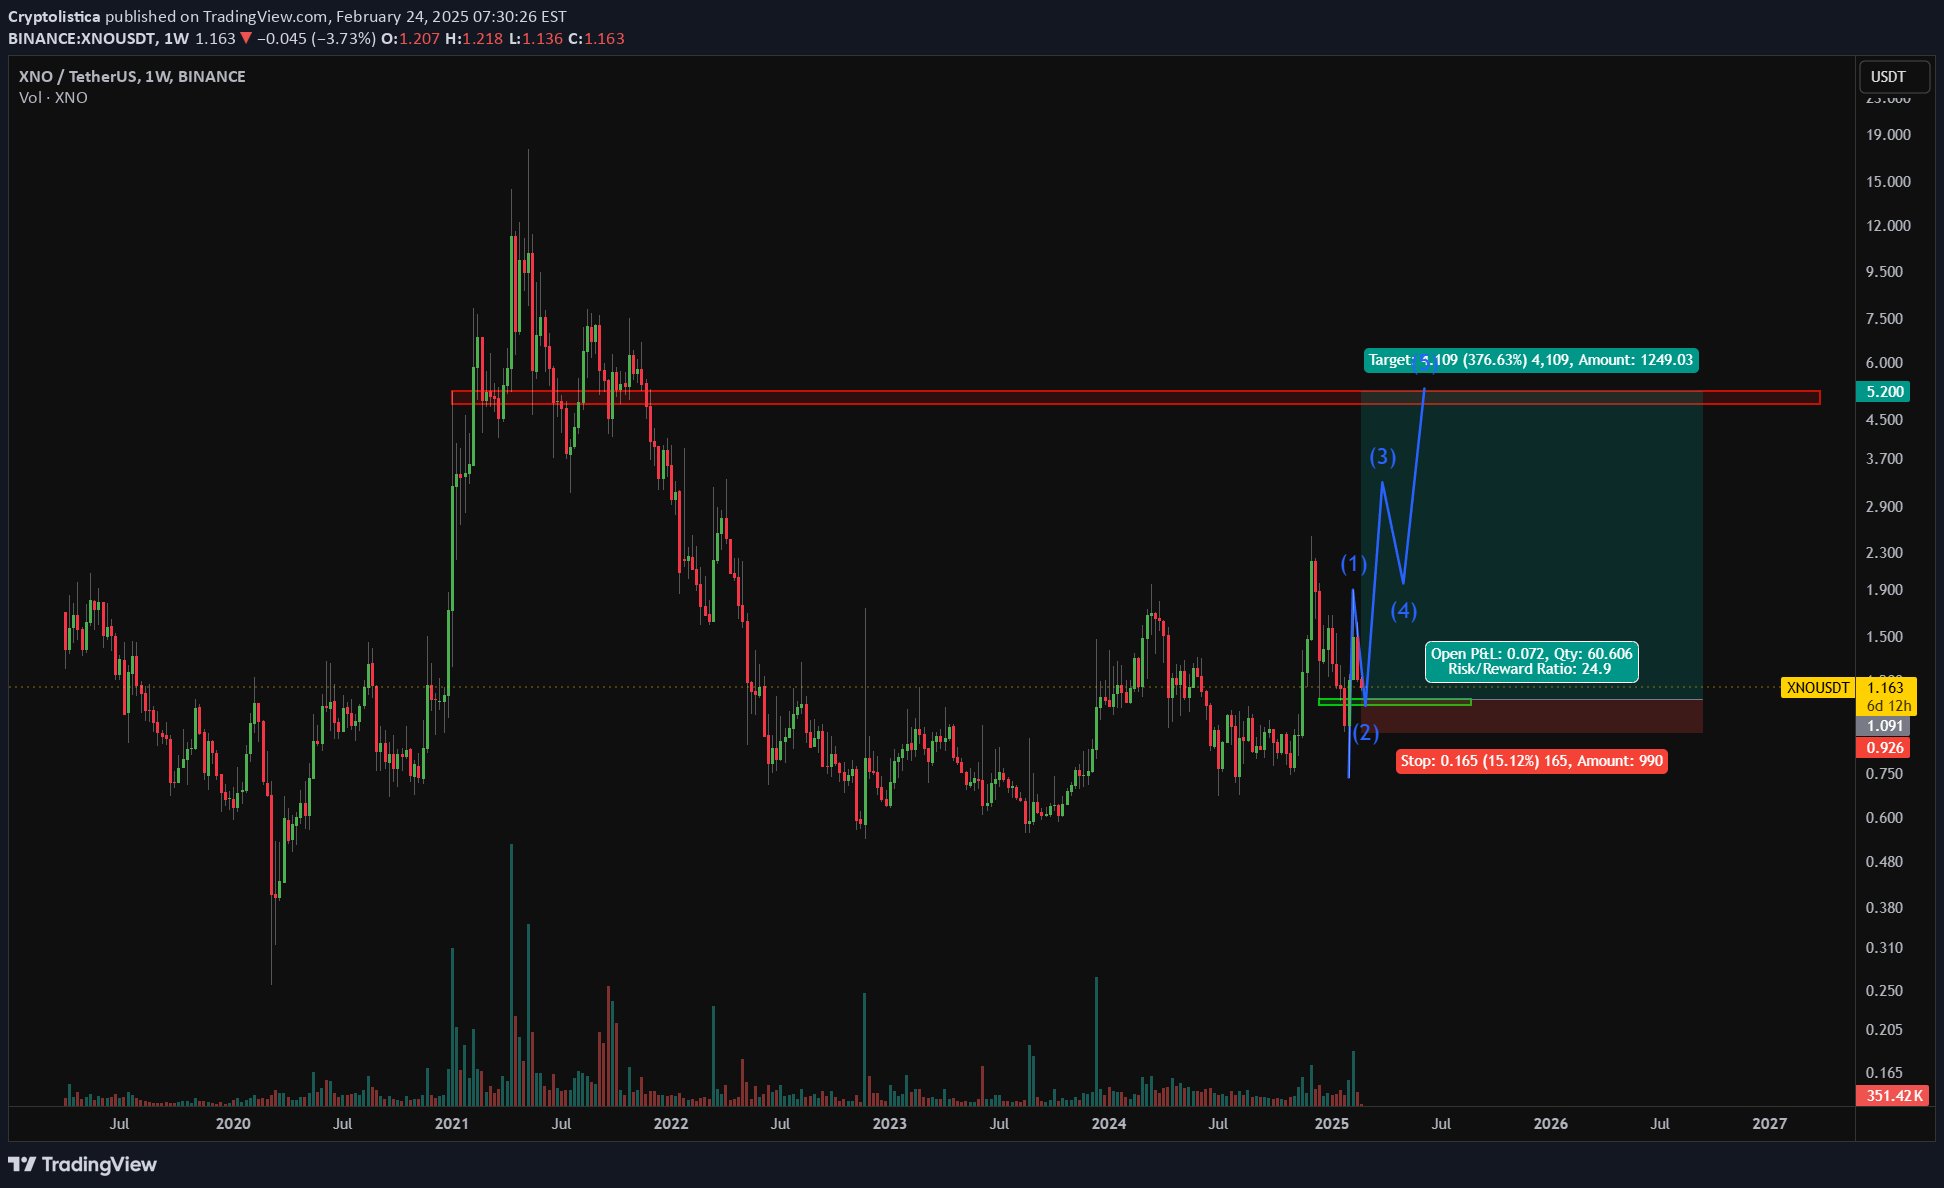
XNO 2025 Targets TP1: 5.0-5.2$ When v.28 is released, sentiment might turn. However, never be too confident and risk more than you can afford to lose as black-swan events can happen anytime.
Cryptolistica
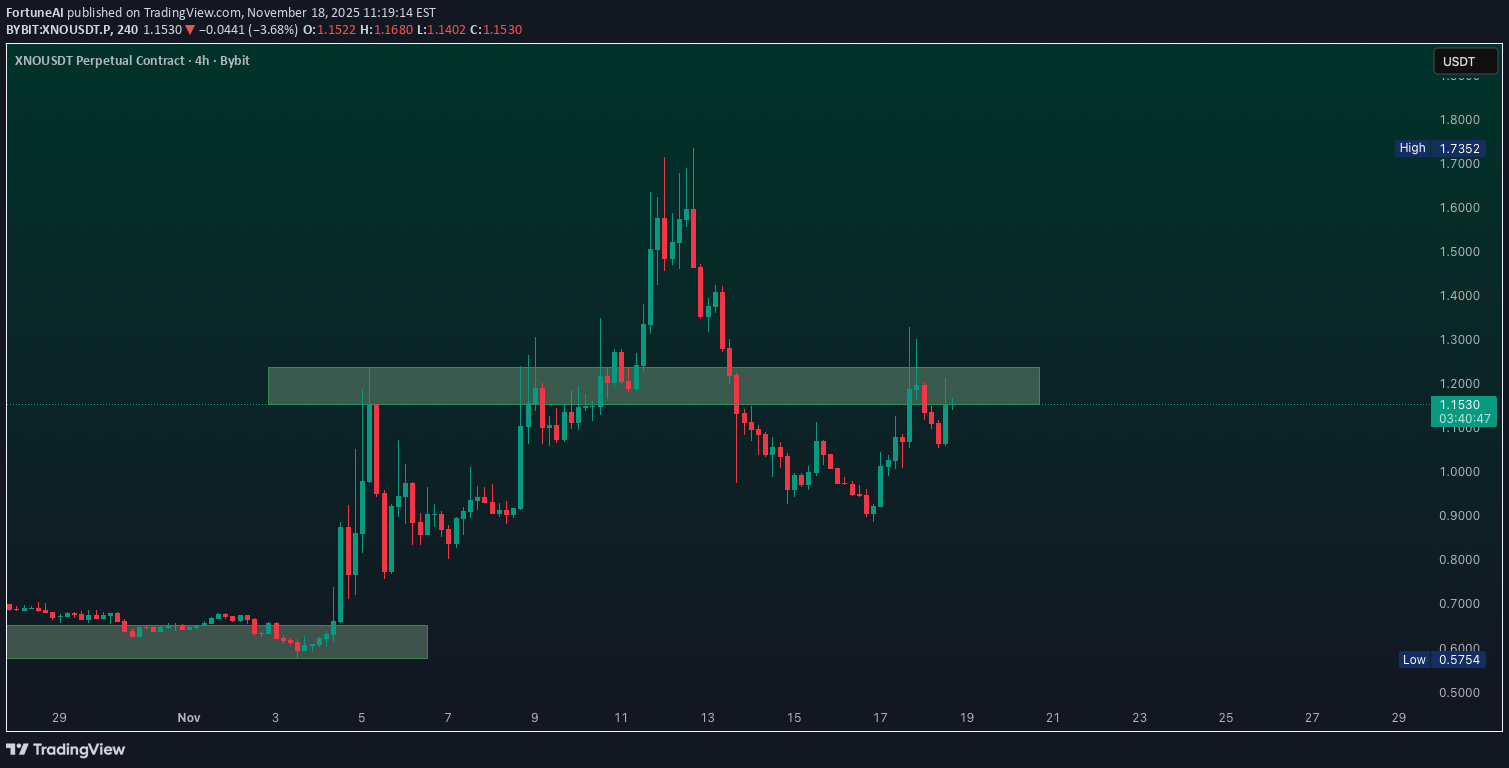
Nano closing above 1.585$ resistance

Nano (XNO) has performed surprisingly well the last week, will the momentum continue? Will the price of 1.585$ turn from resistance into support? Time will tell!
Disclaimer
Any content and materials included in Sahmeto's website and official communication channels are a compilation of personal opinions and analyses and are not binding. They do not constitute any recommendation for buying, selling, entering or exiting the stock market and cryptocurrency market. Also, all news and analyses included in the website and channels are merely republished information from official and unofficial domestic and foreign sources, and it is obvious that users of the said content are responsible for following up and ensuring the authenticity and accuracy of the materials. Therefore, while disclaiming responsibility, it is declared that the responsibility for any decision-making, action, and potential profit and loss in the capital market and cryptocurrency market lies with the trader.