
zainfaraan
@t_zainfaraan

What symbols does the trader recommend buying?
Purchase History
پیام های تریدر
Filter
zainfaraan
شکست خط گردن سر و شانهها: هدف قیمتی ریزش چقدر است؟
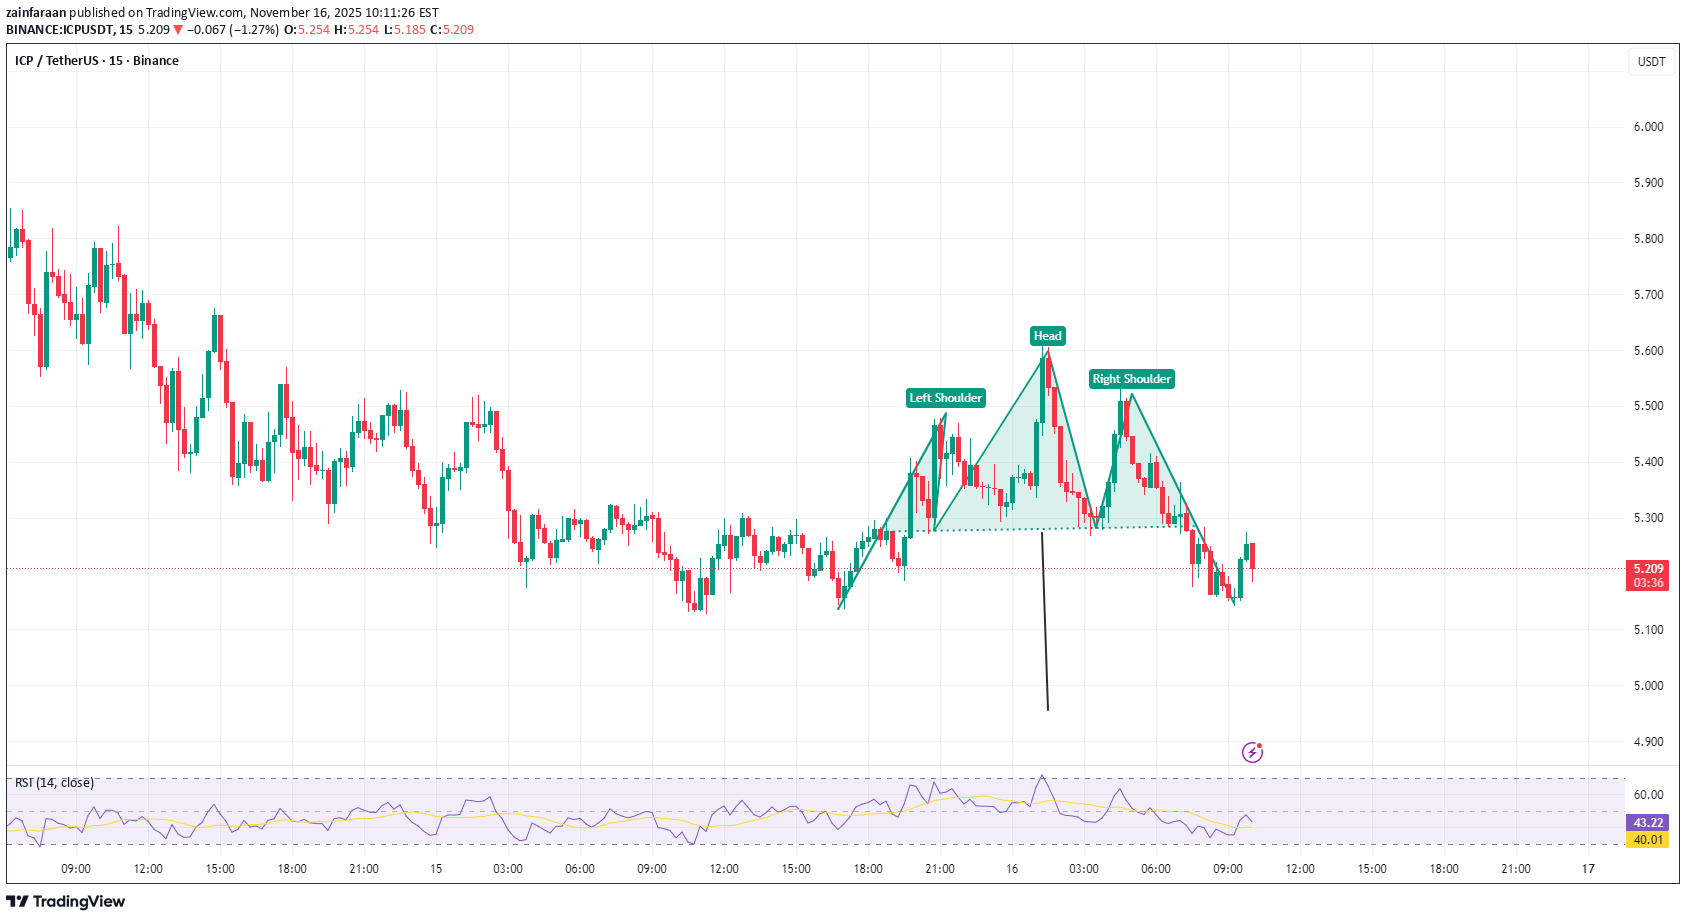
price target for this move based on the pattern's height? The price has clearly broken below the neckline, which is the official signal that the pattern is complete and a bearish trend reversal is underway
zainfaraan
الگوی کانال نزولی: راز ریزش قیمت و سیگنالهای فروش قوی
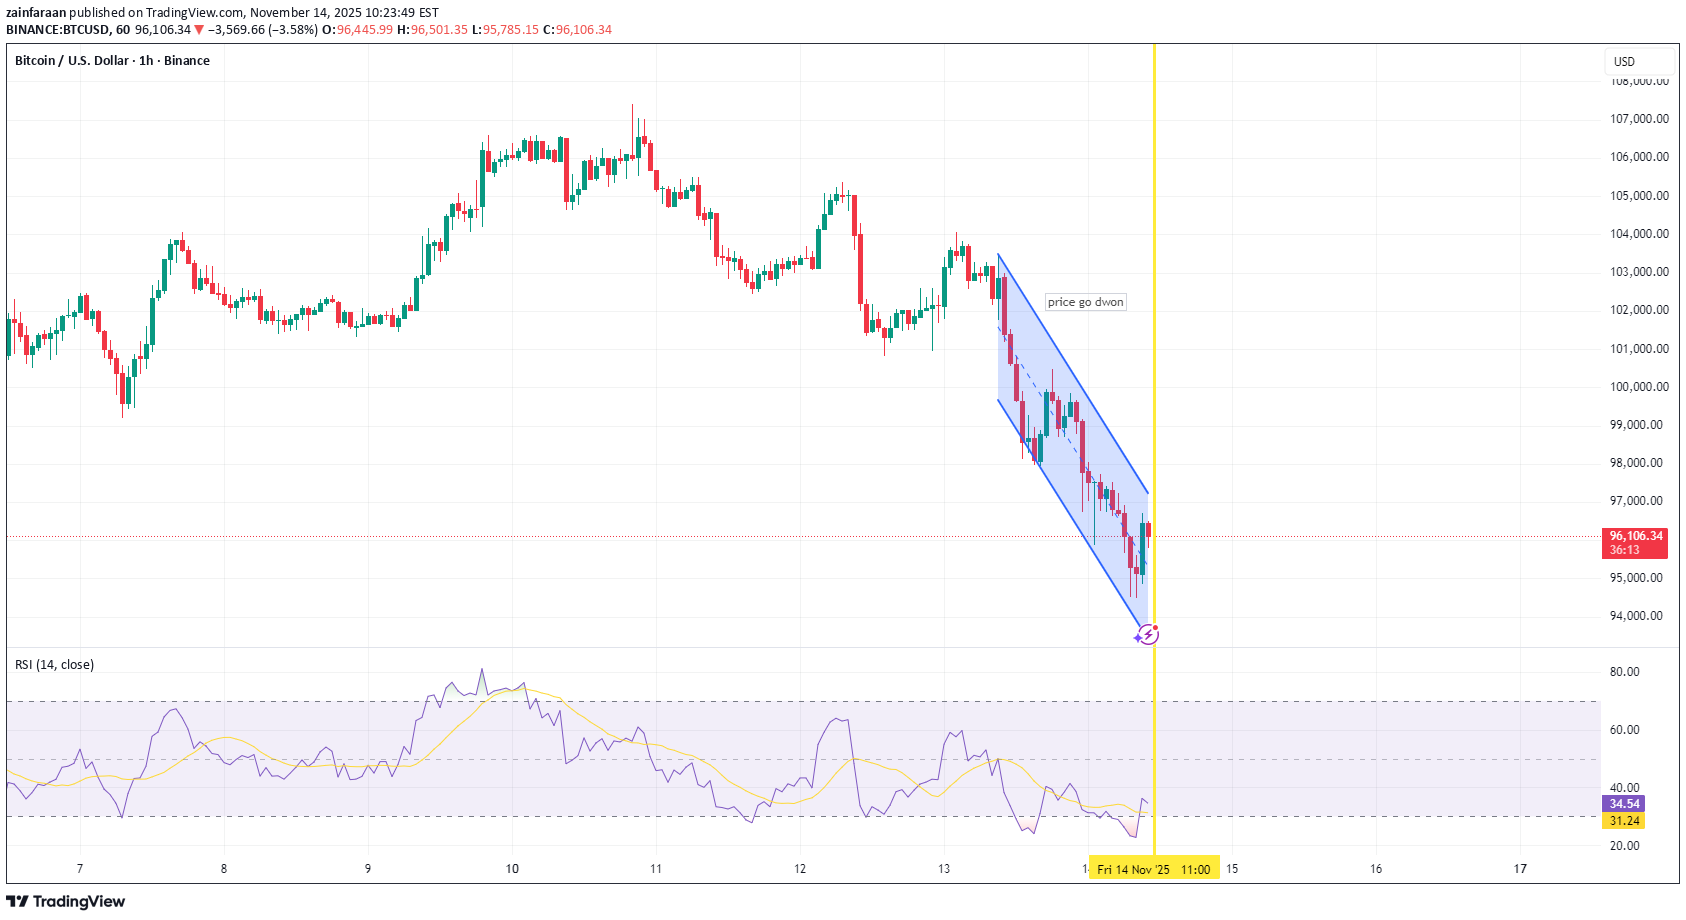
Descending Channel price go down when Descending Channel make mostly price go down rsi d yes lower low make 1 point rsi d yes 1 point Descending Channel 1 point 2 bear point
zainfaraan
آمادگی برای جهش بزرگ: تحلیل تکنیکال صعودی با الگوهای کلیدی
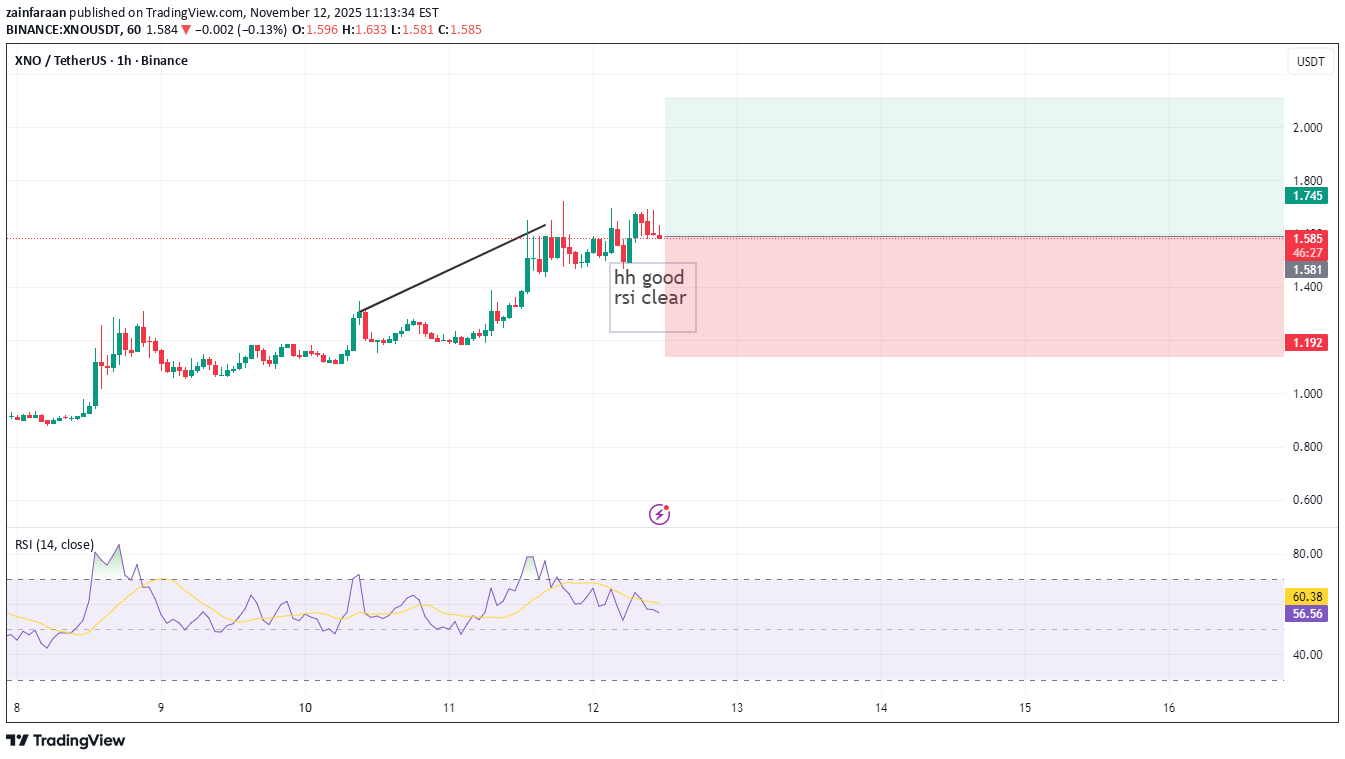
take a stratiest 2 shot list higher high make rsi d clear ascending channel. flag
zainfaraan
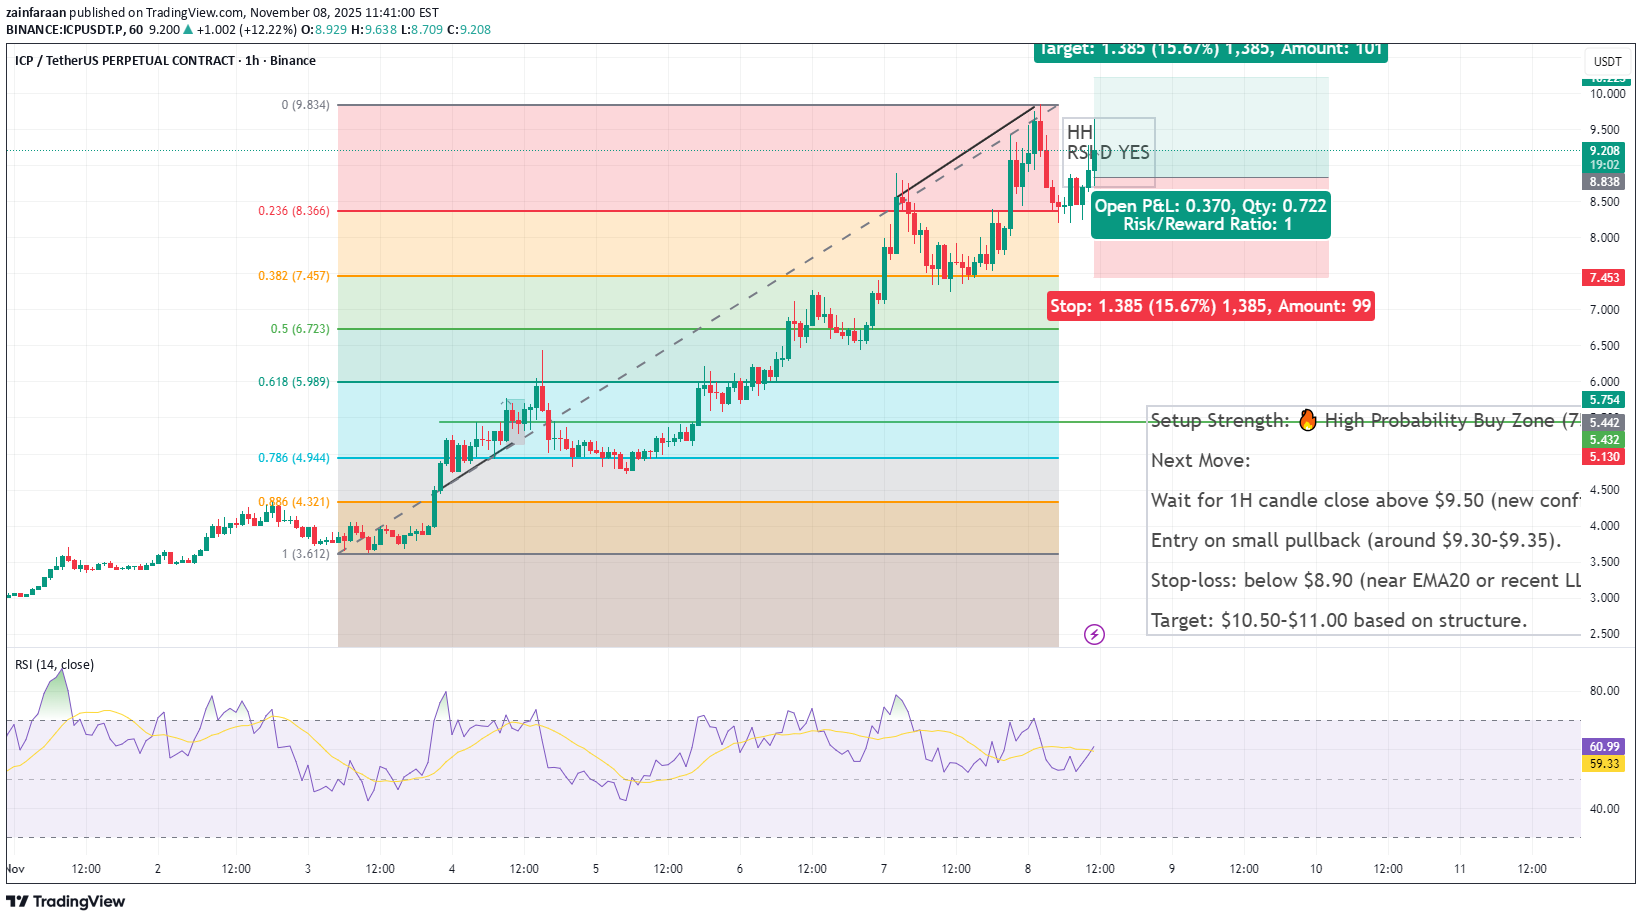
خرید طلایی استراتژی 2: منطقه ورود با احتمال برد 80% برای سود تا 11 دلار!
zainfaraan
بهترین زمان خرید ارز دیجیتال صعودی: استراتژی معامله بر اساس EMA20 و RSI
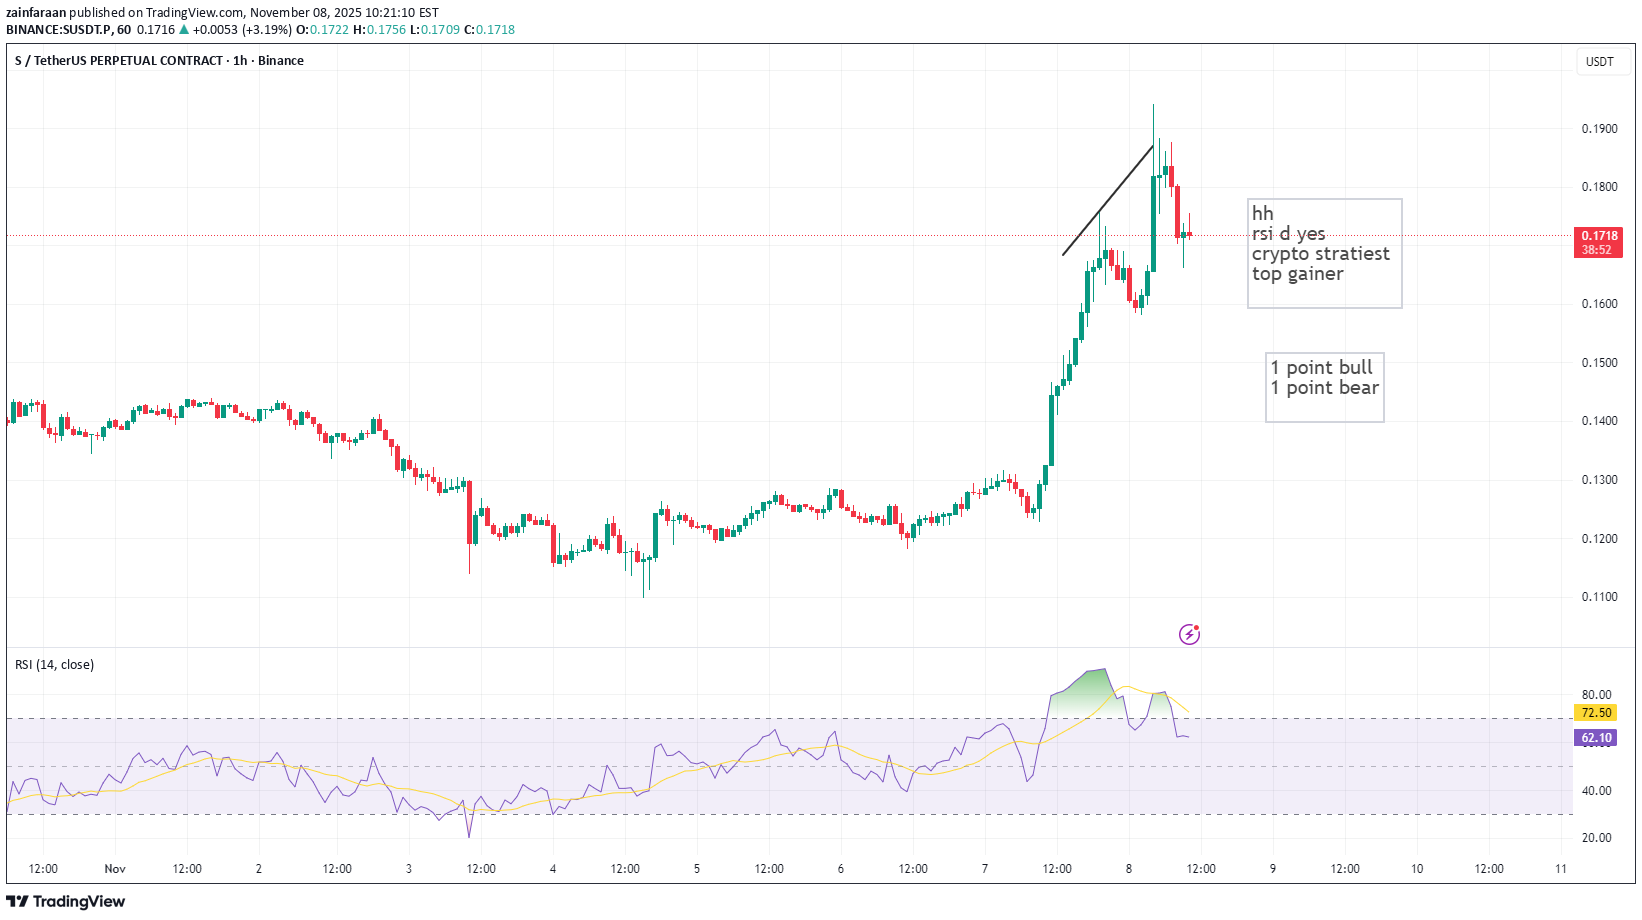
compleat higher high now higher low Ideal Trading Plan StepActionDetails 1Wait for EMA20 retestEntry near 0.160–0.165 (EMA20 zone) after pullback 2Watch RSIIf RSI stays above 50 during retest → confirms trend health 3Confirm candleLook for strong bullish candle off EMA20 4Enter longOnce new HH candle closes above 0.175 5Exit planUse ATR trailing stop or first Lower Low 6Avoid chasingDon’t buy now (after large candle) — wait for dip confirmation Summary Verdict ✅ Trend: Strong ✅ ADX: Powerful (52) ✅ RSI: Strong but extended ⚠️ RSI divergence forming — expect short pullback ➡️ Best move: Wait for EMA20 retest → buy continuation breakout.
zainfaraan
شکست سقف تاریخی: راز ورود به معاملهای با روند صعودی قوی!
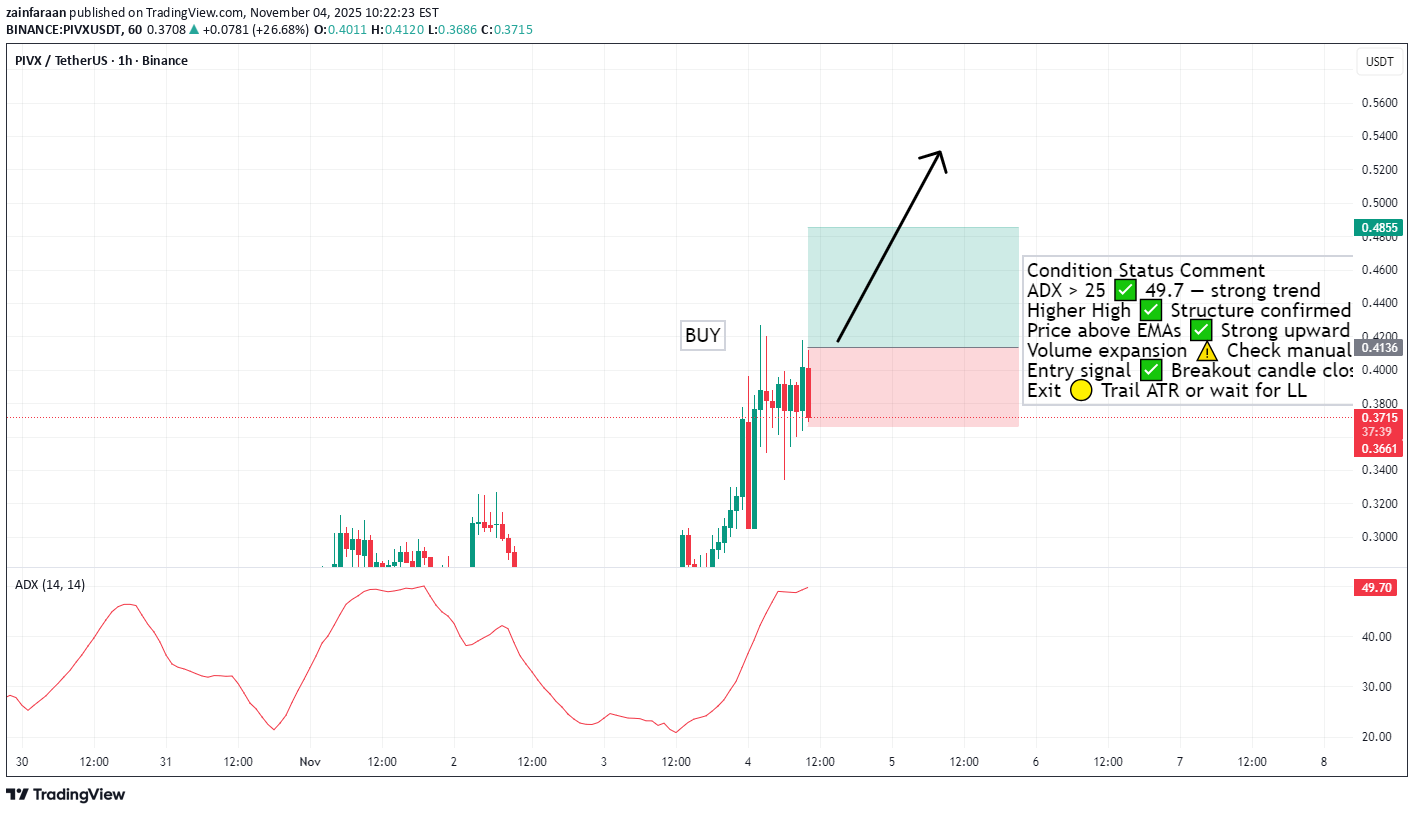
ConditionStatusComment ADX > 25✅49.7 — strong trend Higher High✅Structure confirmed Price above EMAs✅Strong upward move Volume expansion⚠️Check manually Entry signal✅Breakout candle close ExitTrail ATR or wait for LL ✅ 1. ADX Condition ADX = ~49.7 → ✅ Confirmed strong trend (Anything above 25 = strong; above 40 = very strong trend). → ✔ Condition met ✅ 2. Market Structure (Higher High Formation) The chart clearly shows: A Higher Low (HL) formed before the breakout. Price broke above the previous swing high, creating a Higher High (HH). → ✔ Condition met — the structure confirms bullish continuation.
Disclaimer
Any content and materials included in Sahmeto's website and official communication channels are a compilation of personal opinions and analyses and are not binding. They do not constitute any recommendation for buying, selling, entering or exiting the stock market and cryptocurrency market. Also, all news and analyses included in the website and channels are merely republished information from official and unofficial domestic and foreign sources, and it is obvious that users of the said content are responsible for following up and ensuring the authenticity and accuracy of the materials. Therefore, while disclaiming responsibility, it is declared that the responsibility for any decision-making, action, and potential profit and loss in the capital market and cryptocurrency market lies with the trader.