
crypt0_90
@t_crypt0_90

What symbols does the trader recommend buying?
Purchase History
پیام های تریدر
Filter
تحلیل تکنیکال FET: راز موج صعودی جدید و نقطه ورود طلایی!
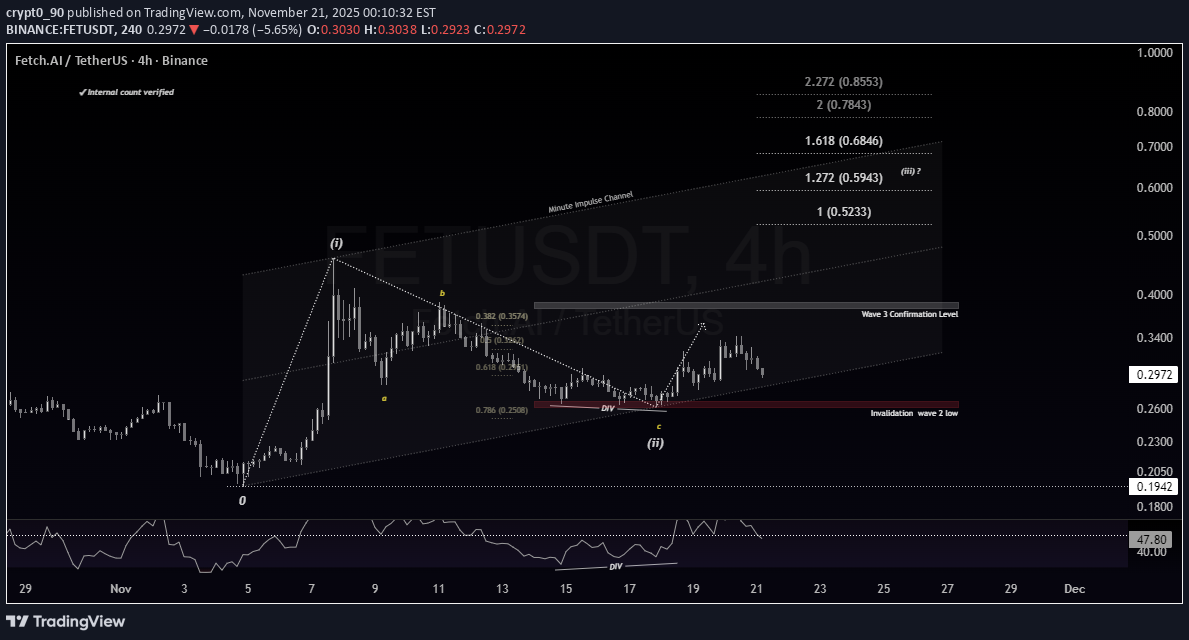
FETUSDT The chart shows a well-defined wave (i) top, followed by an ABC corrective structure that nearly reached the 0.786 retracement. The C-wave formed with a clear RSI bullish divergence, adding confidence that wave (ii) has likely completed. Price is now developing the early stages of wave (iii). A breakout above the confirmation zone would significantly strengthen the bullish scenario. – This is not financial advice.
آغاز موج سوم صعودی ZEN: رمزگشایی ساختار قیمتی 12 ساعته!
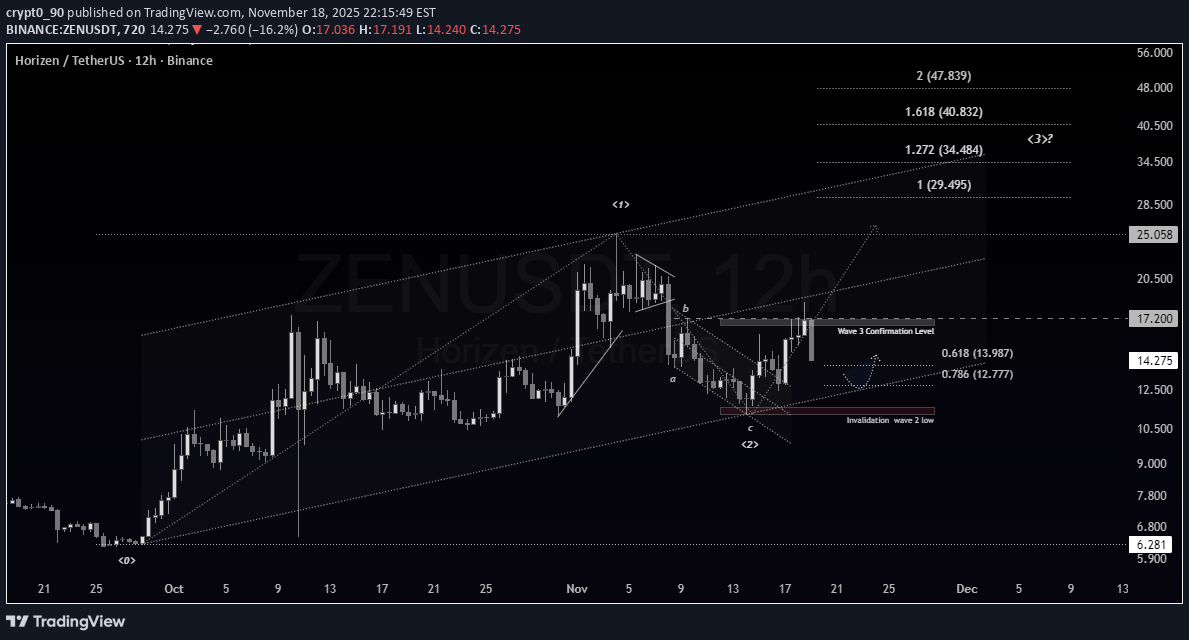
ZENUSDT Higher-timeframe structure suggests a completed 0–1–2 sequence, and price is now beginning Wave 3 development. Shown here on the 12H chart for clearer visualization. - Not financial advice .
ساختار موج 3 ارز XNO: آیا این تازه شروع یک صعود بزرگ است؟
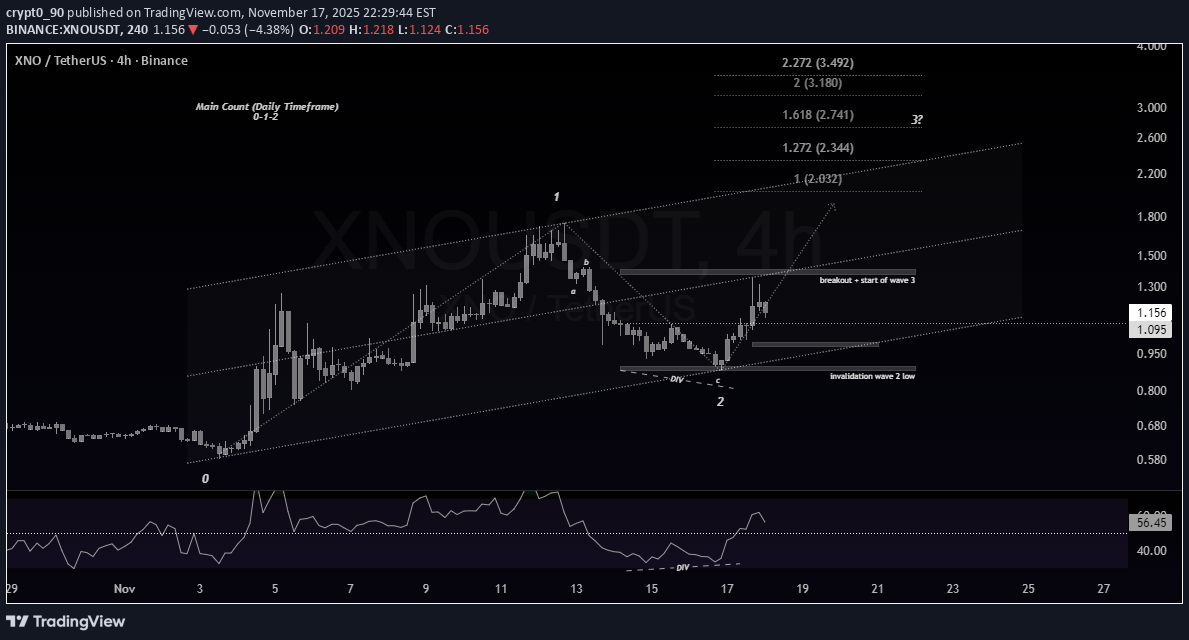
XNOUSDT XNO is forming a clean Elliott Wave structure at the moment. The main wave count is taken from the daily timeframe, where Wave 1 and Wave 2 are already established. On the 4H chart, Wave 2 ended with a clear bullish RSI divergence, and price respected the support zone perfectly. The break above the internal “b-wave” high confirms the early development of Wave 3. As long as price holds above the Wave-2 low, the bullish setup remains valid. I’ll update Wave 3 targets as Wave i unfolds and provides clearer levels. This is a personal wave count, not financial advice.
بیت کوین در یک نقطه عطف مهم: آیا قیمت به سمت 104,000 دلار پرواز میکند یا سقوط میکند؟
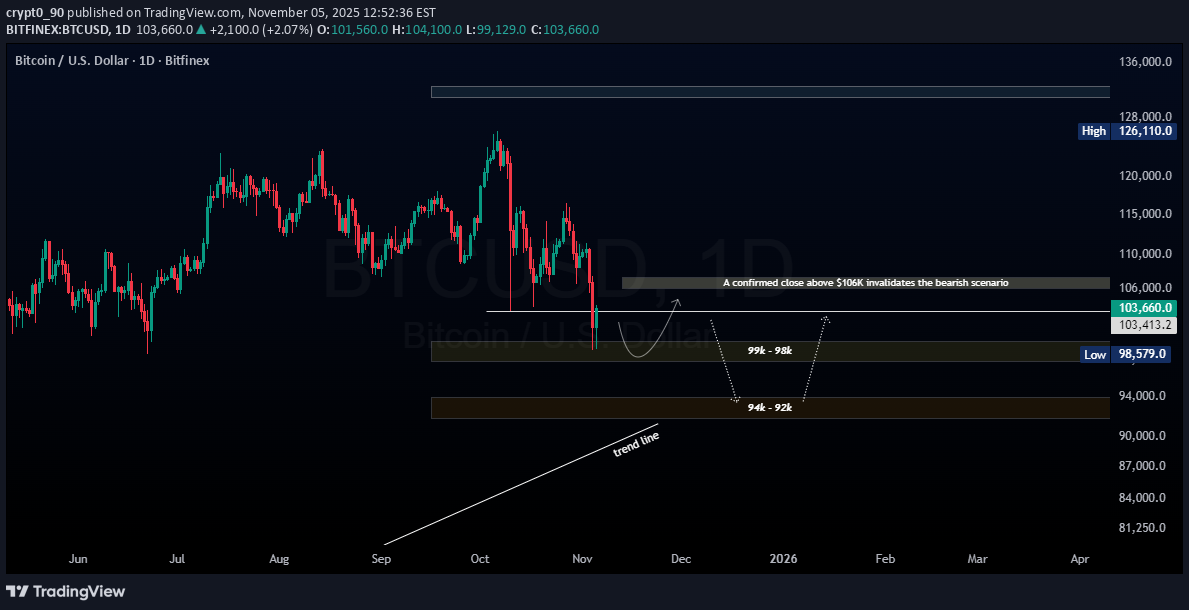
BTCUSD Bitcoin has reacted positively from a major demand zone, showing a clear rejection of further downside pressure. While the selling momentum has weakened, bullish conviction remains limited as buying volume has not yet expanded significantly. A sustained hold above $103,000 may allow price to progress toward the $104,000 resistance—considered a key inflection level for the next directional move. A confirmed breakout above $104,000, supported by strong volume and clear positive momentum, would likely trigger a continuation toward the following upside targets: •$107,000 •$109,000 •$111,000 Such a breakout could also relieve pressure on altcoins, potentially marking the beginning of a new bullish leg and paving the way for Bitcoin to print a final cycle high. On the other hand: •Failure to maintain levels above $104,000 would signal weakness and increase the probability of a retracement back toward $101,000–$98,000. •A breakdown below $98,000 exposes the market to $94,000–$92,000, a strong confluence zone formed by: ✅ extension of a previous corrective wave ✅ significant historical demand ✅ alignment with the ascending trendline originating from the $15,000 low This region is expected to provide a strong bullish reaction, as long as price does not consolidate below it or print weekly closes in that area—an outcome that remains unlikely at this stage. For now, price action within the current levels will determine whether momentum shifts toward continuation or deeper correction. We wait for confirmation. ⏳
APE on monthly chart

APEUSDT On the monthly frame, we have a bounce from the lowest point the price reached with a strong positive divergence, which indicates a significant reversal is coming.Surpassing the areas of $2.1 and $2.6 will be the key to a strong price increase.It will be updated in the event of any new developments. waiting ..
BTC on weekly chart ( cup and handle )

BTCUSD BTCUSD As an overview of Bitcoin on the weekly chart.We have a cup and handle targeting the area at 131,000 and I think this price is the target of this cycle.We also have the neckline zone at the price of 73k and we see that the price is still trading above it until now, so in the event of any other decline, I think the neckline area is the lowest price that will be reached and represents the retest point to start for the new highs. We also note that the price is still above the averages: 50-100-200 and we notice its rebound when it touched the average of 50 Conclusion: Since we are above the 70-73 thousand zone, there is no need to worry because this indicates that the chart is moving in the right direction, but in the event of a break in the 70k zone, this will be the first sign of the beginning of the negative.UPDATE SOON ....
Disclaimer
Any content and materials included in Sahmeto's website and official communication channels are a compilation of personal opinions and analyses and are not binding. They do not constitute any recommendation for buying, selling, entering or exiting the stock market and cryptocurrency market. Also, all news and analyses included in the website and channels are merely republished information from official and unofficial domestic and foreign sources, and it is obvious that users of the said content are responsible for following up and ensuring the authenticity and accuracy of the materials. Therefore, while disclaiming responsibility, it is declared that the responsibility for any decision-making, action, and potential profit and loss in the capital market and cryptocurrency market lies with the trader.