
WAL
Walrus
| تریدر | نوع سیگنال | حد سود/ضرر | زمان انتشار | مشاهده پیام |
|---|---|---|---|---|
No results found. | ||||
Price Chart of Walrus
سود 3 Months :
سیگنالهای Walrus
Filter
Sort messages by
Trader Type
Time Frame

Alpha-GoldFX
سیگنال صعودی بزرگ WALUSDT: چنگال نزولی آماده انفجار ۹۰ درصدی!
WALUSDT is forming a clear falling wedge pattern, a classic bullish reversal signal that often indicates an upcoming breakout. The price has been consolidating within a narrowing range, suggesting that selling pressure is weakening while buyers are beginning to regain control. With consistent volume confirming accumulation at lower levels, the setup hints at a potential bullish breakout soon. The projected move could lead to an impressive gain of around 90% to 100% once the price breaks above the wedge resistance. This falling wedge pattern is typically seen at the end of downtrends or corrective phases, and it represents a potential shift in market sentiment from bearish to bullish. Traders closely watching WALUSDT are noting the strengthening momentum as it nears a breakout zone. The good trading volume adds confidence to this pattern, showing that market participants are positioning early in anticipation of a reversal. Investors’ growing interest in WALUSDT reflects rising confidence in the project’s long-term fundamentals and current technical strength. If the breakout confirms with sustained volume, this could mark the start of a fresh bullish leg. Traders might find this a valuable setup for medium-term gains, especially as the wedge pattern completes and buying momentum accelerates. ✅ Show your support by hitting the like button and ✅ Leaving a comment below! (What is your opinion about this Coin?) Your feedback and engagement keep me inspired to share more insightful market analysis with you!

Mike-BTD
تغییر ساختار والروس (WAL): سیگنال ورود طلایی برای بازگشت روند!

WAL has dropped to lower levels, leaving behind a favorable imbalance in price action. The structure currently forming could offer a setup with a healthy risk-to-reward ratio. A confirmed Change of Character (CHoCH) would be the ideal signal to start building a position and anticipate a potential trend reversal. Ideally, we’d also want to see the total market cap reflect a similar signal for added confluence. Both momentum and trend oscillators are showing signs of divergence — now, all that’s needed is a structural shift to confirm follow-through.
Alpha-GoldFX
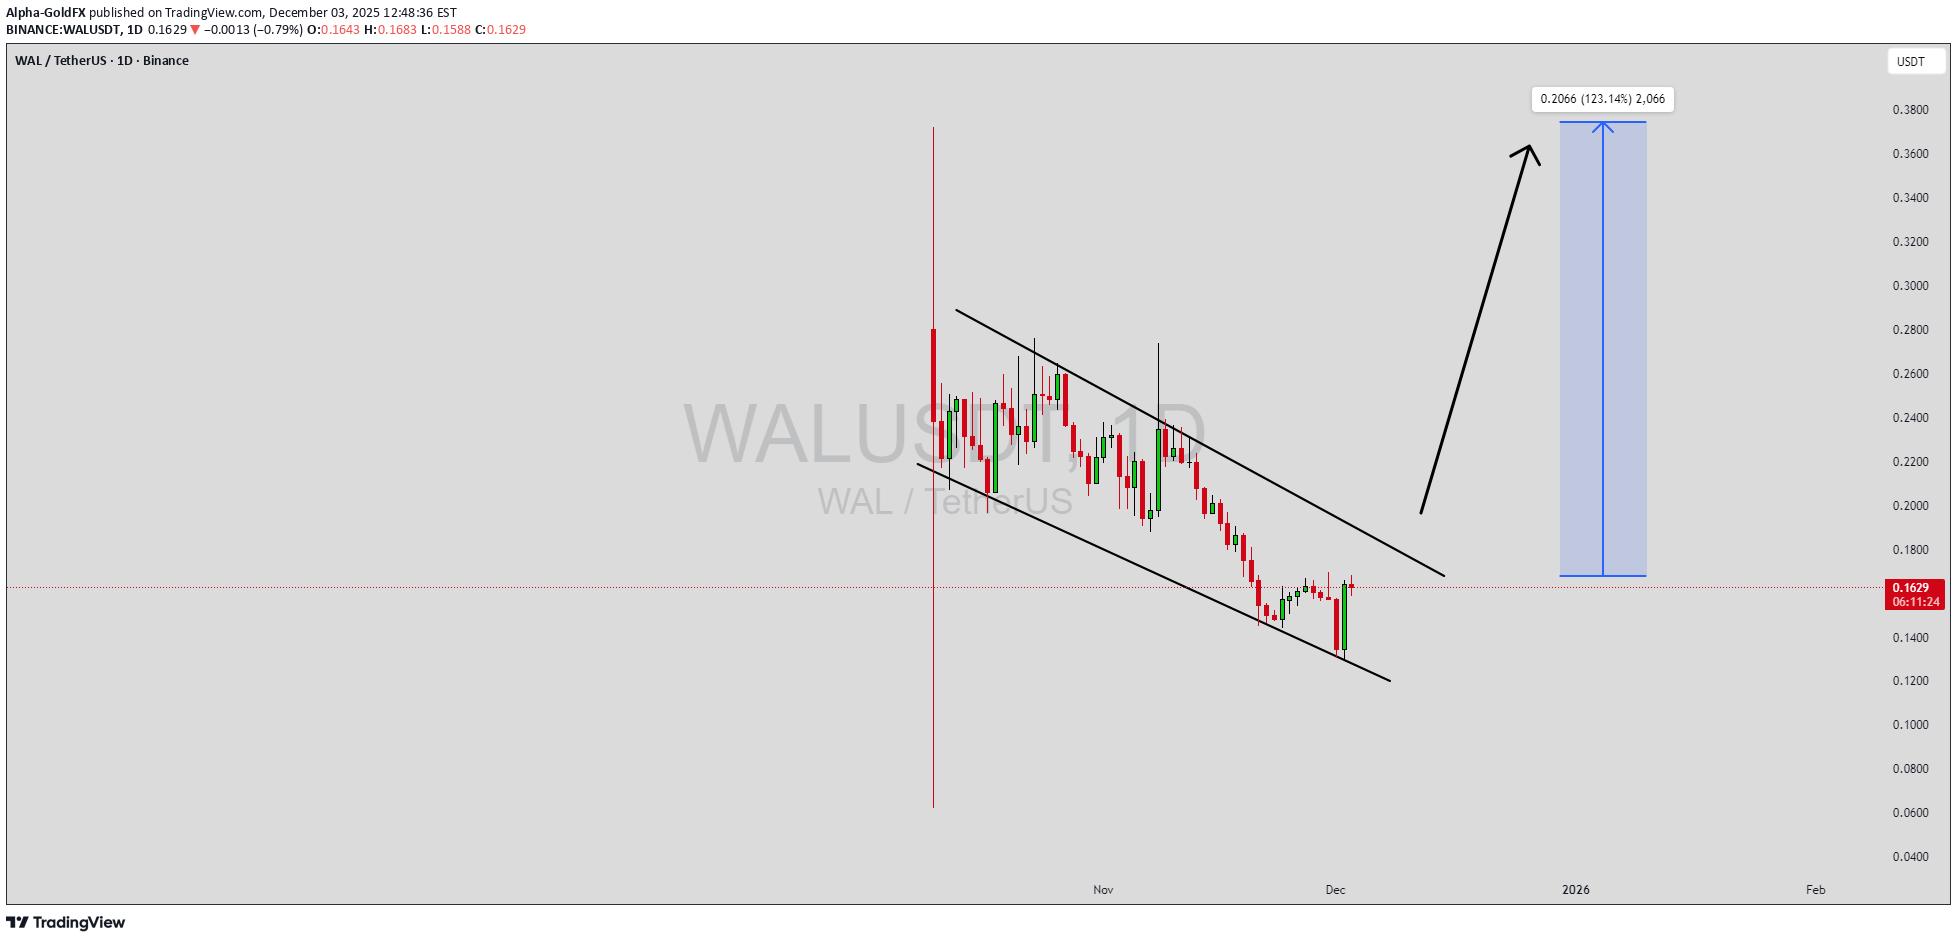
هشدار صعودی بزرگ برای WALUSDT: الگوی گُوِه نزولی نویدبخش جهش 200 درصدی!
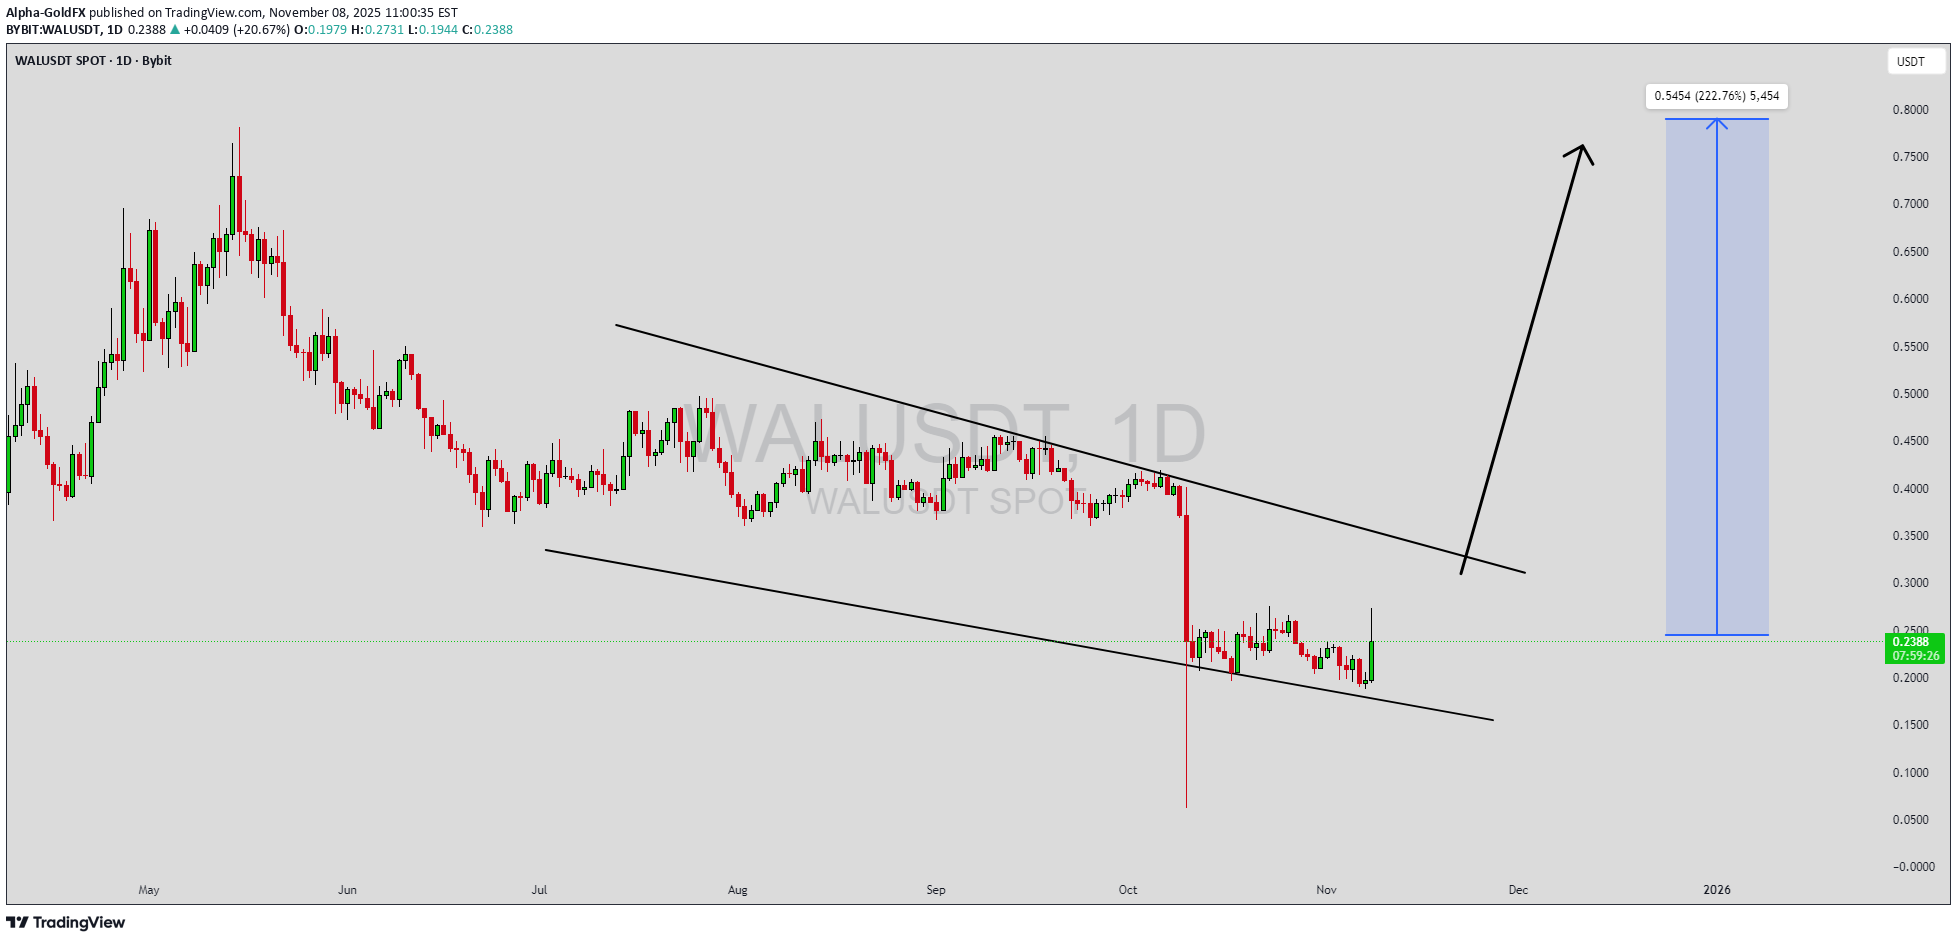
WALUSDT is forming a clear falling wedge pattern, a classic bullish reversal signal that often indicates an upcoming breakout in crypto trading pairs like this one. The price has been consolidating within a narrowing range after recent dips to the multi-year support zone around $0.19-$0.20, suggesting that selling pressure is weakening while buyers are beginning to regain control near key levels like $0.1924. With good volume confirming accumulation at these lower levels amid a 57% surge in 24-hour trading to over $64 million and staking rewards drawing inflows, the setup hints at a potential bullish breakout soon, especially as Walrus's decentralized storage innovations and Sui ecosystem integrations fuel renewed momentum. The projected move could lead to an impressive gain of 190% to 200%+ once the price breaks above the wedge resistance, targeting zones up to $0.57-$0.60 and beyond in this altcoin price action. This falling wedge pattern is typically seen at the end of downtrends or corrective phases, and it represents a potential shift in market sentiment from bearish to bullish for WALUSDT. Traders closely watching this crypto pair are noting the strengthening momentum as it nears a breakout zone around $0.21-$0.25, with technical indicators like RSI showing oversold bounces and fib retracement levels holding firm on the 4H and daily charts. The good trading volume adds confidence to this pattern, showing that market participants are positioning early in anticipation of a reversal, particularly with recent 11% weekly gains and node committee staking signaling ecosystem growth despite a -10% dip over seven days. Investors’ growing interest in WALUSDT reflects rising confidence in the project’s long-term fundamentals, including its scalable blob storage for AI data and cross-chain compatibility, alongside current technical strength in this falling wedge setup. As of November 2025, trading activity spikes on Binance and community hype underscore real demand, making this a high-conviction opportunity for those hunting bullish reversal patterns in altcoins. If the breakout confirms with sustained volume, this could mark the start of a fresh bullish leg, with projections eyeing $0.50+ for substantial medium-term gains as buying momentum accelerates in the broader crypto recovery. ✅ Show your support by hitting the like button and ✅ Leaving a comment below! (What is You opinion about this Coin) Your feedback and engagement keep me inspired to share more insightful market analysis with you!

Bithereum_io
وال (WAL/USDT) در مسیر صعودی جدید؟ اهداف بزرگ بعد از شکست مقاومت ابر ایچیموکو!
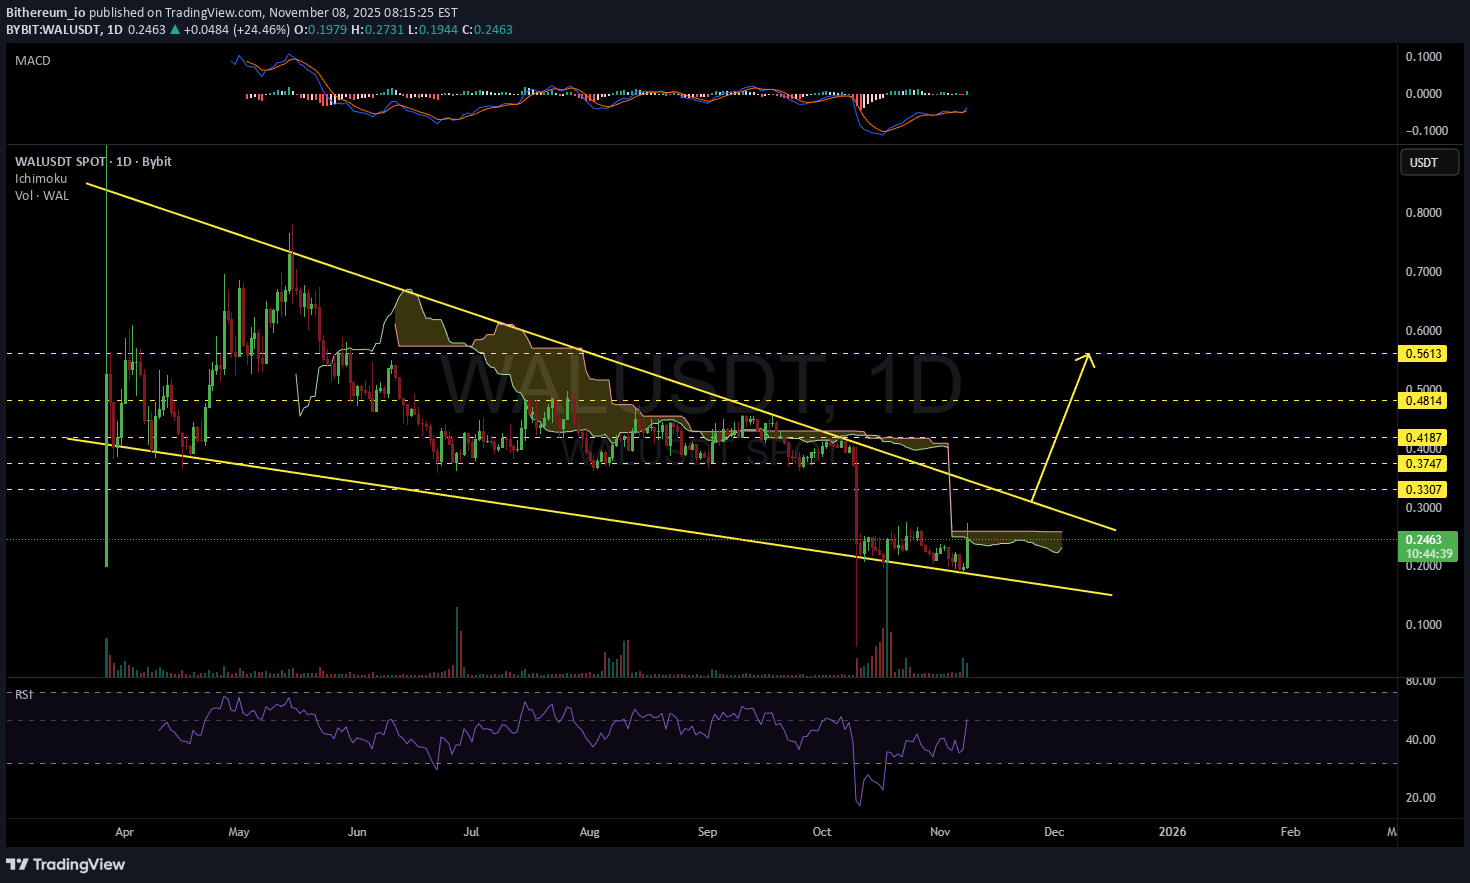
#WAL is currently trading within a falling wedge pattern on the daily chart and has perfectly bounced off the wedge support line. It’s now facing resistance from the Ichimoku cloud, which we believe will be broken soon. In case of a breakout above the wedge resistance, the potential upside targets are: 🎯 $0.3307 🎯 $0.3747 🎯 $0.4187 🎯 $0.4814 🎯 $0.5613 ⚠️ Always remember to use a tight stop-loss and maintain proper risk management.

tradecitypro
آیا WALUSDT آماده یک جهش 50 درصدی است؟ تحلیل کلیدی سطوح مهم
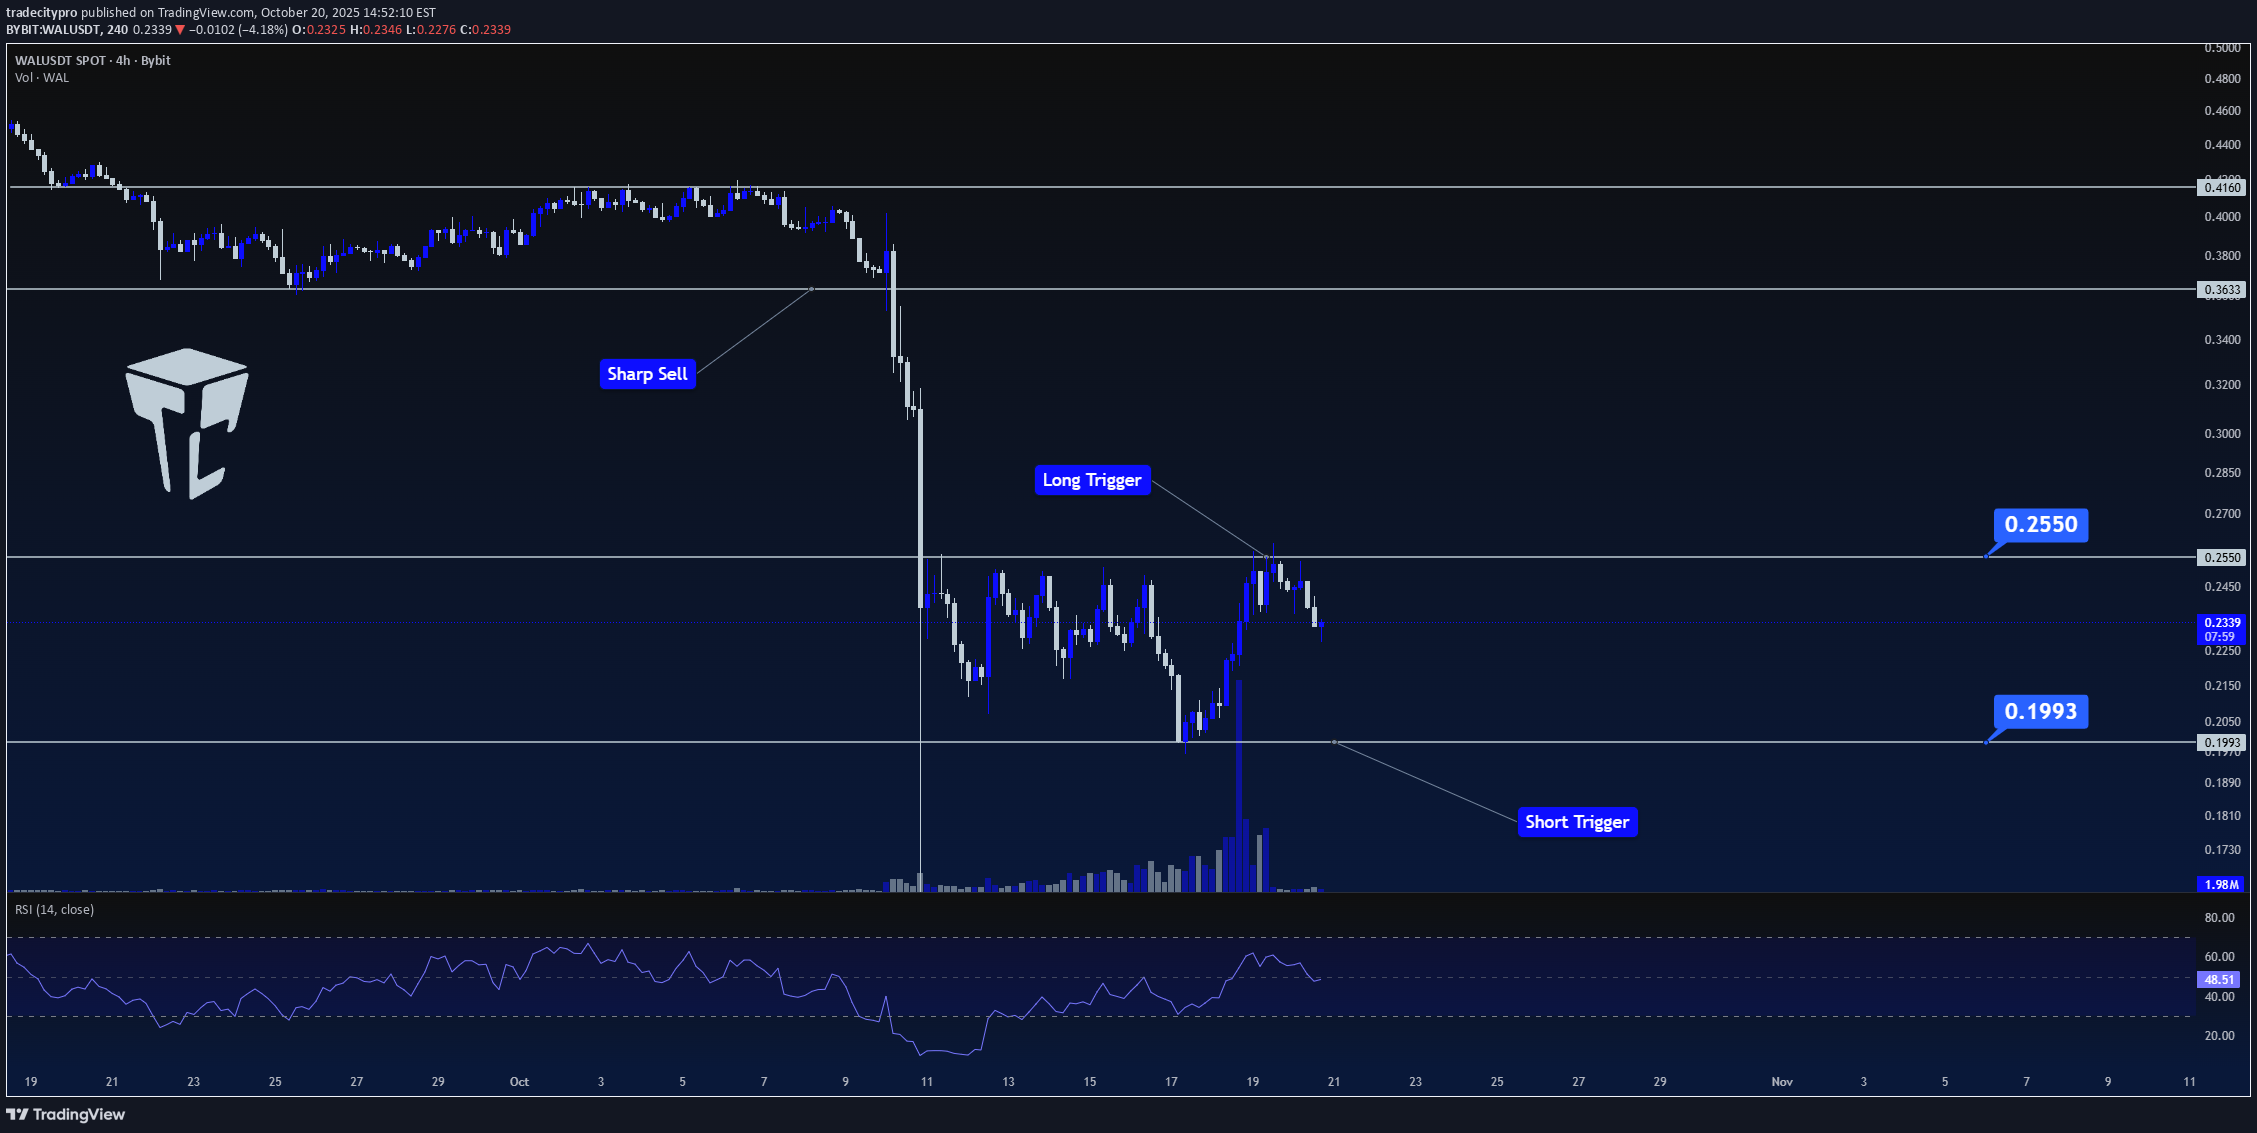
👋 Welcome to TradeCityPro Channel! Let’s take a closer look at the WALUSDT chart on the 4-hour timeframe — a setup that might be preparing for a major move. 🌐 Overview of Bitcoin Before we begin, let me remind you that we’ve moved the Bitcoin analysis section to a separate daily report at your request, so we can go into more detail about Bitcoin’s condition, price action, and dominance: After the sharp breakdown from the 0.3633 level, WAL experienced a strong bearish wave that pushed the price down to a new support zone. Since then, the price has started to accumulate within a clear 4-hour range, suggesting that market participants are waiting for confirmation before the next big move. This accumulation phase is important because such zones often act as the foundation for explosive movements once price breaks out — either upward or downward. 🔹 Bullish scenario (Long setup): If price manages to break above 0.2520 with noticeable volume, it could trigger a strong bullish move. This breakout would signal that buyers have regained control, and we could see a rapid move toward higher resistance zones — potentially offering up to 50% upside from the current range. The key here is volume confirmation — without it, the breakout could turn into a fake-out. 🔹 Bearish scenario (Short setup): On the other hand, the bearish trigger lies at the 0.1993 support. If the price decisively breaks and closes below this level, it would confirm that sellers are in control. However, before opening a short position, we want to see the price retest this zone (a rejection from below) to confirm the breakdown. This would reduce risk and provide a safer entry opportunity. In summary, WALUSDT is currently in a neutral-to-accumulation zone — the breakout direction will define the next strong move. Traders should stay patient, monitor volume closely, and be ready to act once one of these key levels gives way. 📝 Final Thoughts Stay calm, trade wisely, and let's capture the market's best opportunities! This analysis reflects our opinions and is not financial advice.

milad-bit24
آیا WAL/USDT منفجر میشود یا سقوط میکند؟ تحلیل سطوح کلیدی حمایت و مقاومت

The 4-hour chart for WAL/USDT reveals that the asset has experienced significant volatility, characterized by a sharp decline followed by an extended period of consolidation. The price is currently testing a crucial resistance level, suggesting a potential breakout is imminent. Major Support (The Floor): $0.2158 (Green Line). This level has held firm repeatedly, acting as a reliable floor and a probable "demand zone." A breakdown below this point would confirm bearish momentum and likely initiate a further decline. Immediate Resistance (The Barrier): $0.2524 (Lower Red Line). This is the most crucial level right now. Primary Targets (Upper Resistance): $0.2800 (Middle Red Line) and $0.3024 (Upper Red Line). These levels will act as the next key price targets if the $0.2524 resistance is overcome

MoonTradingForecast
تحلیل تکنیکال WAL: سطوح کلیدی و ساختار بازار؛ آماده جهش یا سقوط؟

Western Alliance Bancorporation (WAL) is a regional U.S. bank listed on the NYSE, known for serving commercial and real estate clients across the western states. The company’s fundamentals show stable earnings and moderate growth, though the stock remains sensitive to interest rate policy and financial sector sentiment. In this analysis, we review technical structure, price action, and potential breakout/reversal zones using multi-timeframe confluence, RSI momentum, and volume flow. The chart highlights areas of interest for both short-term and swing perspectives. 📊 Key Focus: Support–Resistance Dynamics, Trend Confirmation, RSI Divergence, and Volume Reaction Zones. ⚠️ Disclaimer: This content is for educational purposes only and does not constitute financial advice. Always perform your own due diligence before making investment decisions. #WAL #WesternAllianceBancorporation #Stocks #TechnicalAnalysis #TradingView #SwingTrading #MarketStructure #PriceAction #VolumeAnalysis #RSI #Breakout #Finance #Investing

CryptoNuclear
WALRUS/USDT – Descending Triangle at Critical Support!

WALRUS/USDT is currently trading within a descending triangle pattern on the daily timeframe. This structure is formed by a series of lower highs pressing from above (descending trendline), while the 0.36–0.40 support zone (yellow box) acts as a major floor below. This highlights strong selling pressure from the top, but at the same time buyers are still holding the support area. The price is now consolidating within a narrowing range, waiting for a decisive breakout that will dictate the next big move. --- Bullish Scenario (Upside Breakout) If WALRUS can break above the descending trendline with a daily close above 0.422–0.452, this descending triangle may flip into a bullish reversal. That would signal buyers regaining control. Bullish Targets: Target 1: 0.485 Target 2: 0.539 Target 3: 0.633 – 0.729 (if momentum continues strongly) Validation: breakout with high volume + successful retest of breakout level as support. --- Bearish Scenario (Downside Breakdown) If WALRUS closes daily below 0.36, the descending triangle will confirm as a bearish continuation. This shows sellers overwhelming buyers at support. Bearish Targets: Target 1: 0.31 – 0.30 Target 2: 0.255 (long-term demand zone) Validation: strong bearish daily close with volume, without quick recovery above 0.36. --- Pattern & Interpretation The descending triangle often acts as a bearish continuation pattern. But in strong support zones, it can turn into a reversal pattern if an upside breakout occurs. WALRUS is at a decision point: the tighter the consolidation, the bigger the potential explosive move once a breakout happens. --- Conclusion Bias: Neutral → Bearish as long as WALRUS remains below the descending trendline. Bullish confirmation: daily close above 0.422–0.452 → potential rally to 0.485 – 0.539. Bearish confirmation: daily close below 0.36 → possible drop to 0.31 and 0.255. Traders should wait for volume-backed breakout confirmation before positioning. WALRUS is now at a make-or-break level: will it bounce or break? --- #WALRUS #WALRUSUSDT #CryptoAnalysis #TechnicalAnalysis #DescendingTriangle #Breakout #SupportResistance #PriceAction
CryptoNuclear
WALUSDT — Breakout or Breakdown? Golden Pocket the Key!

Quick Context: Since May, price has formed a series of lower highs connected by a descending trendline (yellow). Beneath it lies a strong demand zone at 0.406–0.420, aligning with Fibonacci 0.5 (0.419) and 0.618 (0.407) — the golden pocket. Current price is around 0.435, pressing against the trendline and approaching the apex of the pattern. Pattern & Key Levels Main Pattern: Descending Triangle (downward-sloping top, relatively flat base/zone). Theoretically slightly bearish, but since it sits right on the golden pocket with compression, the probability of an impulsive breakout in either direction is high. Major Demand / Support: 0.406–0.420 (golden pocket + base). Immediate Resistance: descending trendline + 0.44–0.46 area. Next resistance targets (yellow dashed lines): 0.484 → 0.542 → 0.674 → 0.732. Downside supports if broken: 0.380 → 0.350 → 0.296. Bullish Scenario 1. Confirmation: Daily close above the trendline and ideally > 0.460 (clear breakout confirmation). 2. Healthy Retest: Pullback to 0.44–0.46 / trendline, now acting as support. 3. Step Targets: T1: 0.484 T2: 0.542 T3: 0.674 T4: 0.732 4. Bullish Invalidation: Daily close back below 0.420; strong invalidation if < 0.406 (loss of golden pocket). Bearish Scenario 1. Rejection: Fails to break 0.44–0.46 / trendline and turns down. 2. Weakness Confirmation: Daily close below 0.406 (loss of base + golden pocket). 3. Downside Targets: S1: 0.380 S2: 0.350 S3: 0.296 4. Bearish Invalidation: Daily close above 0.460 with a successful retest flips bias to bullish. Execution Notes Apex Break: The closer price gets to the apex, the higher the risk of false breaks — always wait for a daily close to confirm. Volume: A valid breakout should be accompanied by increasing volume. Risk Management: Place stops beyond the invalidation zones of your chosen scenario (below 0.406 for breakout longs; above 0.460 for rejection shorts). > Summary: WALUSDT is being squeezed between the descending trendline and golden pocket 0.406–0.420. A daily close above 0.460 could open the path to 0.484/0.542, while a breakdown below 0.406 may trigger a drop towards 0.380–0.350. Not financial advice; purely for educational and technical reference. #WALUSDT #Walrus #CryptoTA #PriceAction #DescendingTriangle #Fibonacci #SupportResistance #Breakout #RiskManagement

Grey_SB
WALRUS

SIDEWAYS then $1 Bullish Divergence's everywhere looks good key support should be departing for new ATH's no return zones almost done with
Disclaimer
Any content and materials included in Sahmeto's website and official communication channels are a compilation of personal opinions and analyses and are not binding. They do not constitute any recommendation for buying, selling, entering or exiting the stock market and cryptocurrency market. Also, all news and analyses included in the website and channels are merely republished information from official and unofficial domestic and foreign sources, and it is obvious that users of the said content are responsible for following up and ensuring the authenticity and accuracy of the materials. Therefore, while disclaiming responsibility, it is declared that the responsibility for any decision-making, action, and potential profit and loss in the capital market and cryptocurrency market lies with the trader.