
milad-bit24
@t_milad-bit24

What symbols does the trader recommend buying?
Purchase History
پیام های تریدر
Filter
milad-bit24
لینک (LINK) در نقطه عطف: آیا ۱۹ دلار دروازه رسیدن به ۲۱ دلار است؟
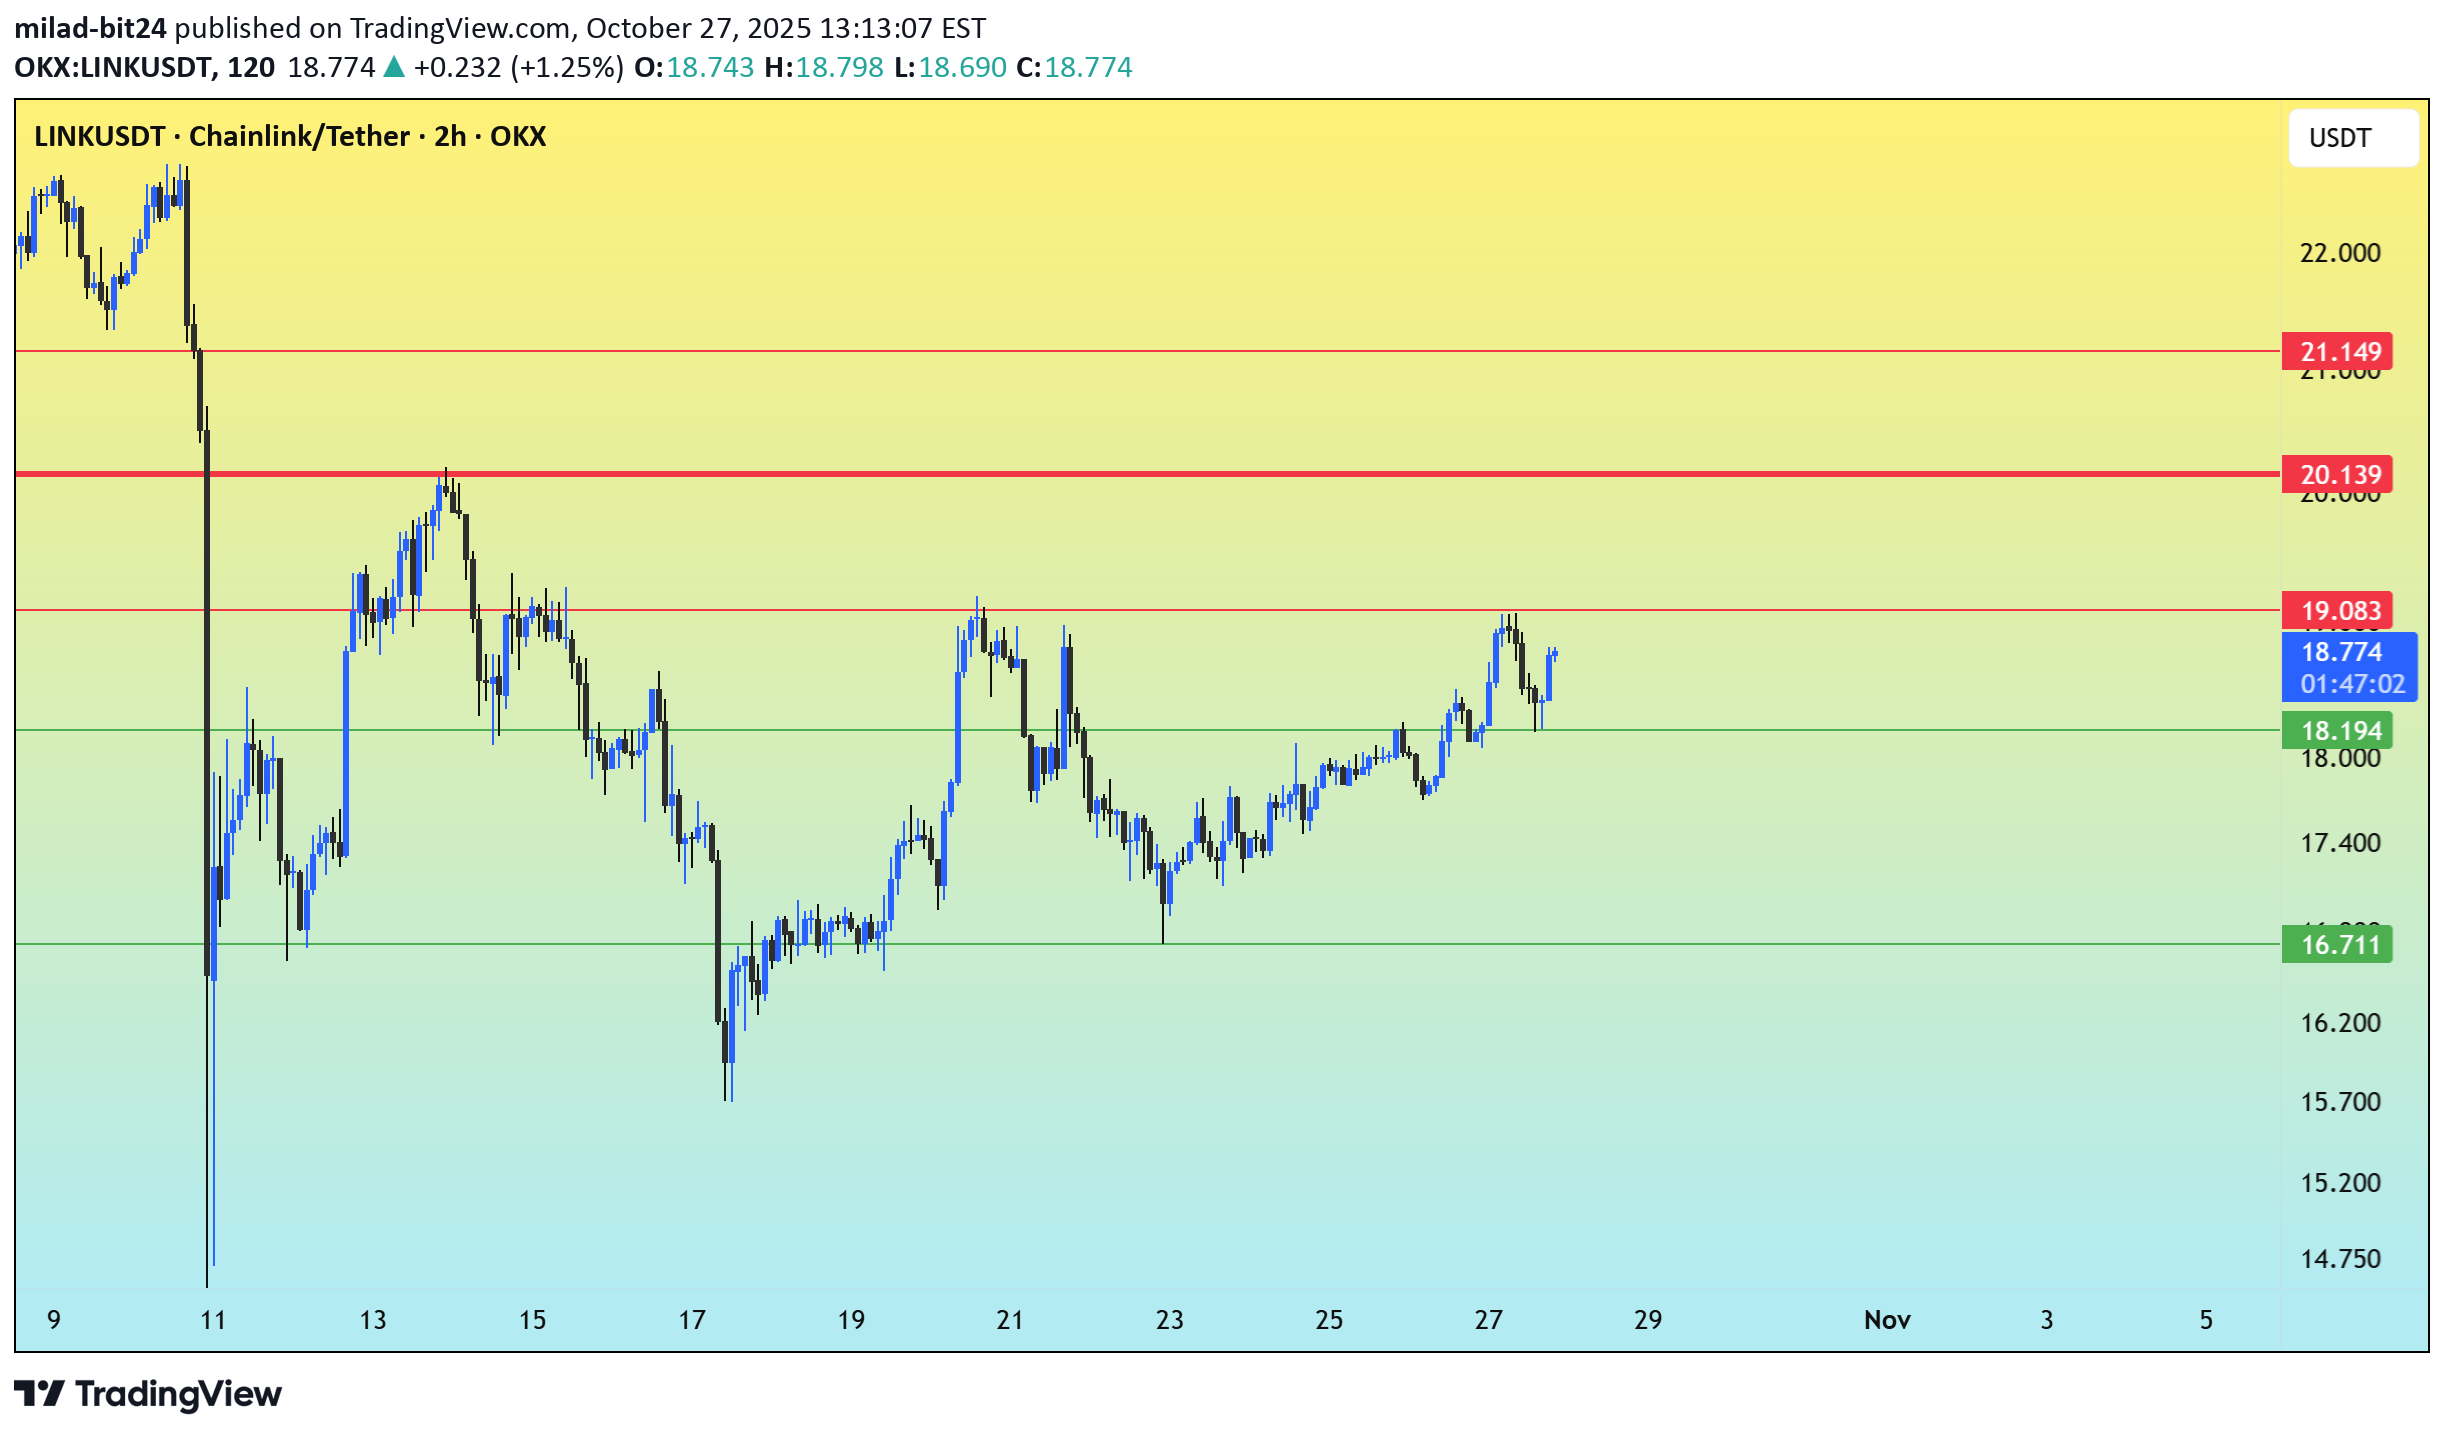
LINK/USDT is in a recovery and consolidation phase after a sharp decline, currently testing the upper boundary of its range with increasing bullish pressure. Following a significant drop around October 9th-11th, the price has been in a horizontal channel, showing higher lows since the $14.75 low. It is now challenging the major ceiling around $19.08, signaling buyer control. Support Levels: - Immediate Support: $18.194 - Must hold to maintain momentum; break risks testing $16.711. - Major Support: $16.711 - Strong consolidation floor; critical to defend to avoid deeper retracement. Resistance Levels: - Primary Resistance: $19.083 - Break and close above needed to exit consolidation. - Major Target 1: $20.139 - First hurdle after breaking $19.083. - Major Target 2: $21.149 - Final resistance before price drop. Bullish Scenario: A breakout above $19.083 would confirm a new trend with targets at $20.139 and $21.149. Neutral/Bearish Scenario: Failure to break $19.083 may lead to a return to the $18.194 support, with a drop below $16.711 indicating strong weakness.
milad-bit24
سولانا (SOL) از محدوده خارج شد: آیا قیمت به ۲۱۷ دلار میرسد؟
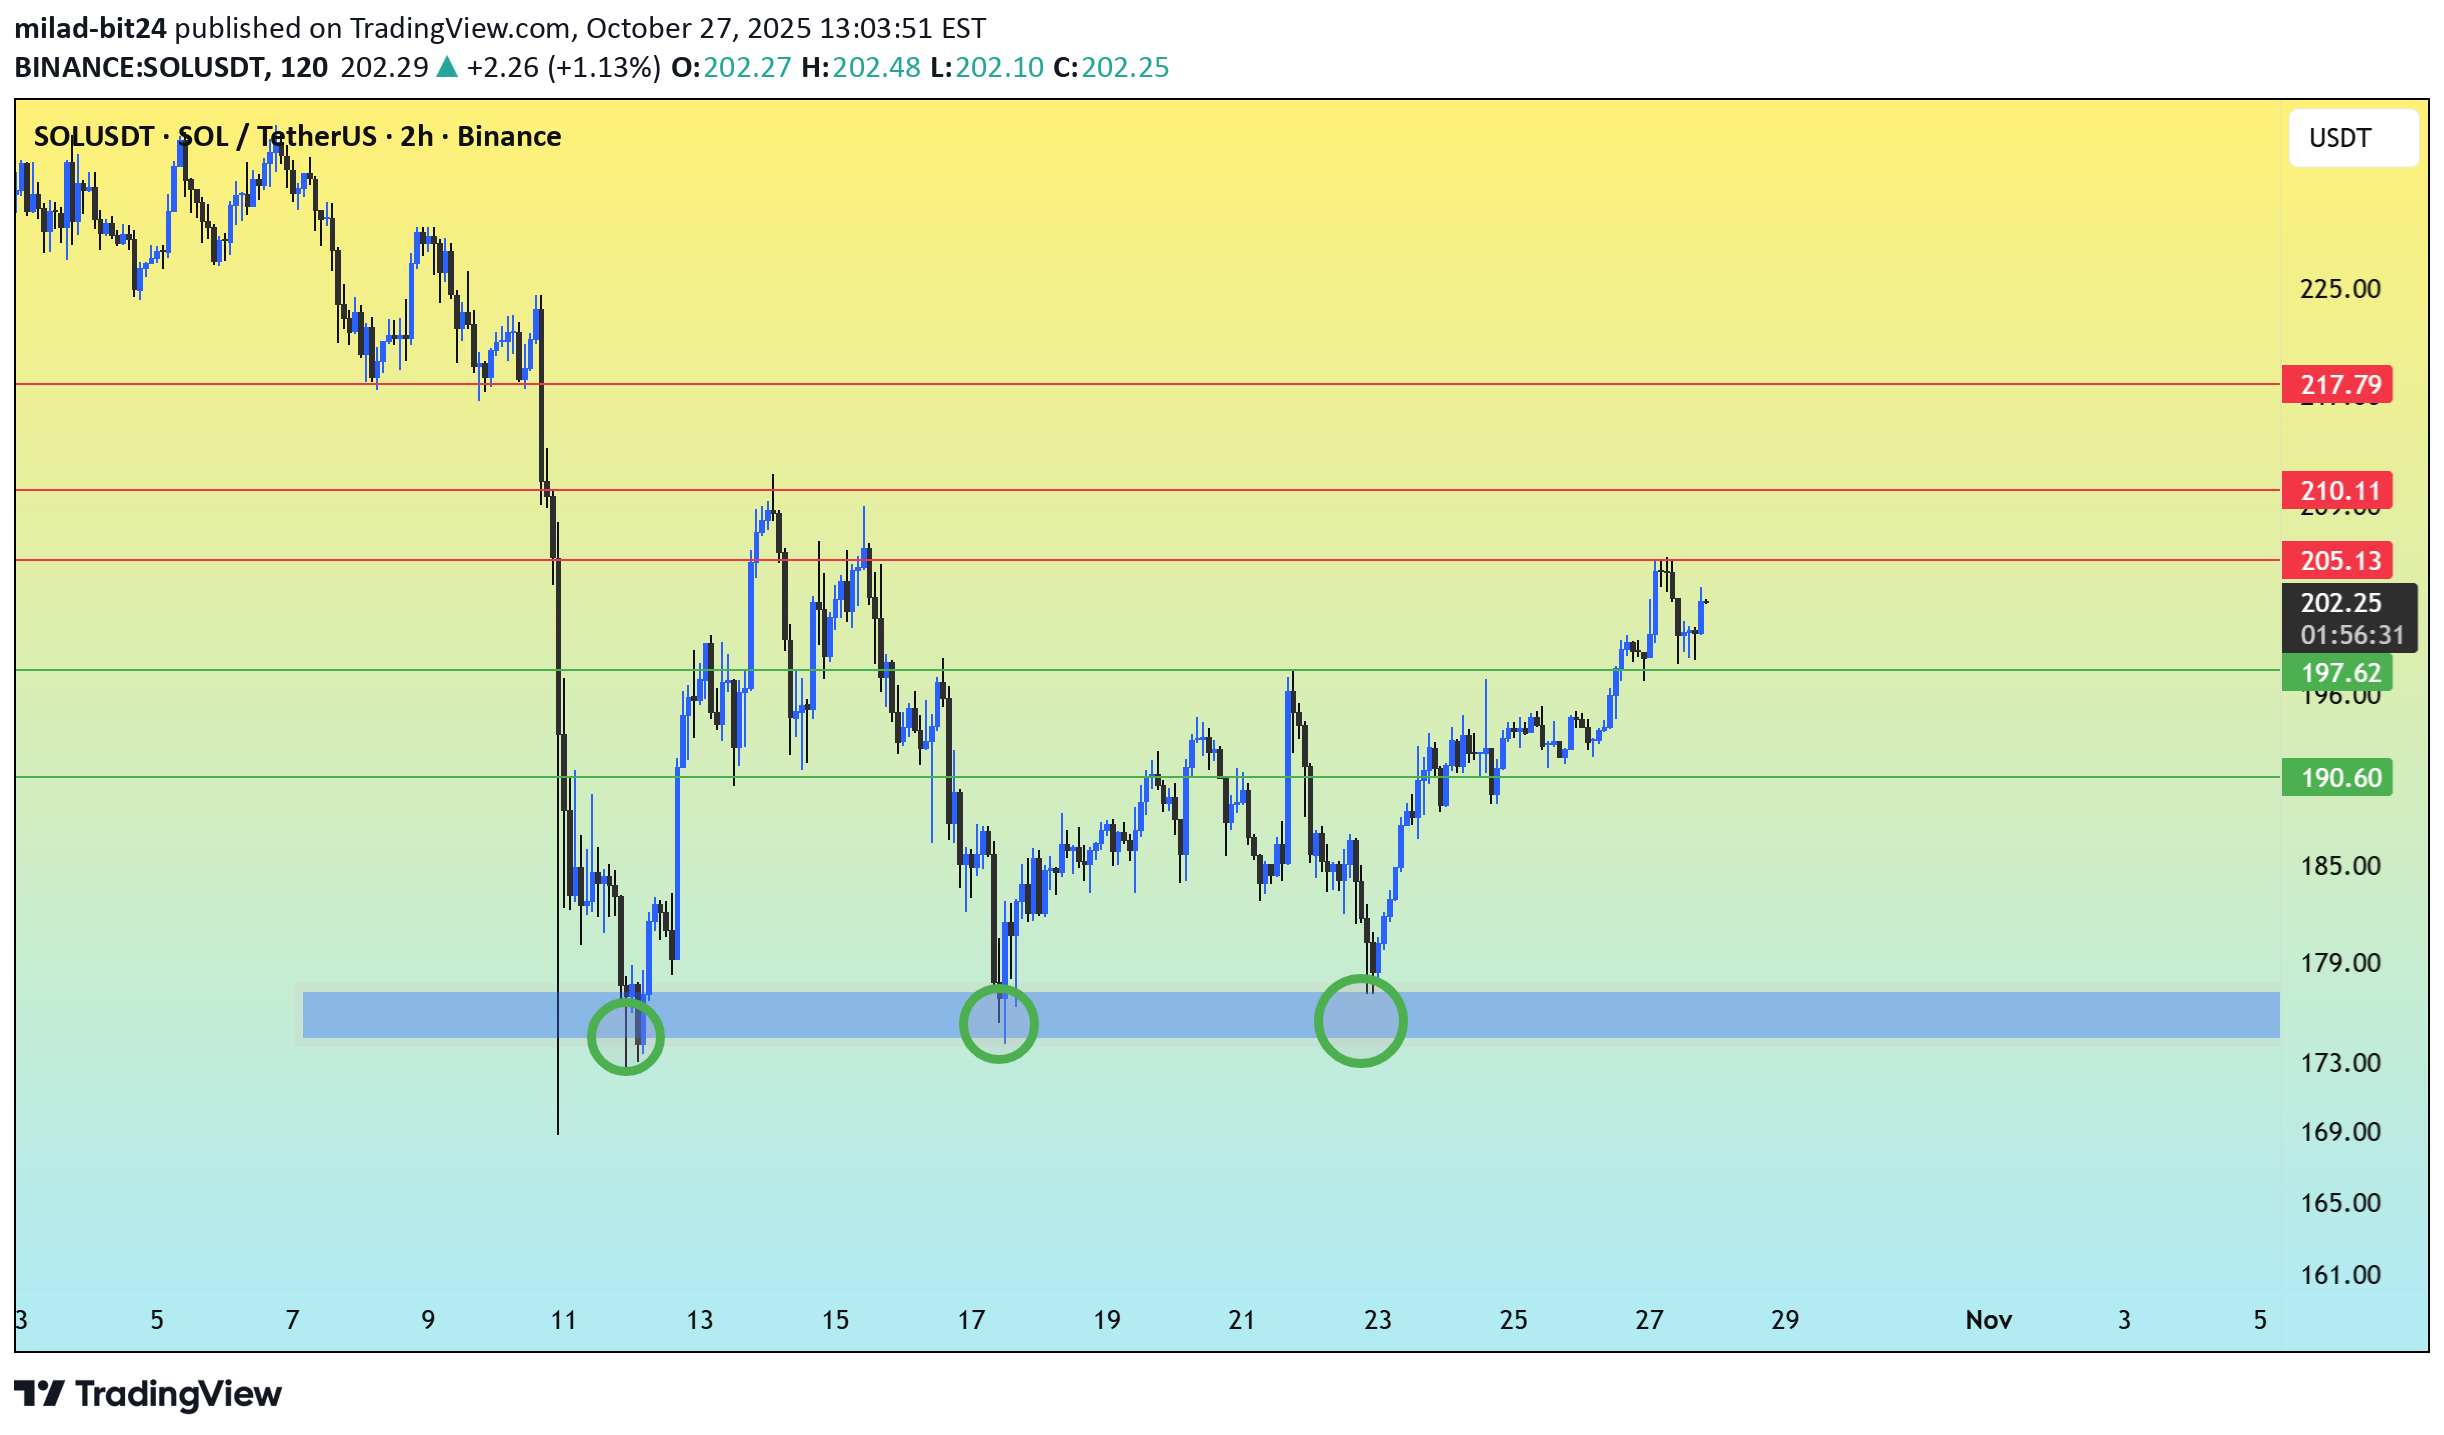
After a sharp drop around October 9th-11th, there has been recovery and consolidation. Support Defense: The Demand Zone ($173 - $177) has been successfully defended three times, indicated by green circles, confirming its significance. Current Action: SOL has broken out of its consolidation range and is testing initial resistance. Support Levels $197.62 - Critical for maintaining the breakout and indicating further upward movement. $190.60 - Strong secondary support; below $197.62, this level will be tested. $173.00 - $177.00 - Essential area to hold for long-term recovery. Resistance Levels $205.13 - A close above this level is needed to confirm momentum towards major targets. SOL/USDT is in a strong position after breaking out of consolidation. Bullish: Holding above $197.62 and breaking $205.13 could lead to targets of $210.11 and $217.79. Bearish: Falling below $197.62 and $190.60 would indicate a return to consolidation, with the trend at risk if it drops below the $173 - $177 Demand Zone.
milad-bit24
قیمت جوپیتر (JUP) به ۰.۴۸ دلار رسید: آیا این آخرین مانع قبل از صعود به اوجهای جدید است؟
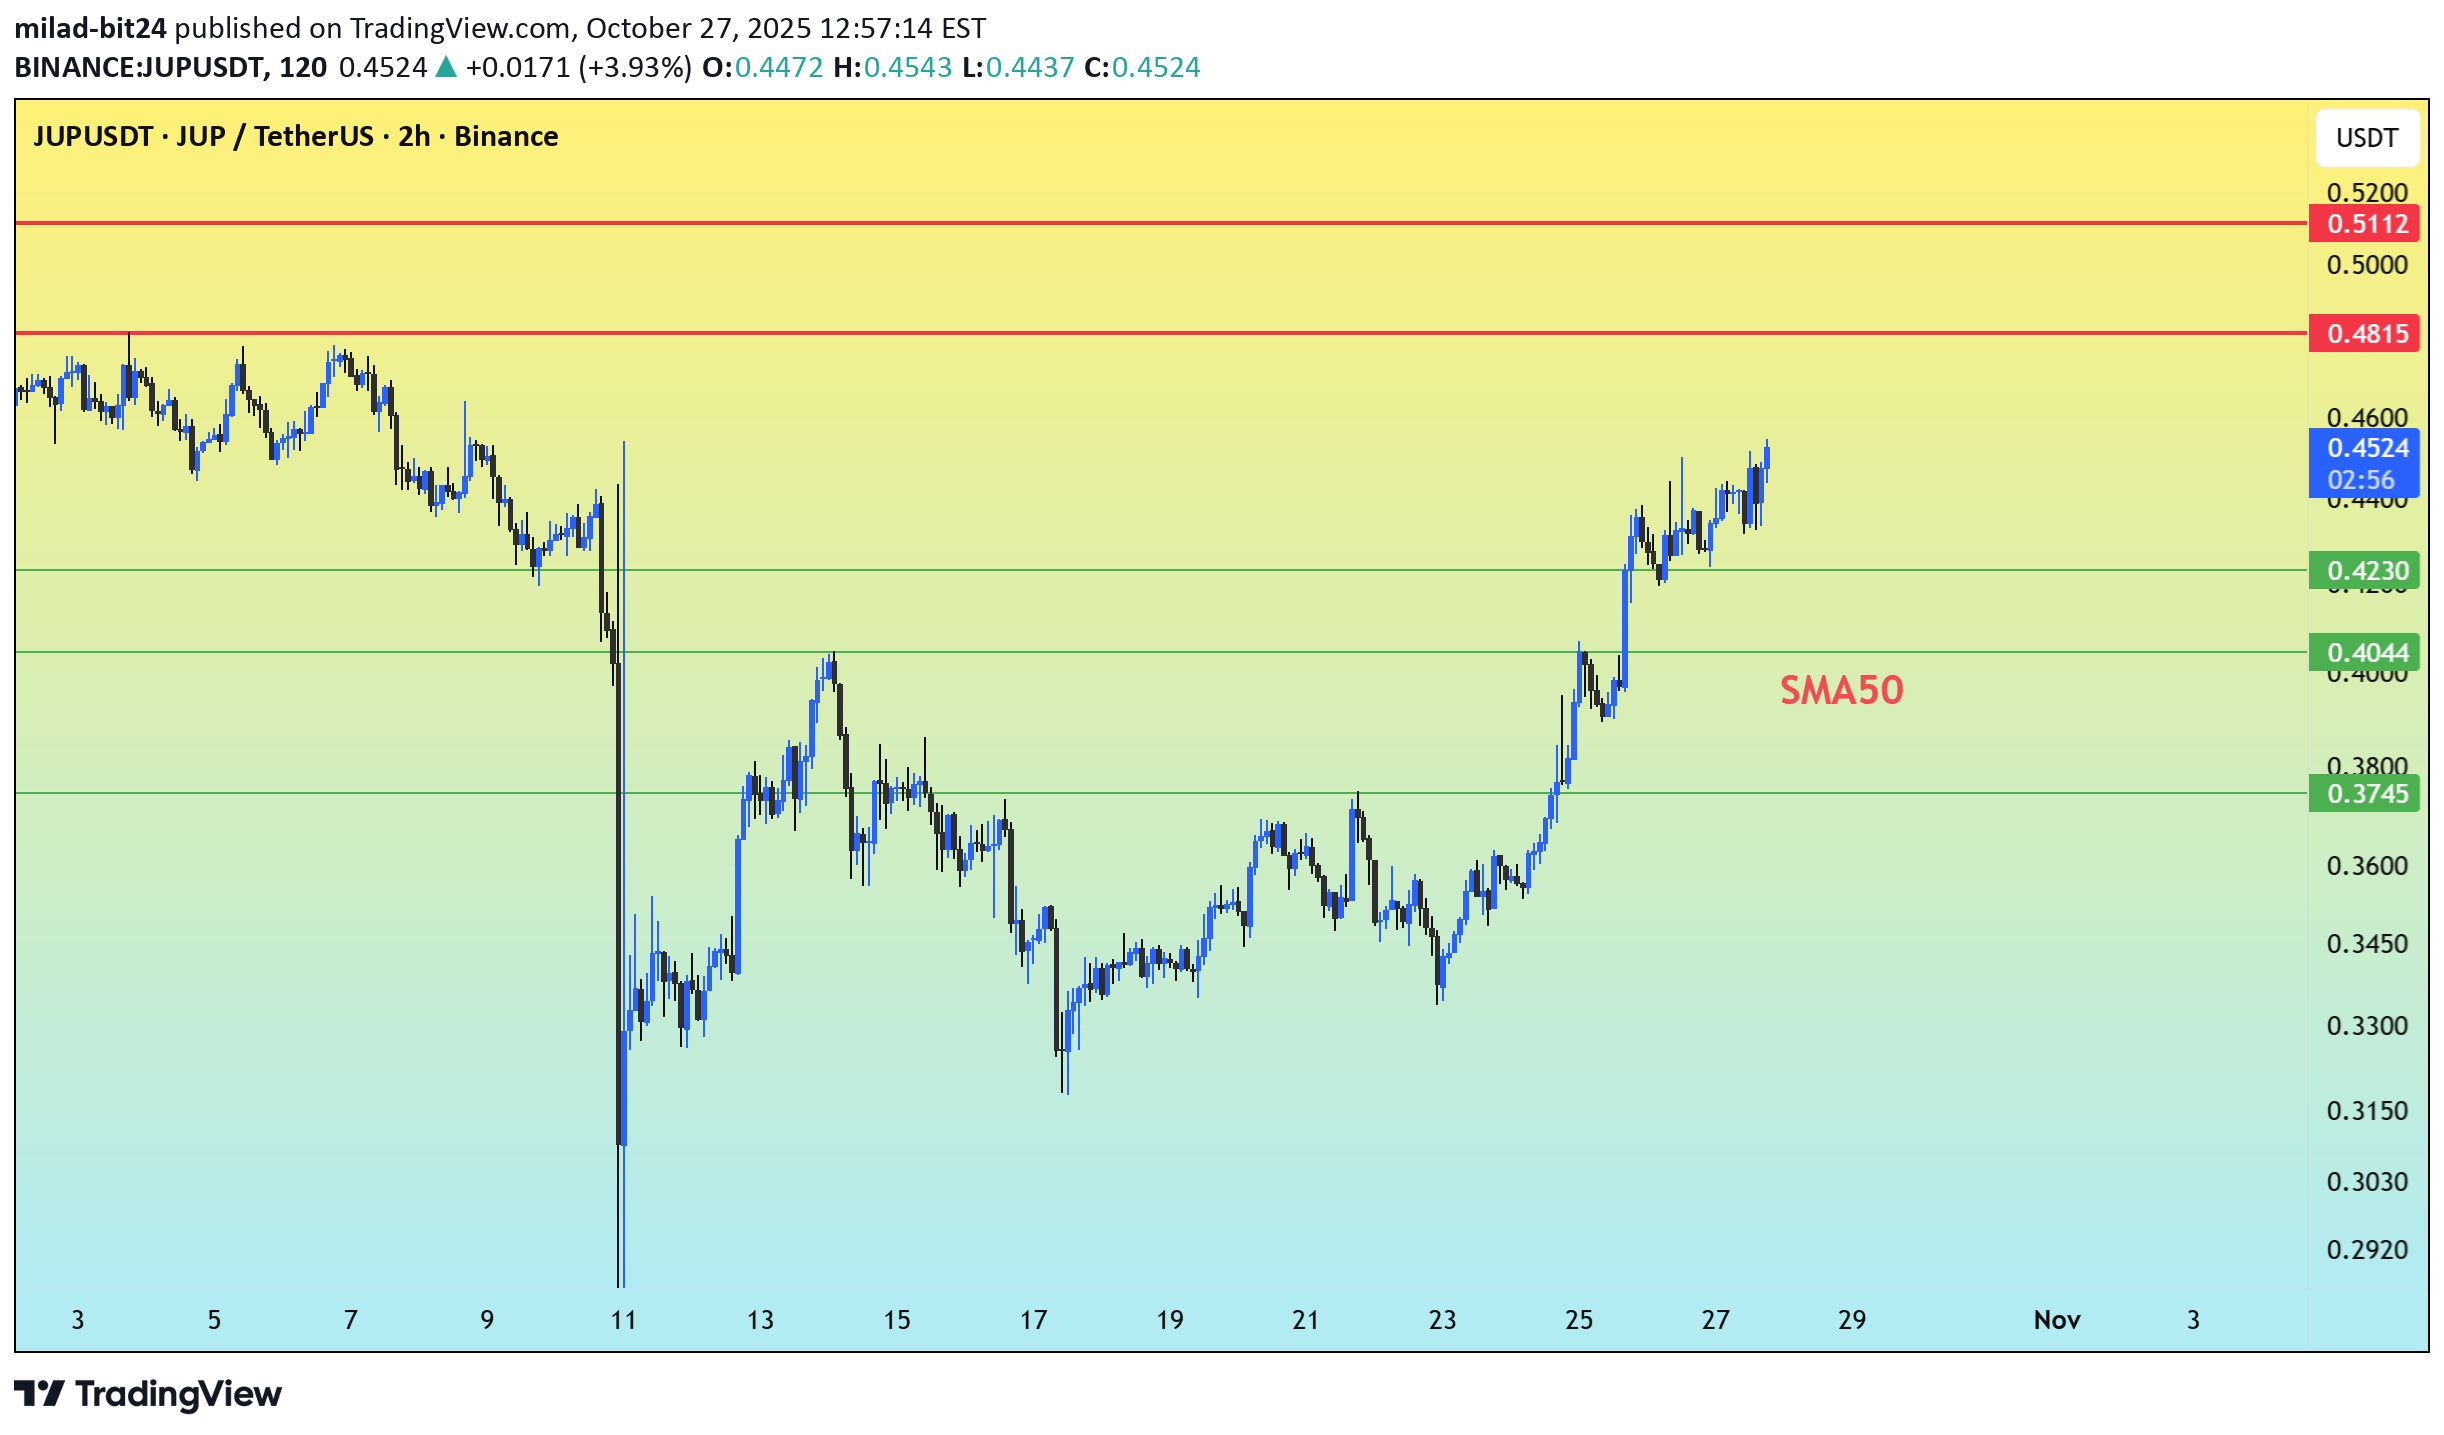
The asset, after a sharp sell-off on October 11th, has since shown a strong recovery with a rounded bottom and upward trend. It is trading well above its SMA50, indicating strong short-term bullish momentum. Support Levels: 1. Immediate Support: $0.4230 - Crucial for sustaining the recovery phase. 2. Major Support: $0.4044 - Acts as support if immediate level fails; falling below signals loss of momentum. 3. Key Mid-Range Support:*$0.3745 - Critical to avoid reversal into consolidation zone. Resistance Levels: 1. Primary Resistance: $0.4815 - Important hurdle; breaking this confirms recovery. 2. Next Major Target: $0.5112 to $0.5200 - Key resistance area following a break above $0.4815. Bullish Scenario: Holding $0.4230 supports likely breakout above $0.4815, targeting $0.51-$0.52. Bearish Scenario: Breakdown below $0.4230, especially with high volume, may test support at $0.4044 and prompt a correction. Key Action: Look for breakout above $0.4815 to confirm next upward move.
milad-bit24
جهش ۷۰ درصدی رمزارز: تحلیل اوجگیری و سطح حیاتی که نباید از دست برود!
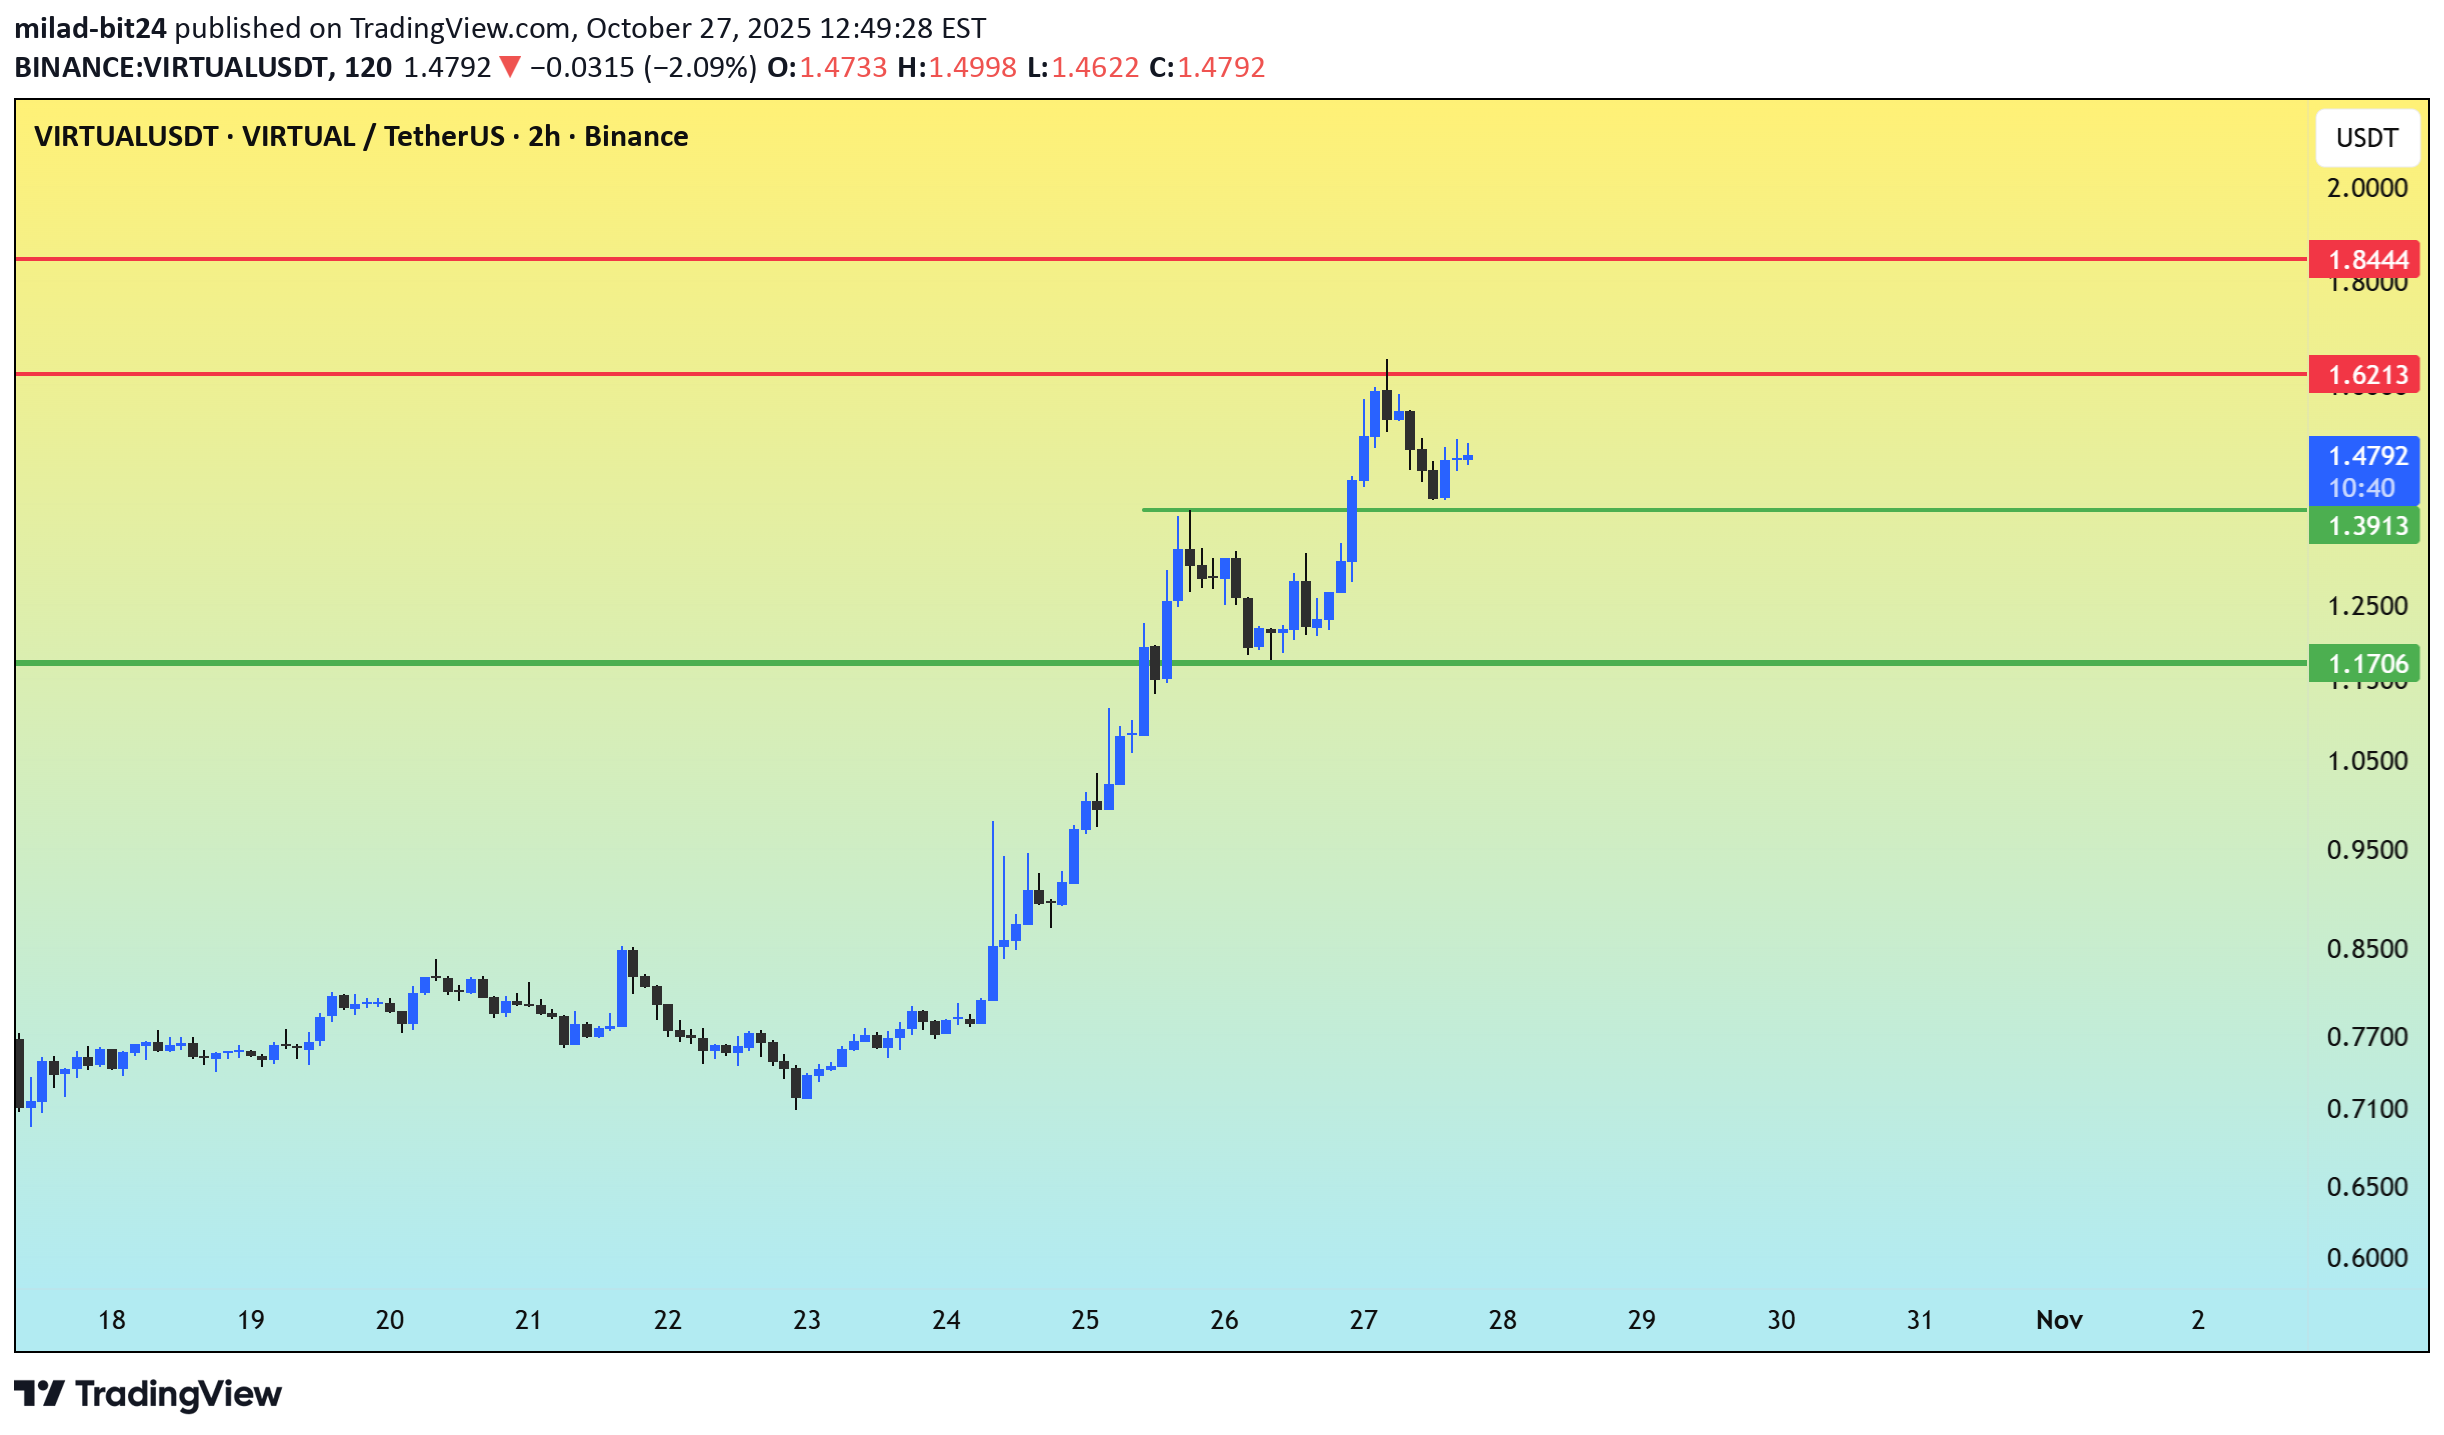
The asset experienced a sharp breakout starting around October 25th, moving from the $0.85 – $0.95 range to a recent high near $1.62. The price action confirms a strong, impulsive uptrend, characterized by higher highs and higher lows following the breakout.After hitting a local peak at $1.6213, the price underwent a small retracement and is currently consolidating above a critical immediate support level (around $1.3913). Key support levels include $1.3913 (immediate support) and $1.1706 (major support). Immediate resistance is at $1.6213, with the next target at $1.8444. Holding above $1.3913 is crucial for maintaining bullish momentum. Bullish Scenario: Holding $1.3913 and breaking $1.6213 targets $1.8444. Bearish Scenario: Falling below $1.3913 suggests a retreat towards $1.1706.
milad-bit24
آیا WAL/USDT منفجر میشود یا سقوط میکند؟ تحلیل سطوح کلیدی حمایت و مقاومت

The 4-hour chart for WAL/USDT reveals that the asset has experienced significant volatility, characterized by a sharp decline followed by an extended period of consolidation. The price is currently testing a crucial resistance level, suggesting a potential breakout is imminent. Major Support (The Floor): $0.2158 (Green Line). This level has held firm repeatedly, acting as a reliable floor and a probable "demand zone." A breakdown below this point would confirm bearish momentum and likely initiate a further decline. Immediate Resistance (The Barrier): $0.2524 (Lower Red Line). This is the most crucial level right now. Primary Targets (Upper Resistance): $0.2800 (Middle Red Line) and $0.3024 (Upper Red Line). These levels will act as the next key price targets if the $0.2524 resistance is overcome
milad-bit24
MYX Finance: Ready for a Breakout or a Rejection?

The price action suggests that MYX/USDT has been consolidating below the long-term descending trendline after an initial rapid ascent. The pattern is approaching a climax point where a significant directional move is imminent. Diagonal Resistance (The Black Line): A long-term descending trendline is clearly visible, connecting multiple swing highs. The price is currently testing this key resistance level. This trendline has historically served as a strong ceiling for the price. Major Horizontal Resistance (The Red Line): The all-time high (or a very strong previous peak) is marked by the red line near $18.68. This will be the ultimate target if a successful breakout occurs. mmediate Support (The Green Line): The horizontal support level is located at $12.44. This level acted as a major point of previous resistance and now functions as the immediate floor following the recent upward move. Strong Demand Zone (The Green Box): A solid area of support/accumulation is visible between the $8.00 and $9.00 range. This zone provided the base for the recent rally.
milad-bit24
Bitcoin at a Crossroad: Will $101K Support Hold?

BTC is trading inside a clear descending channel, indicating a sustained bearish trend. $101,558 – a potential short-term support level. $98,795 – a stronger support aligned with the lower boundary of the channel and long-term trendline. Long-term trendline support: Still intact, starting from late 2024, suggesting that the macro uptrend is not yet broken. If BTC holds above $101K and rebounds, it could reattempt a breakout from the descending channel. A breakdown below $98.8K may accelerate bearish momentum, potentially pushing the price toward $92,703 as marked on the chart. On the upside, a confirmed breakout above the descending channel could bring BTC back toward the $120K region.
milad-bit24
SOL at a Crossroads — Bounce or Breakdown Ahead

The breakdown from the rising wedge is a bearish signal, suggesting a potential continuation of the downtrend. Immediate Support: The next strong support lies around $181, which aligns with both the 200-day EMA and the ascending trendline support. This confluence zone will be crucial in determining if the bulls can defend the uptrend. Resistance Levels: On the upside, resistance is seen near $220, which was the lower boundary of the wedge and may now act as resistance. Stronger resistance remains around $240–260. Outlook: If SOL holds the $180 support, it may attempt a rebound. However, a breakdown below this level could accelerate bearish momentum, targeting the $150–160 range.
milad-bit24
XRP at Crossroads: Will $3.22 Break or $2.71 Collapse?
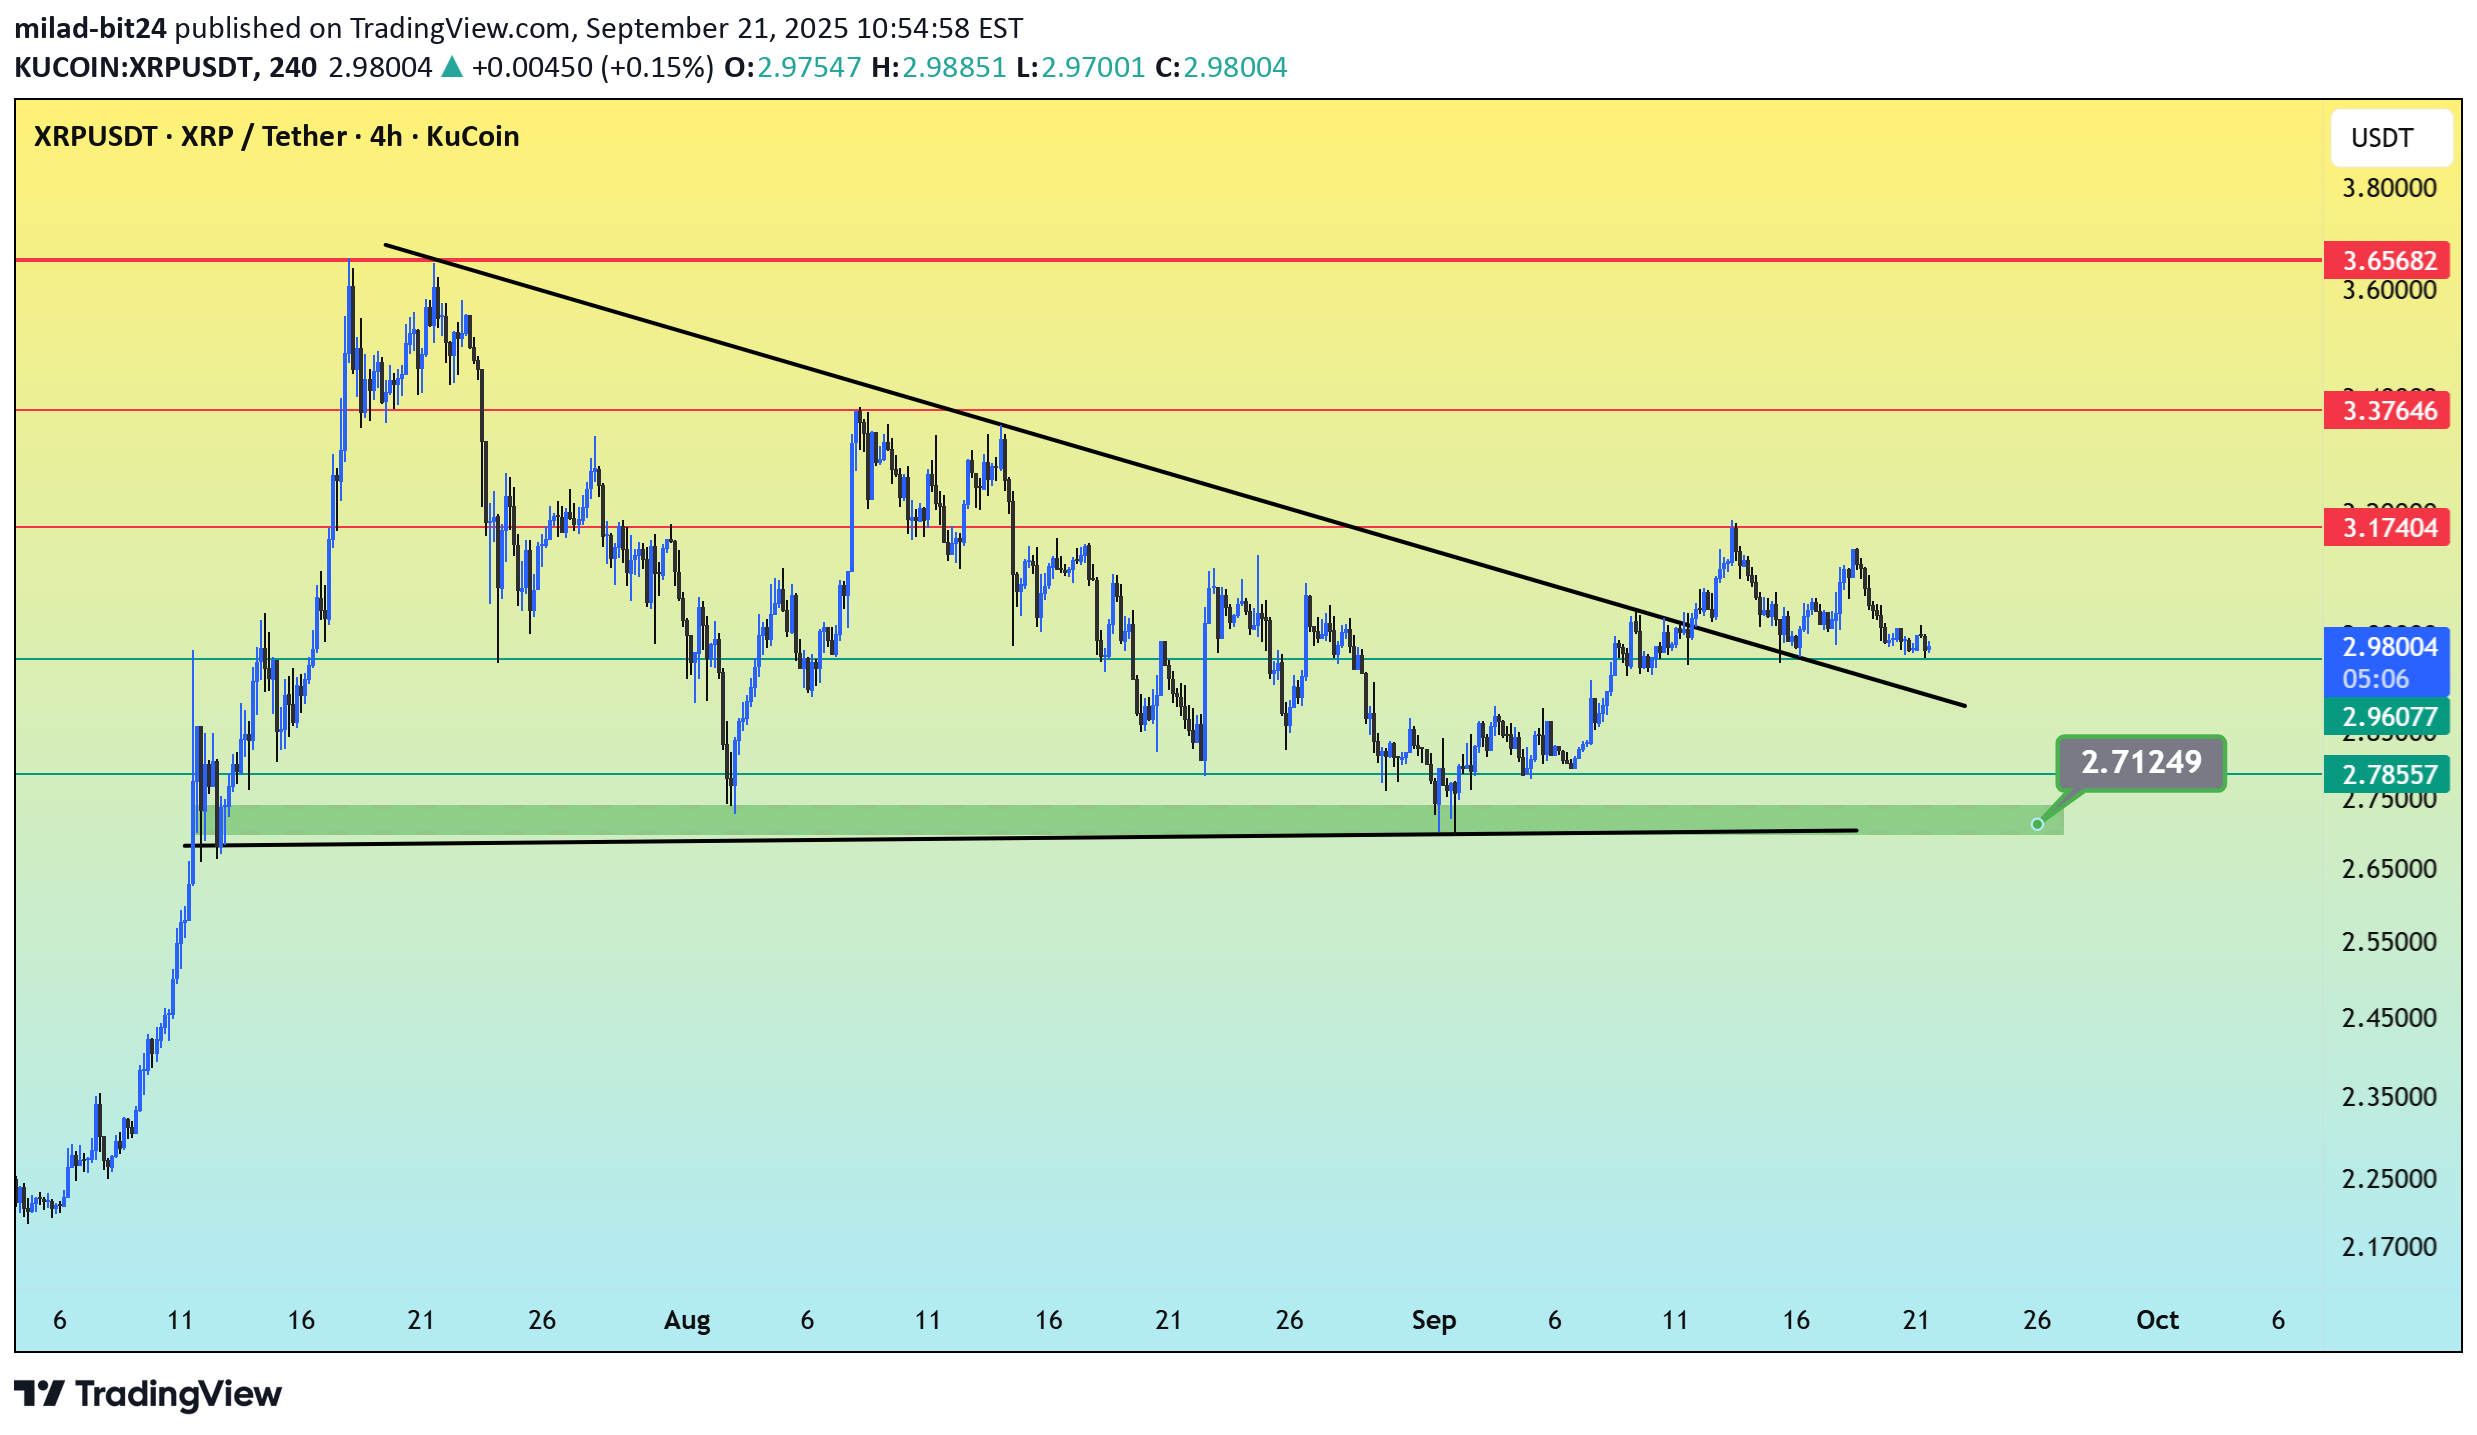
XRP is trading just above the descending trendline that’s been active since mid-July, showing signs of compression and potential breakout. Price is hovering between key resistance at $3.0166–$3.2164 and support at $2.7149–$2.7857, forming a tight consolidation range. Bullish breakout above $3.17 could trigger a rally toward $3.37–$3.64, especially if ETF filings gain traction. Bearish breakdown below $2.71 may lead to a drop toward $2.50–$2.26, as suggested by recent institutional liquidations and technical pressure.
milad-bit24
IP Breaks $11.7 – Is $16 the Next Target?
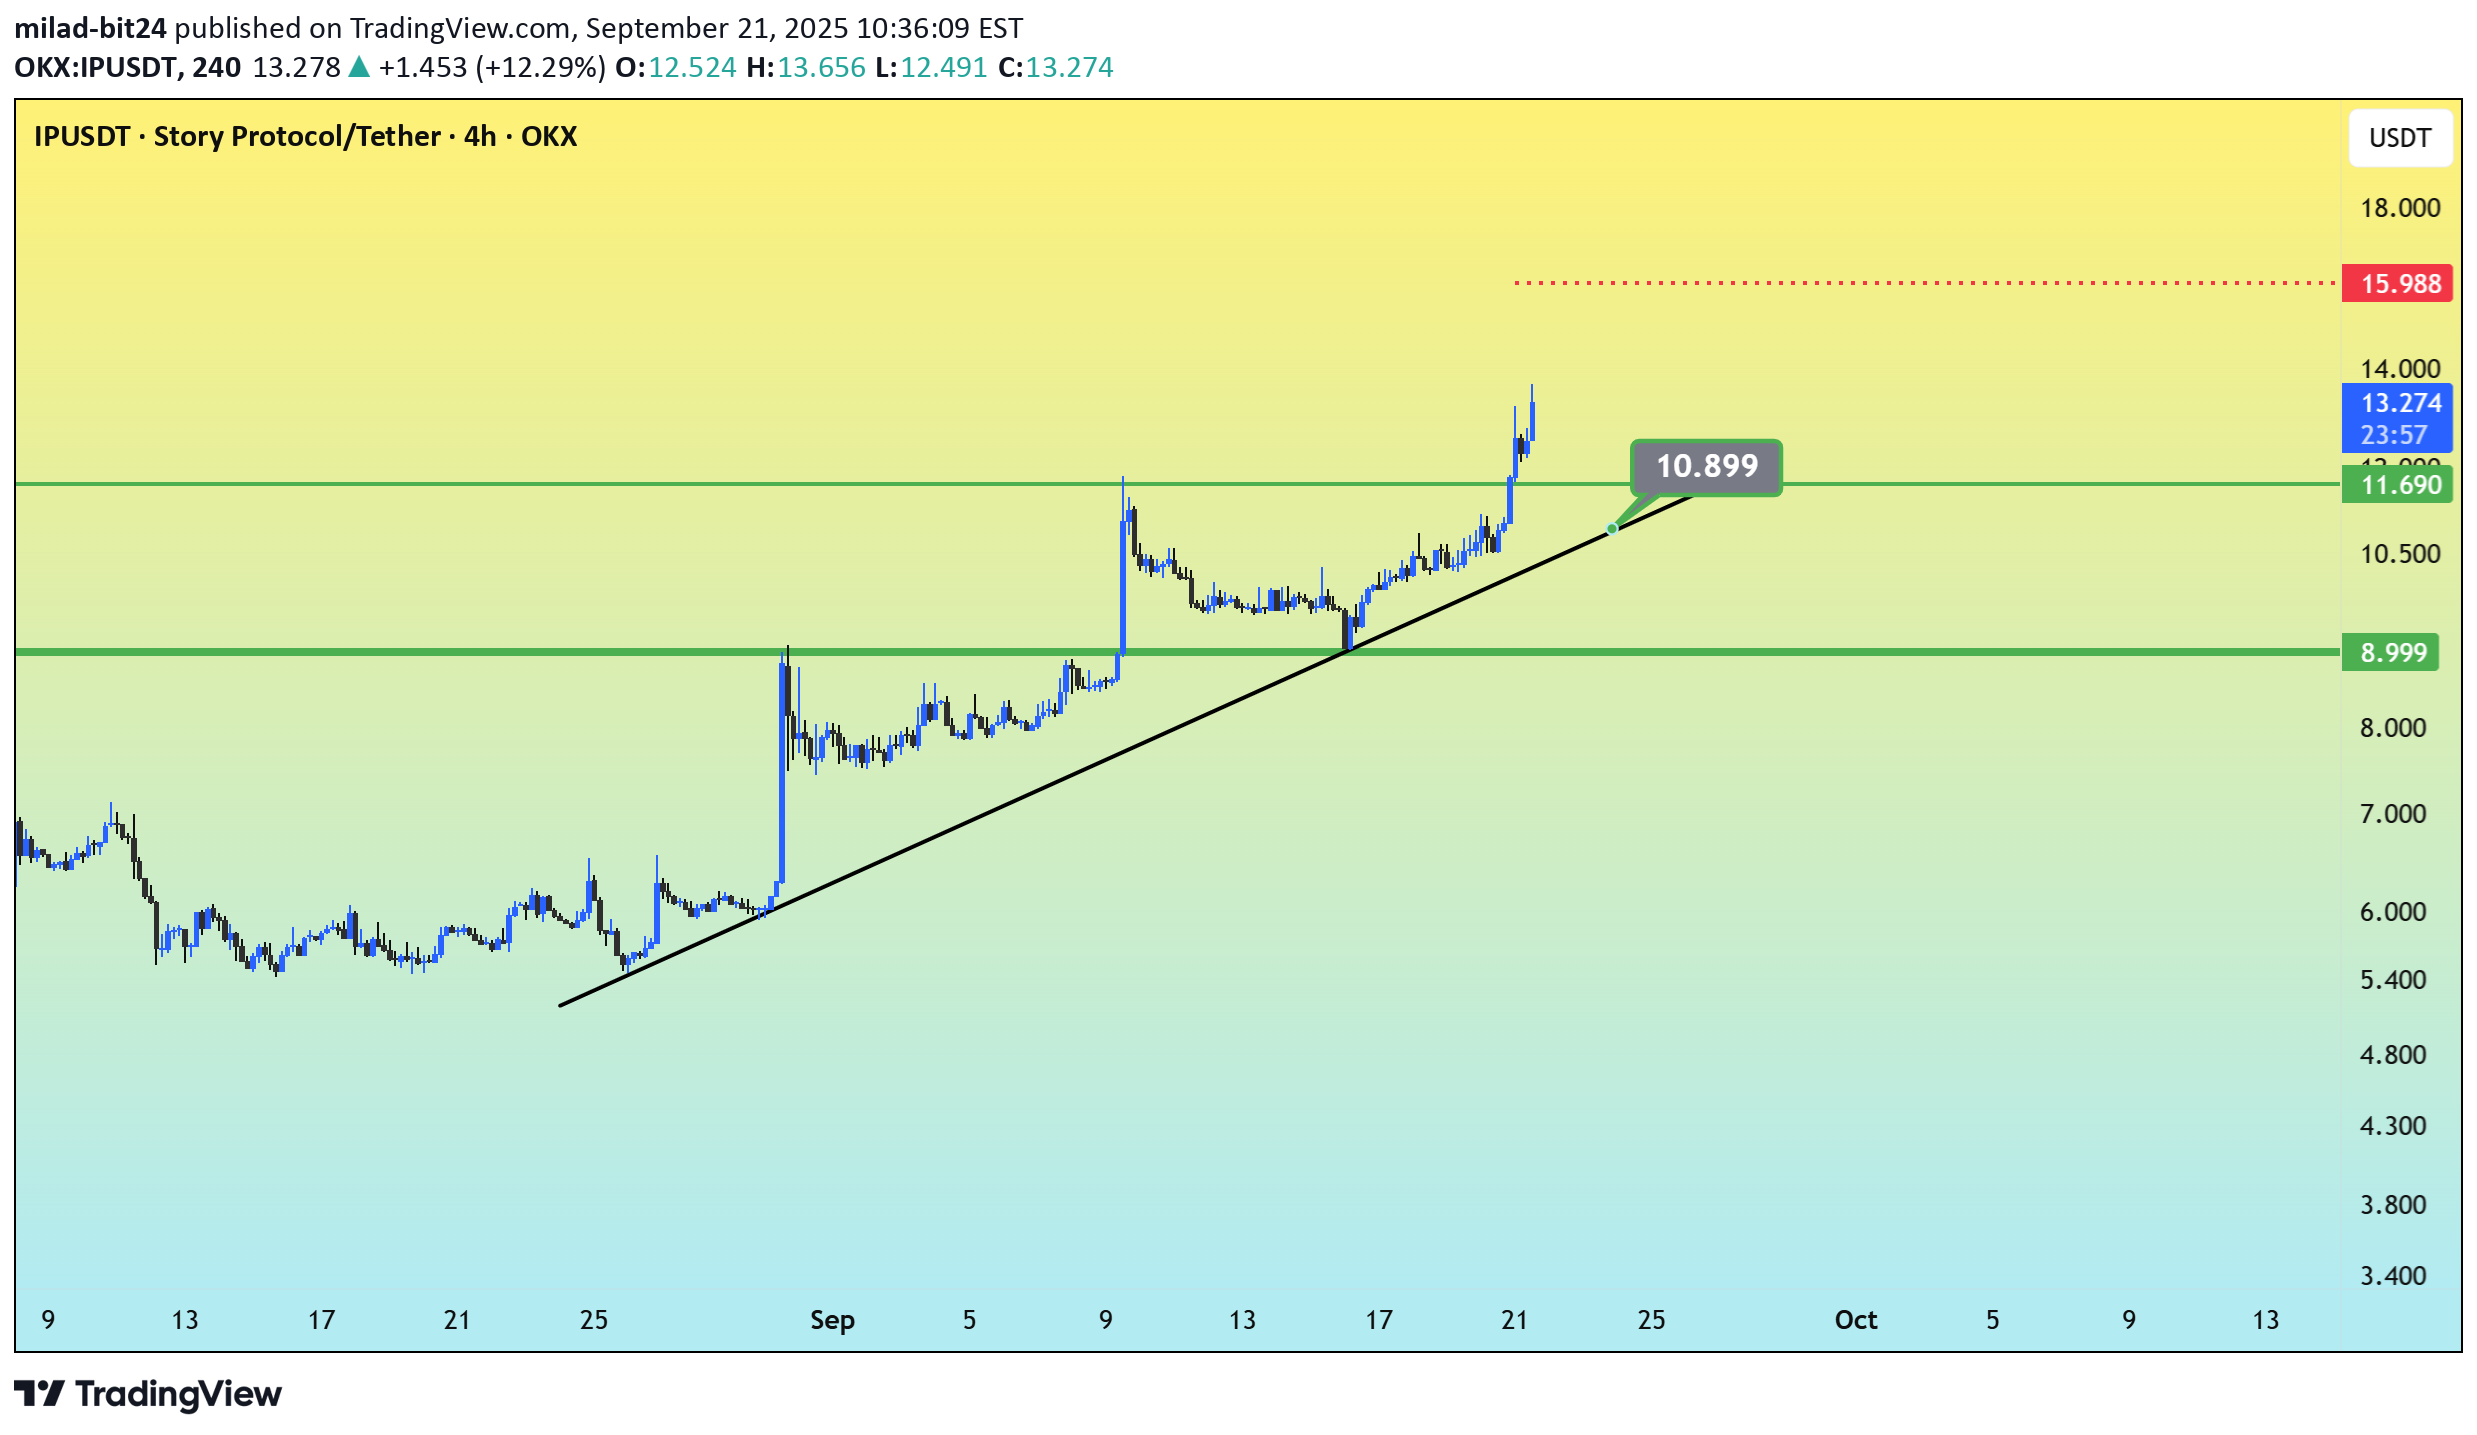
Price action is forming a parabolic curve, suggesting aggressive buyer interest. IP/USDT has shown strong bullish momentum, breaking above the $11.69 resistance and extending toward $13.25. The ascending trendline from recent lows remains intact, highlighting sustained buying pressure. Support Levels: $11.69 (newly flipped support) and $8.99 – both zones are crucial to maintain the bullish structure. Immediate Resistance : $15.98 – a breakout above this level could open the way toward higher highs. Trend Outlook : As long as IP holds above $11.69, momentum favors the bulls with potential continuation toward $16. A pullback into $11.7 may offer a retest buying opportunity.
Disclaimer
Any content and materials included in Sahmeto's website and official communication channels are a compilation of personal opinions and analyses and are not binding. They do not constitute any recommendation for buying, selling, entering or exiting the stock market and cryptocurrency market. Also, all news and analyses included in the website and channels are merely republished information from official and unofficial domestic and foreign sources, and it is obvious that users of the said content are responsible for following up and ensuring the authenticity and accuracy of the materials. Therefore, while disclaiming responsibility, it is declared that the responsibility for any decision-making, action, and potential profit and loss in the capital market and cryptocurrency market lies with the trader.