
MoonTradingForecast
@t_MoonTradingForecast

What symbols does the trader recommend buying?
Purchase History
پیام های تریدر
Filter
تحلیل تکنیکال طلا (XAUUSD): سطوح کلیدی، مومنتوم و چشمانداز اقتصاد کلان
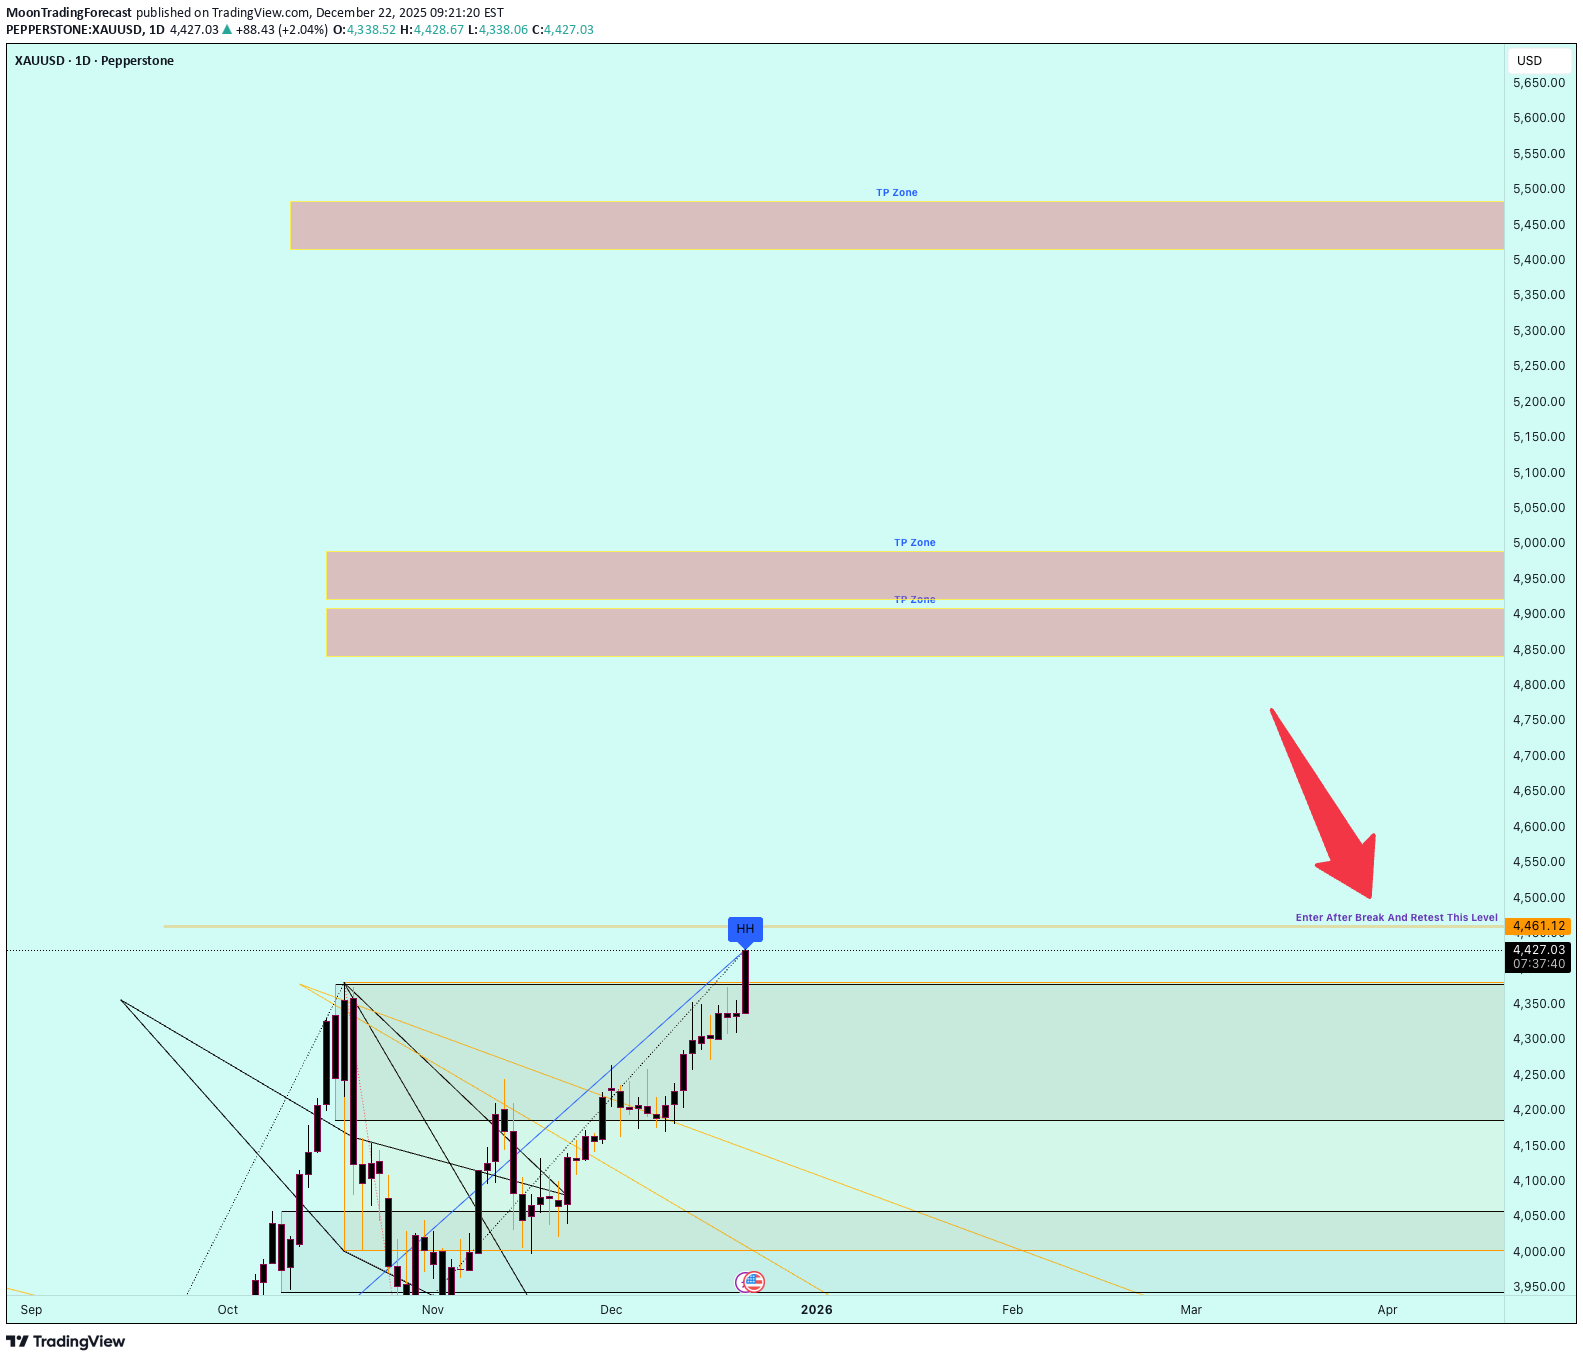
DESCRIPTION Gold (XAUUSD) remains one of the most traded safe-haven assets, driven by inflation expectations, real yields, USD strength, and global macro uncertainty. From a fundamental perspective, gold is often supported during periods of monetary easing, geopolitical risk, and declining real interest rates, while stronger USD and higher yields can apply pressure. From a technical standpoint, this analysis focuses on market structure, key support and resistance zones, trend behavior, and momentum conditions using clean price action and indicator confluence. The goal is to identify high-probability areas of interest rather than predict outcomes. This content is for educational and informational purposes only and reflects a personal market view, not financial advice. Disclaimer: Trading involves significant risk. Past performance is not indicative of future results. Always do your own research (DYOR) and manage risk appropriately. This is not investment advice. HASHTAGS & KEYWORDS #GOLD #XAUUSD #GoldAnalysis #TechnicalAnalysis #PriceAction #SupportResistance #MarketStructure #SafeHaven #Commodities #ForexTrading #TradingView #MacroEconomics #RiskManagement #NotFinancialAdvice
آیا دش (DASH) در آستانه بازگشت است؟ تحلیل کلیدی سطوح قیمتی برای تریدرها
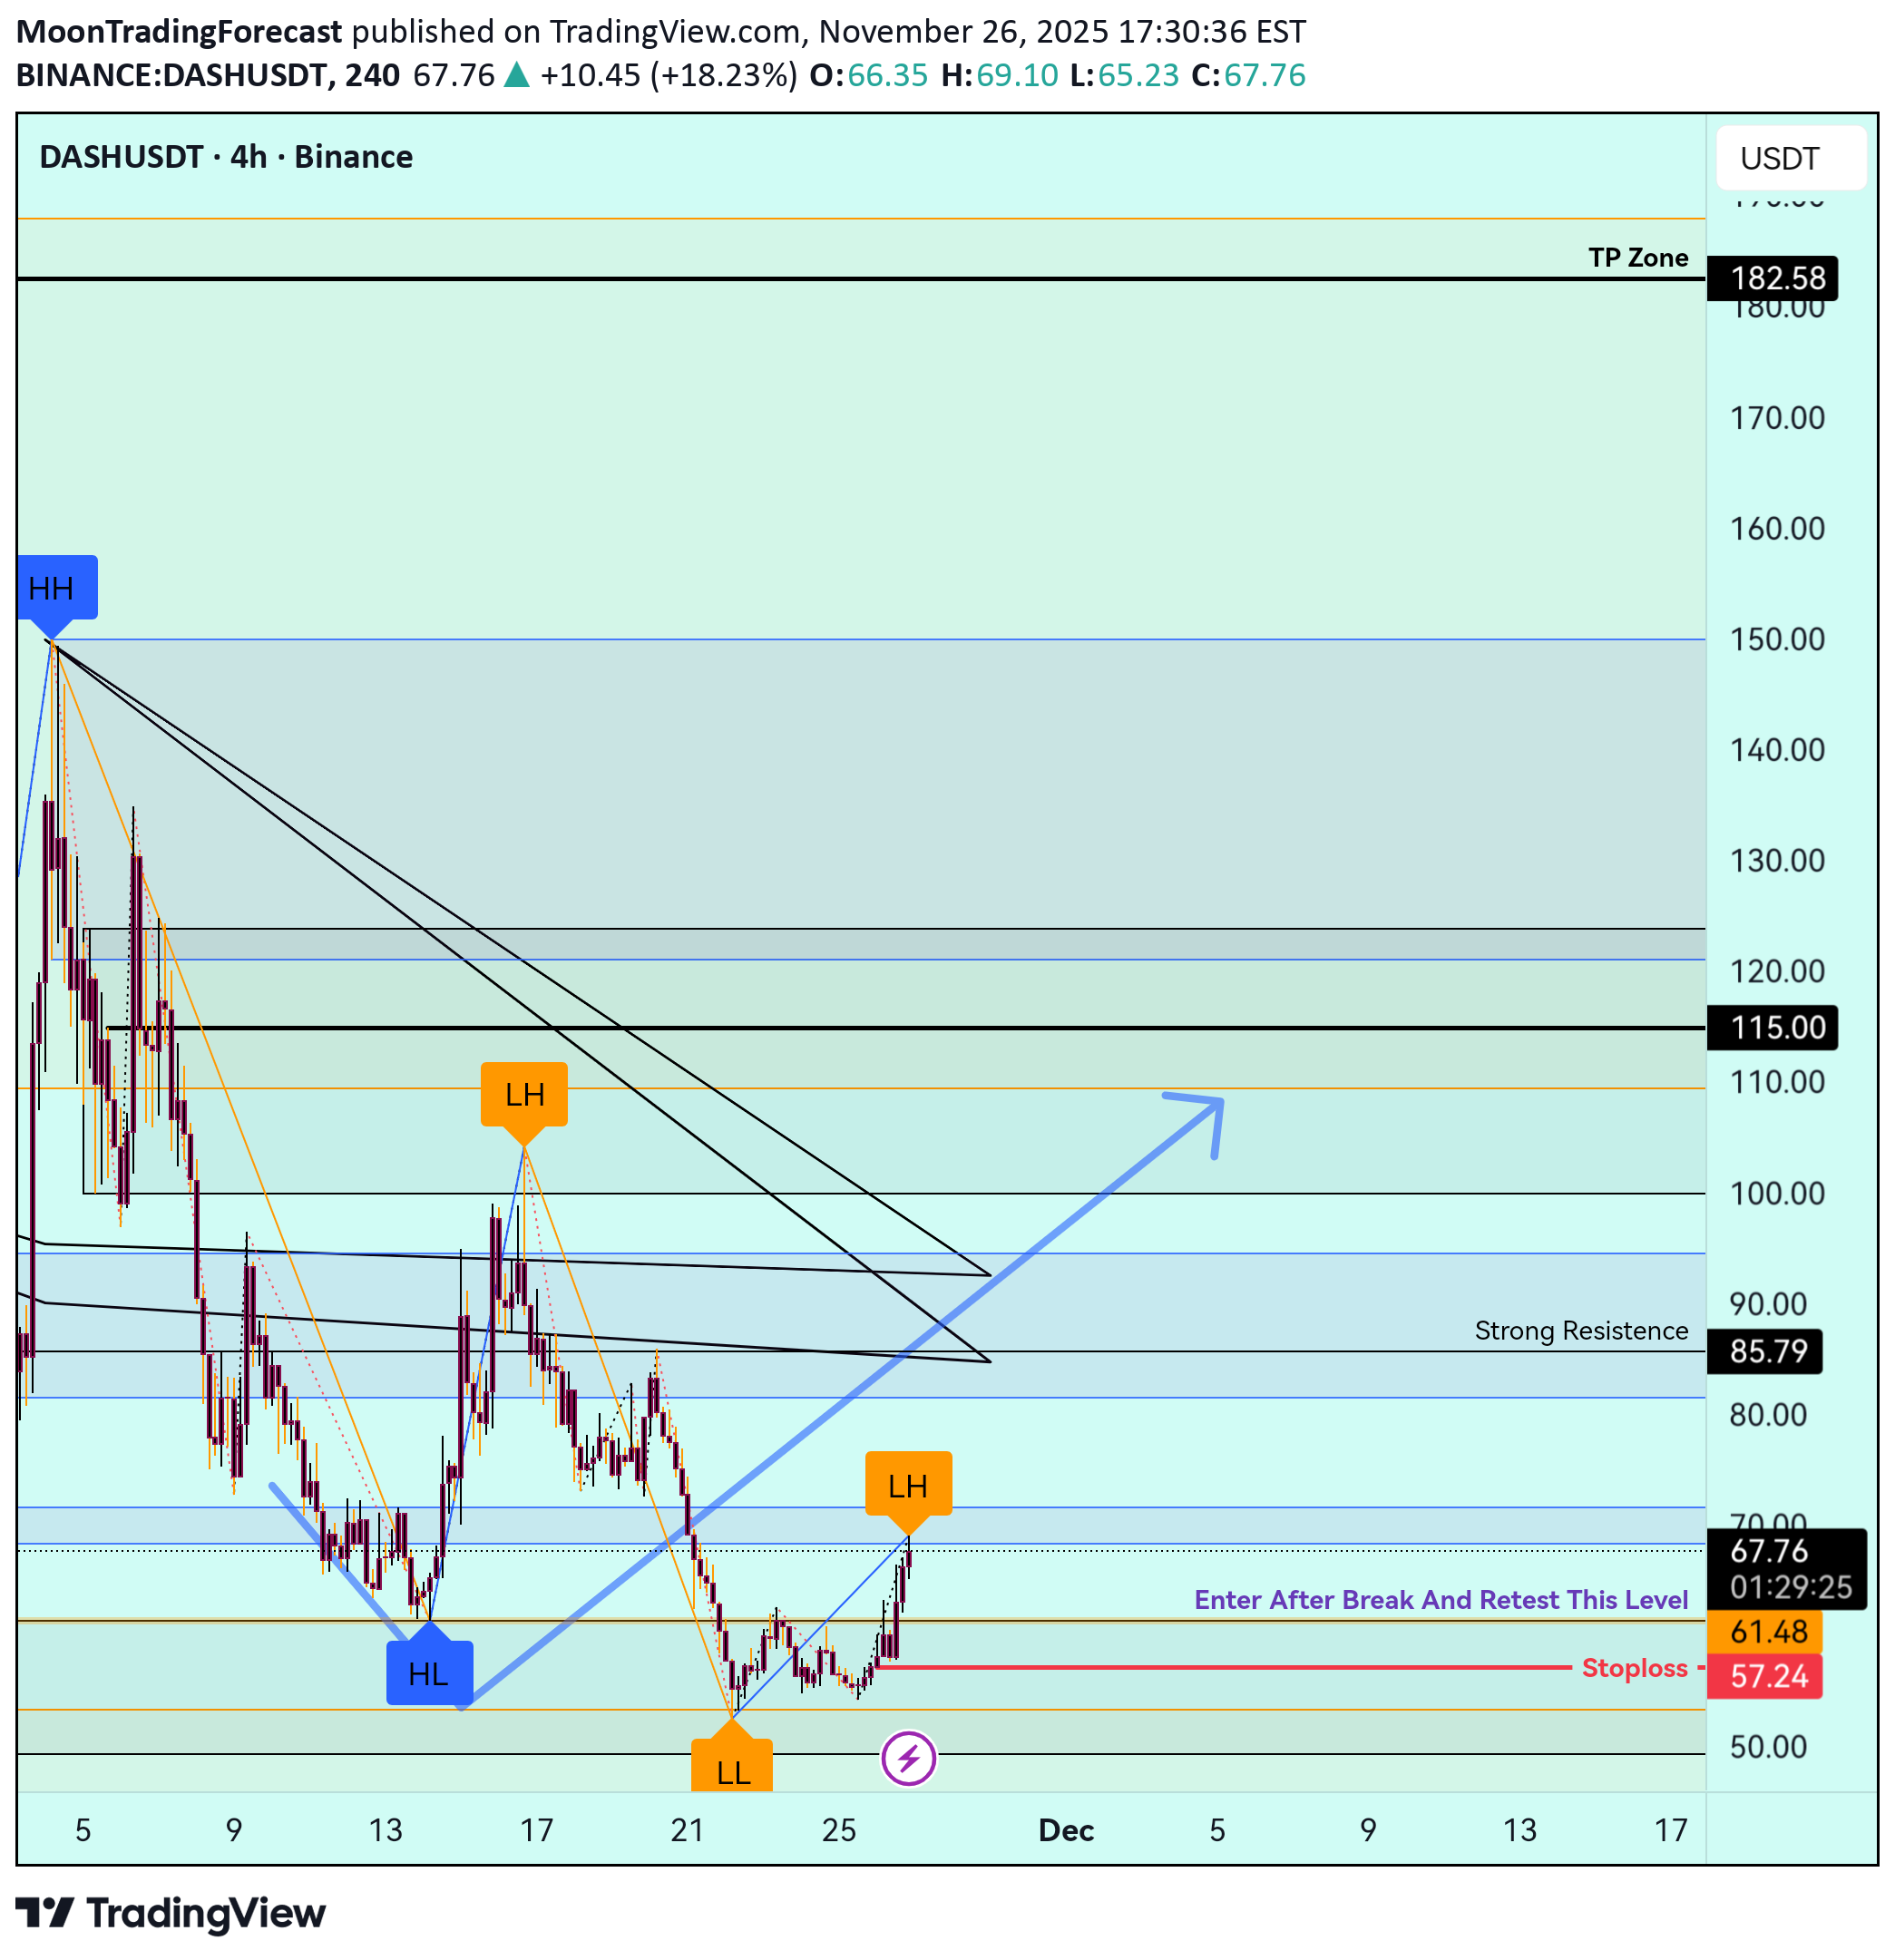
DASH (Digital Cash) is a cryptocurrency focused on fast, low-fee, and private digital payments. Built on a decentralized network with masternodes, DASH aims to provide real-world usability through its InstantSend and PrivateSend features. Despite reduced hype compared to previous cycles, the project continues to maintain a solid infrastructure and active development team. In this technical setup, I’m observing key levels where a potential reversal or continuation could form. The analysis includes price structure, volume behavior, and RSI momentum, helping to identify possible trend shifts or breakout areas. ⚠️ Disclaimer: This analysis is for educational and informational purposes only. It does not constitute financial advice. Always conduct your own research before making any trading decisions. #DASH #CryptoAnalysis #CryptoTrading #Altcoins #TechnicalAnalysis #PriceAction #ChartAnalysis #CryptoMarket #DashUSD #DashBTC #TrendAnalysis #SwingTrading
بیت کوین به خط حمایت حیاتی رسید: آیا جهش بزرگ بعدی در راه است؟
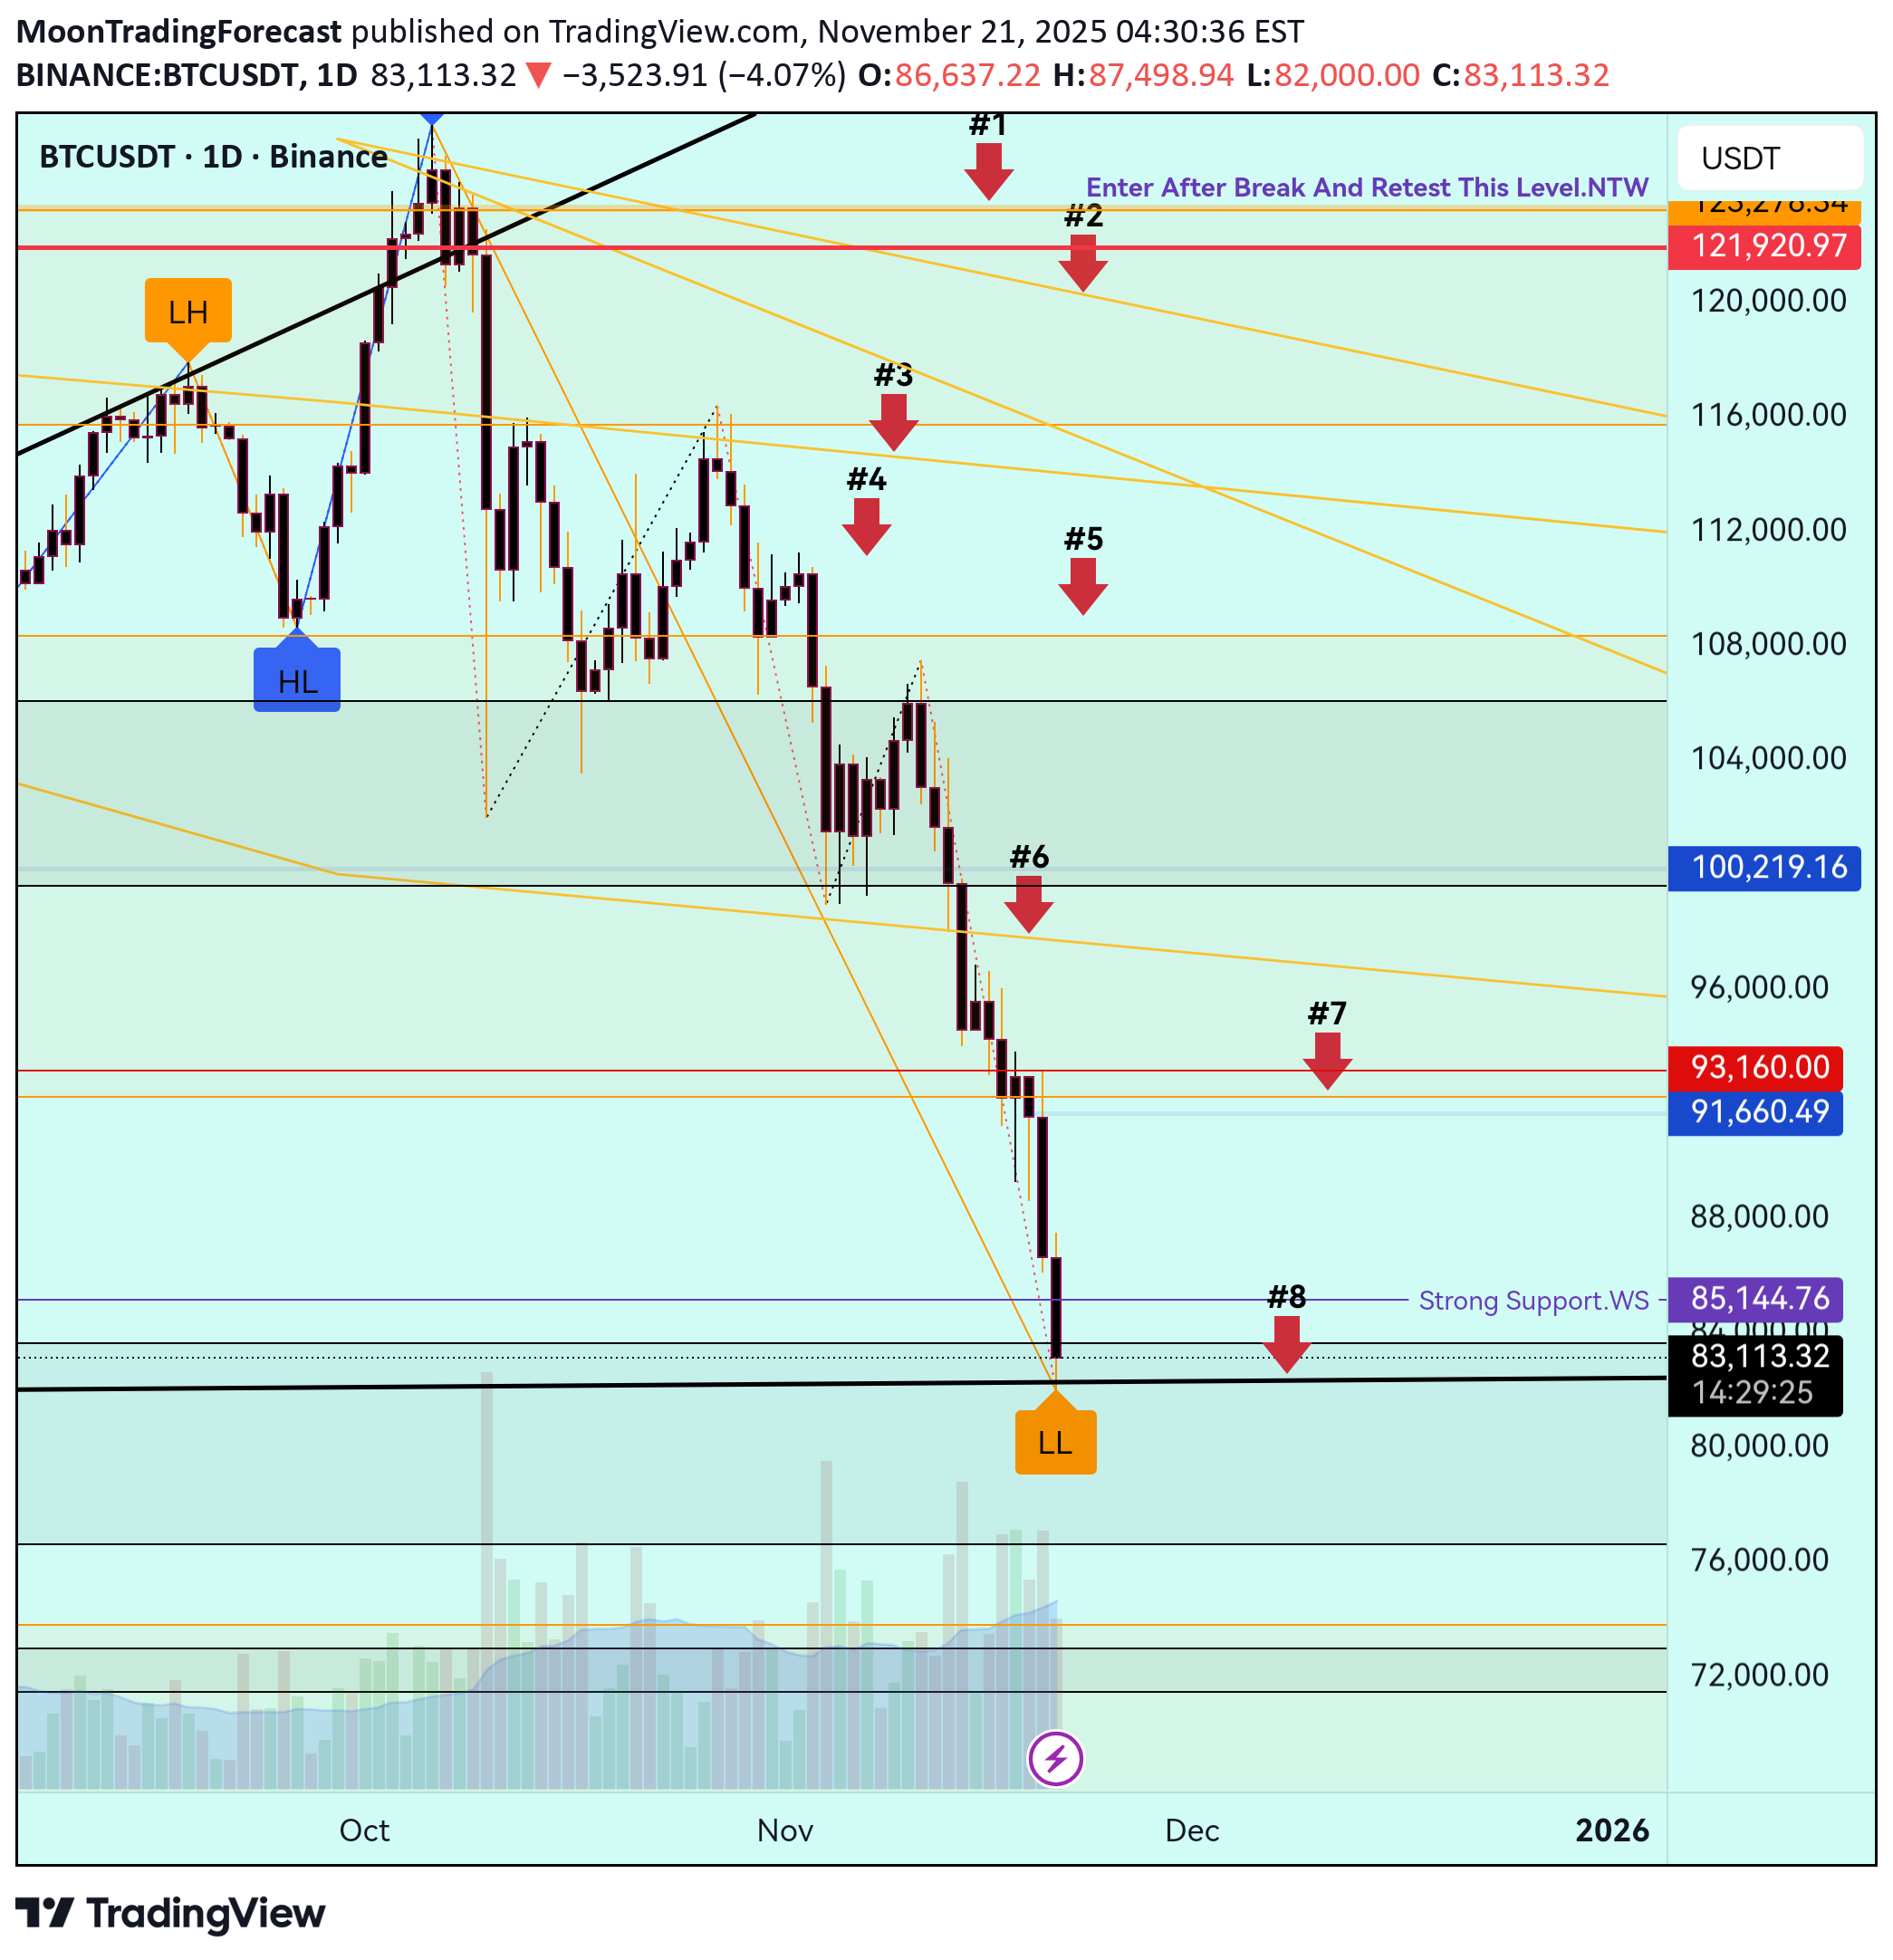
#BTC has now reached our Black Line Support Zone — a *crucial* level in the current market structure. This isn’t just any support; it’s based on the last significant Lower Low before Bitcoin broke its All-Time High and kicked off the new bullish trend. This area has historical strength, and buyers have previously stepped in aggressively here. If the structure holds, we can expect a strong bounce and renewed momentum from this zone. Stay focused, stay disciplined — these are the moments where patience pays. Let’s see how price reacts… the next move could be big. 💙
تحلیل فنی و سطوح کلیدی قیمت NXPChain (NXPC): رمزگشایی از مومنتوم و نقاط چرخش!
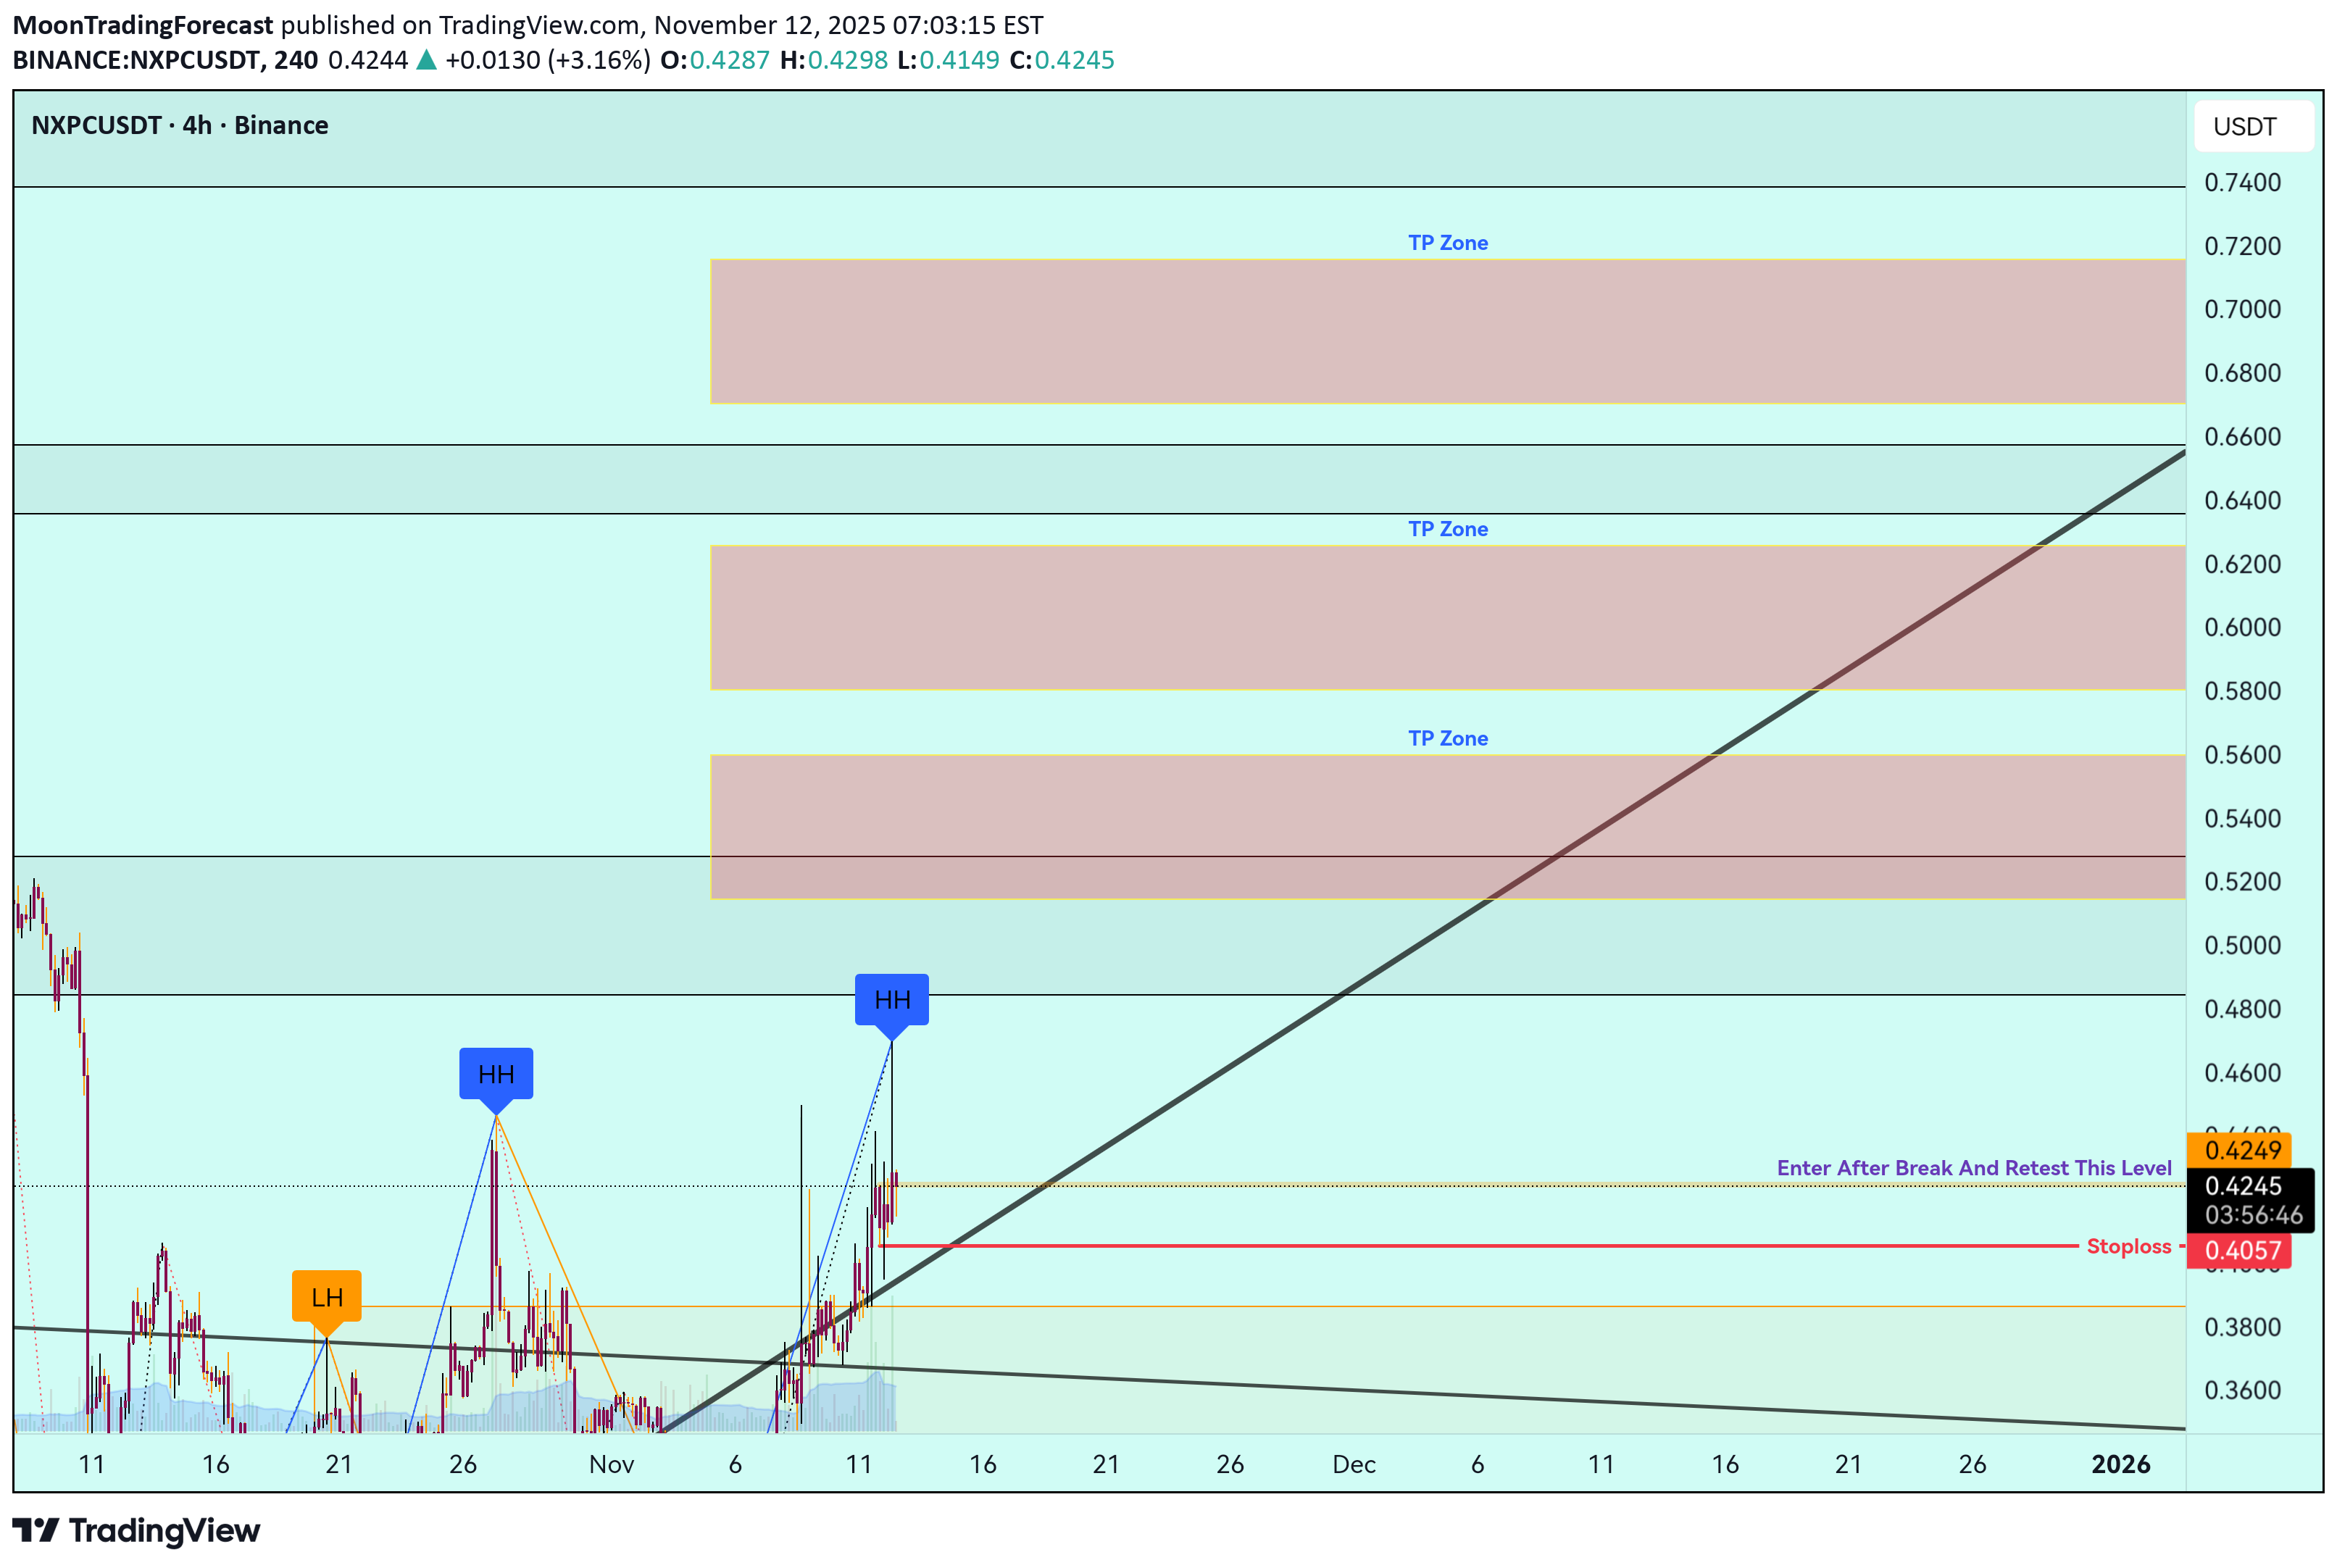
Description: NXPChain (NXPC) is a next-generation blockchain project focused on scalability and real-world utility, designed to support decentralized applications and cross-chain integration. The project aims to enhance transaction efficiency and network security through advanced consensus mechanisms. In this analysis, we focus on the current technical structure of NXPC, highlighting major support and resistance zones, RSI momentum, and trend confirmation signals based on recent price behavior. The chart indicates potential reversal and continuation patterns worth monitoring closely in the coming sessions. ⚠️ Disclaimer: This content is for educational and informational purposes only and does not constitute financial advice. Always conduct your own research and manage risk responsibly before making any trading decisions. #Crypto #NXPC #Blockchain #TechnicalAnalysis #CryptoTrading #PriceAction #RSI #ChartAnalysis #Altcoins #MarketTrends #SwingTrading #CryptoInvesting
بیت کوین در نقطه عطف! دو سناریوی حیاتی پیش روی BTC از امروز (۱۴ آبان)
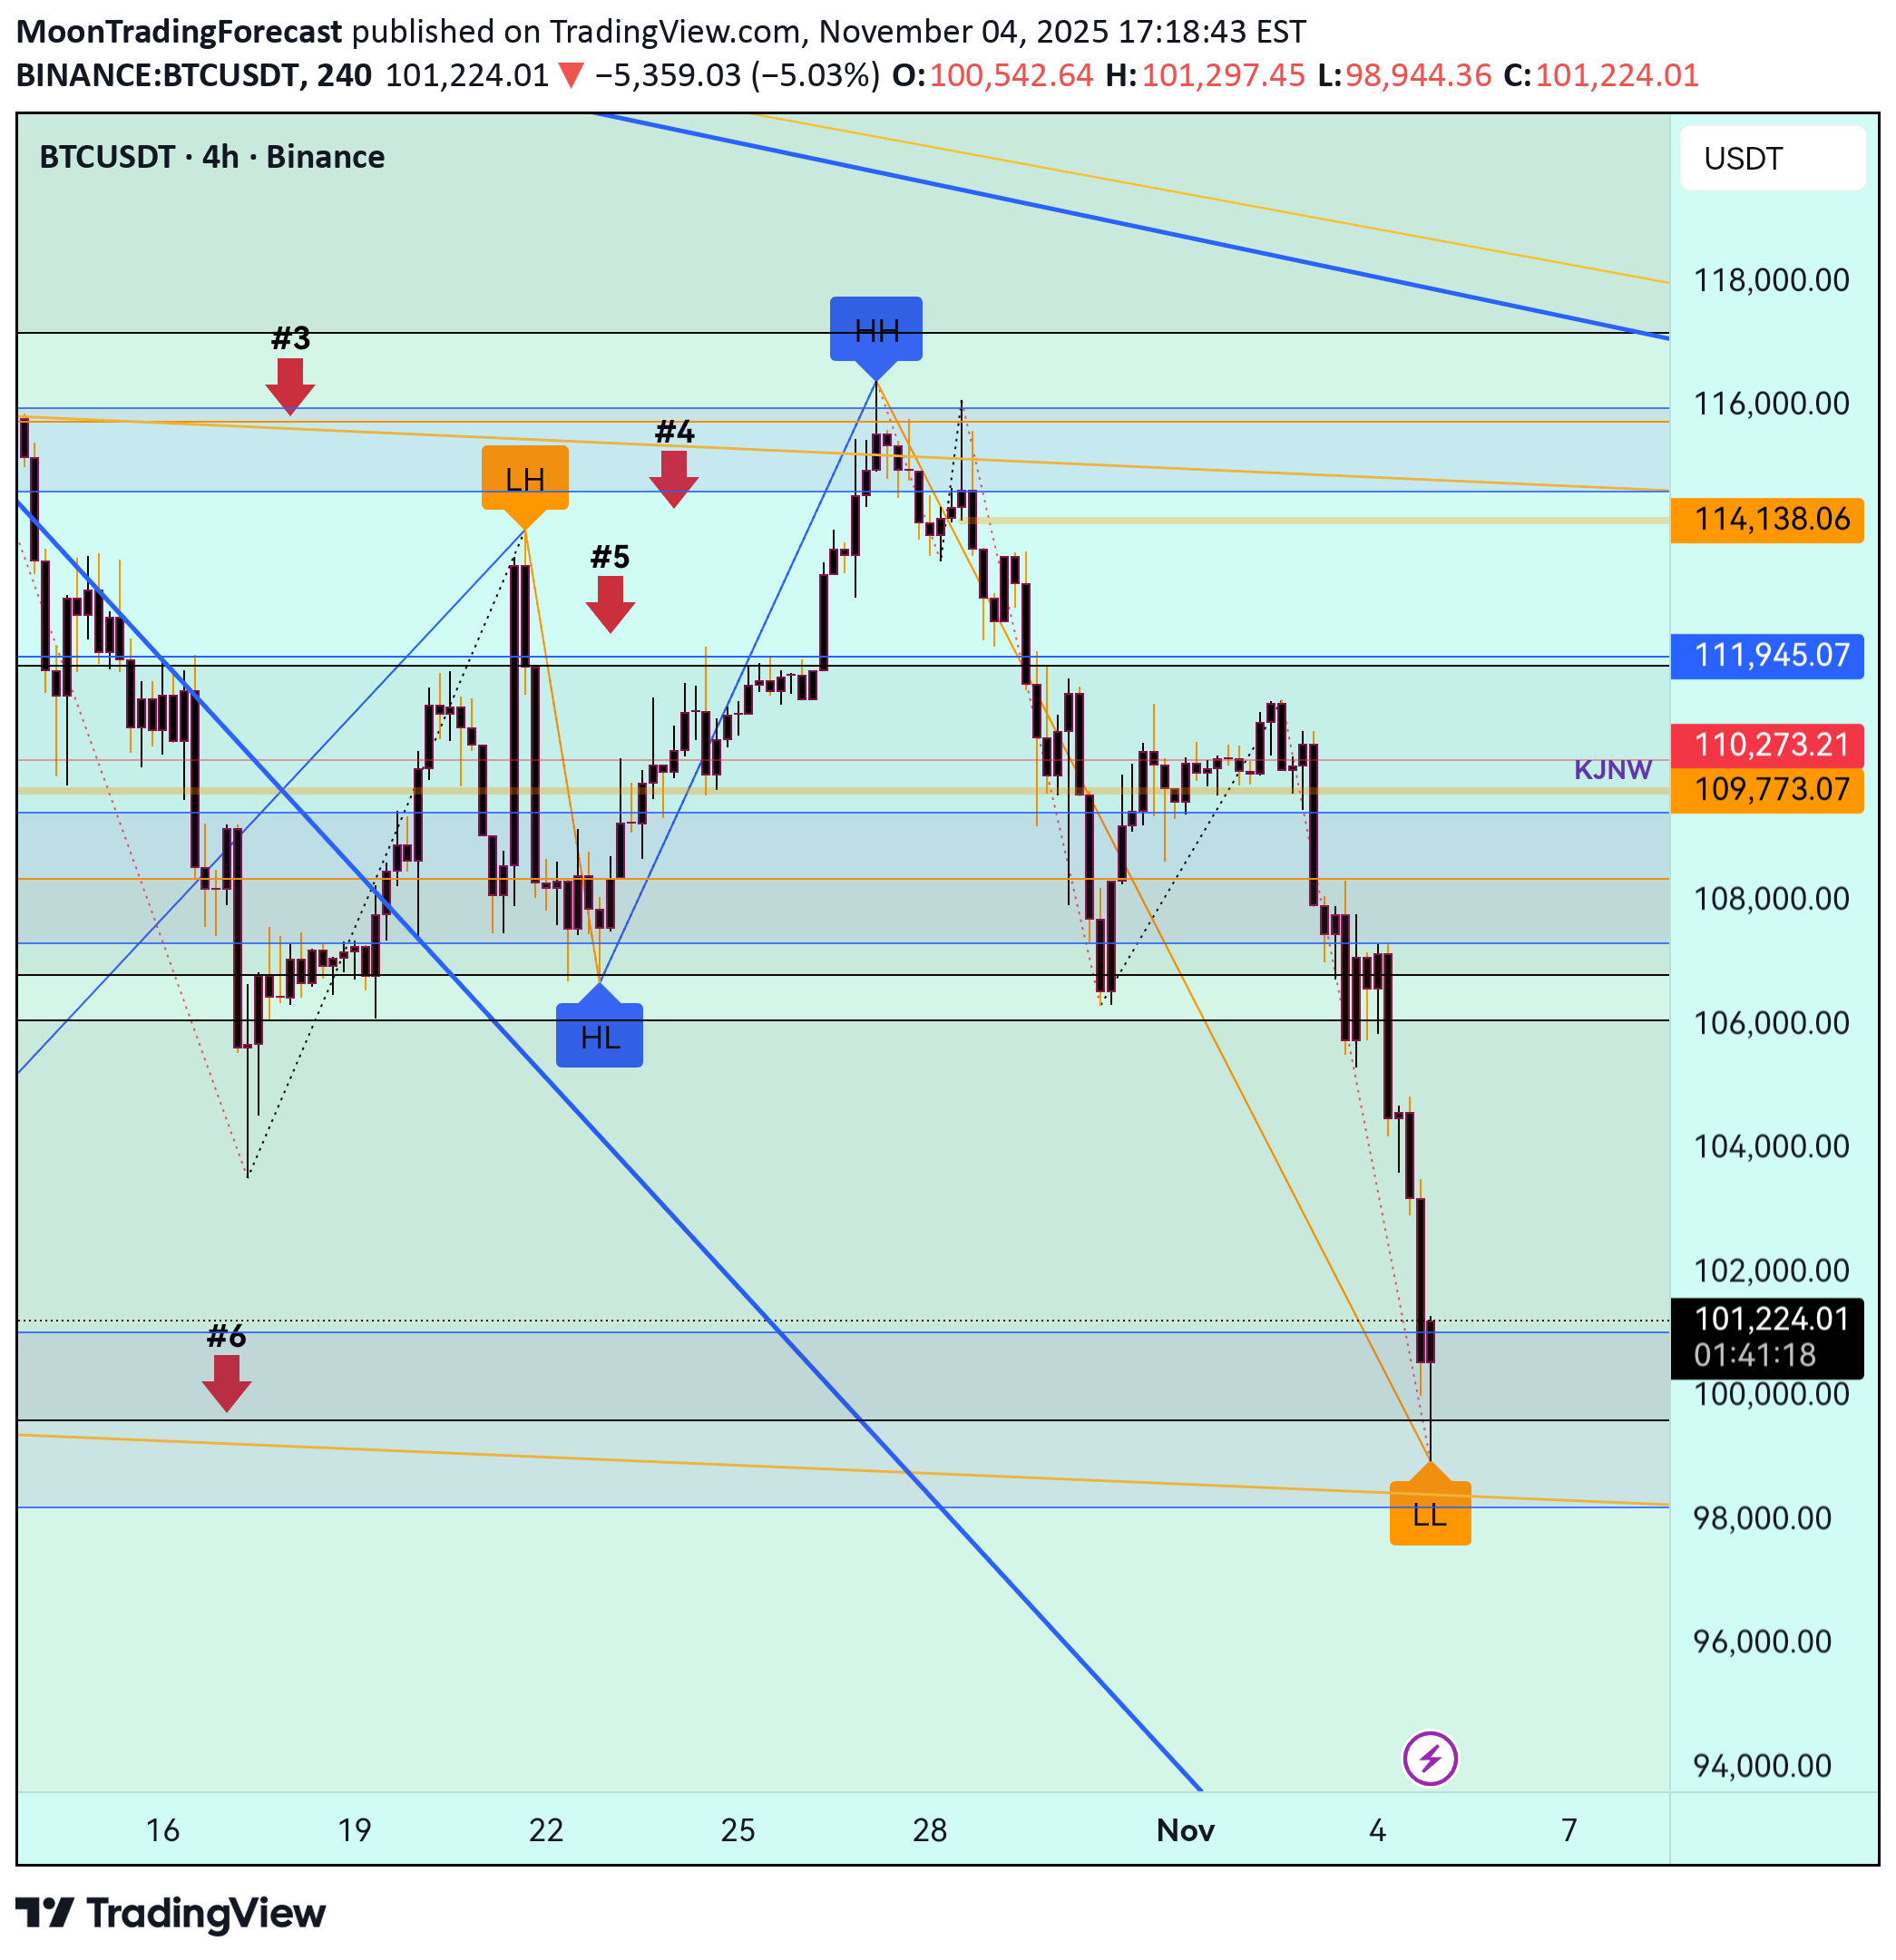
We’ve just reached Arrow #6 and touched the yellow line — a decisive zone I’ve been watching closely. From here, two major scenarios can unfold: 1️⃣ A deep retracement if the price fails to bounce back. 2️⃣ A potential trend reversal and a new buy opportunity if we see strong reversal confirmation. ⚠️ I’m personally waiting for clear confirmation before entering any new trades — patience here is key. 💪 Stay focused, stay disciplined — big moves often start from moments like this. Let’s see how #BTC reacts from this critical zone! #Crypto #Trading #Discipline
تحلیل تکنیکال و رازهای قیمتگذاری سهام انویدیا (NVDA): سطوح کلیدی و نقاط عطف حرکت بعدی!
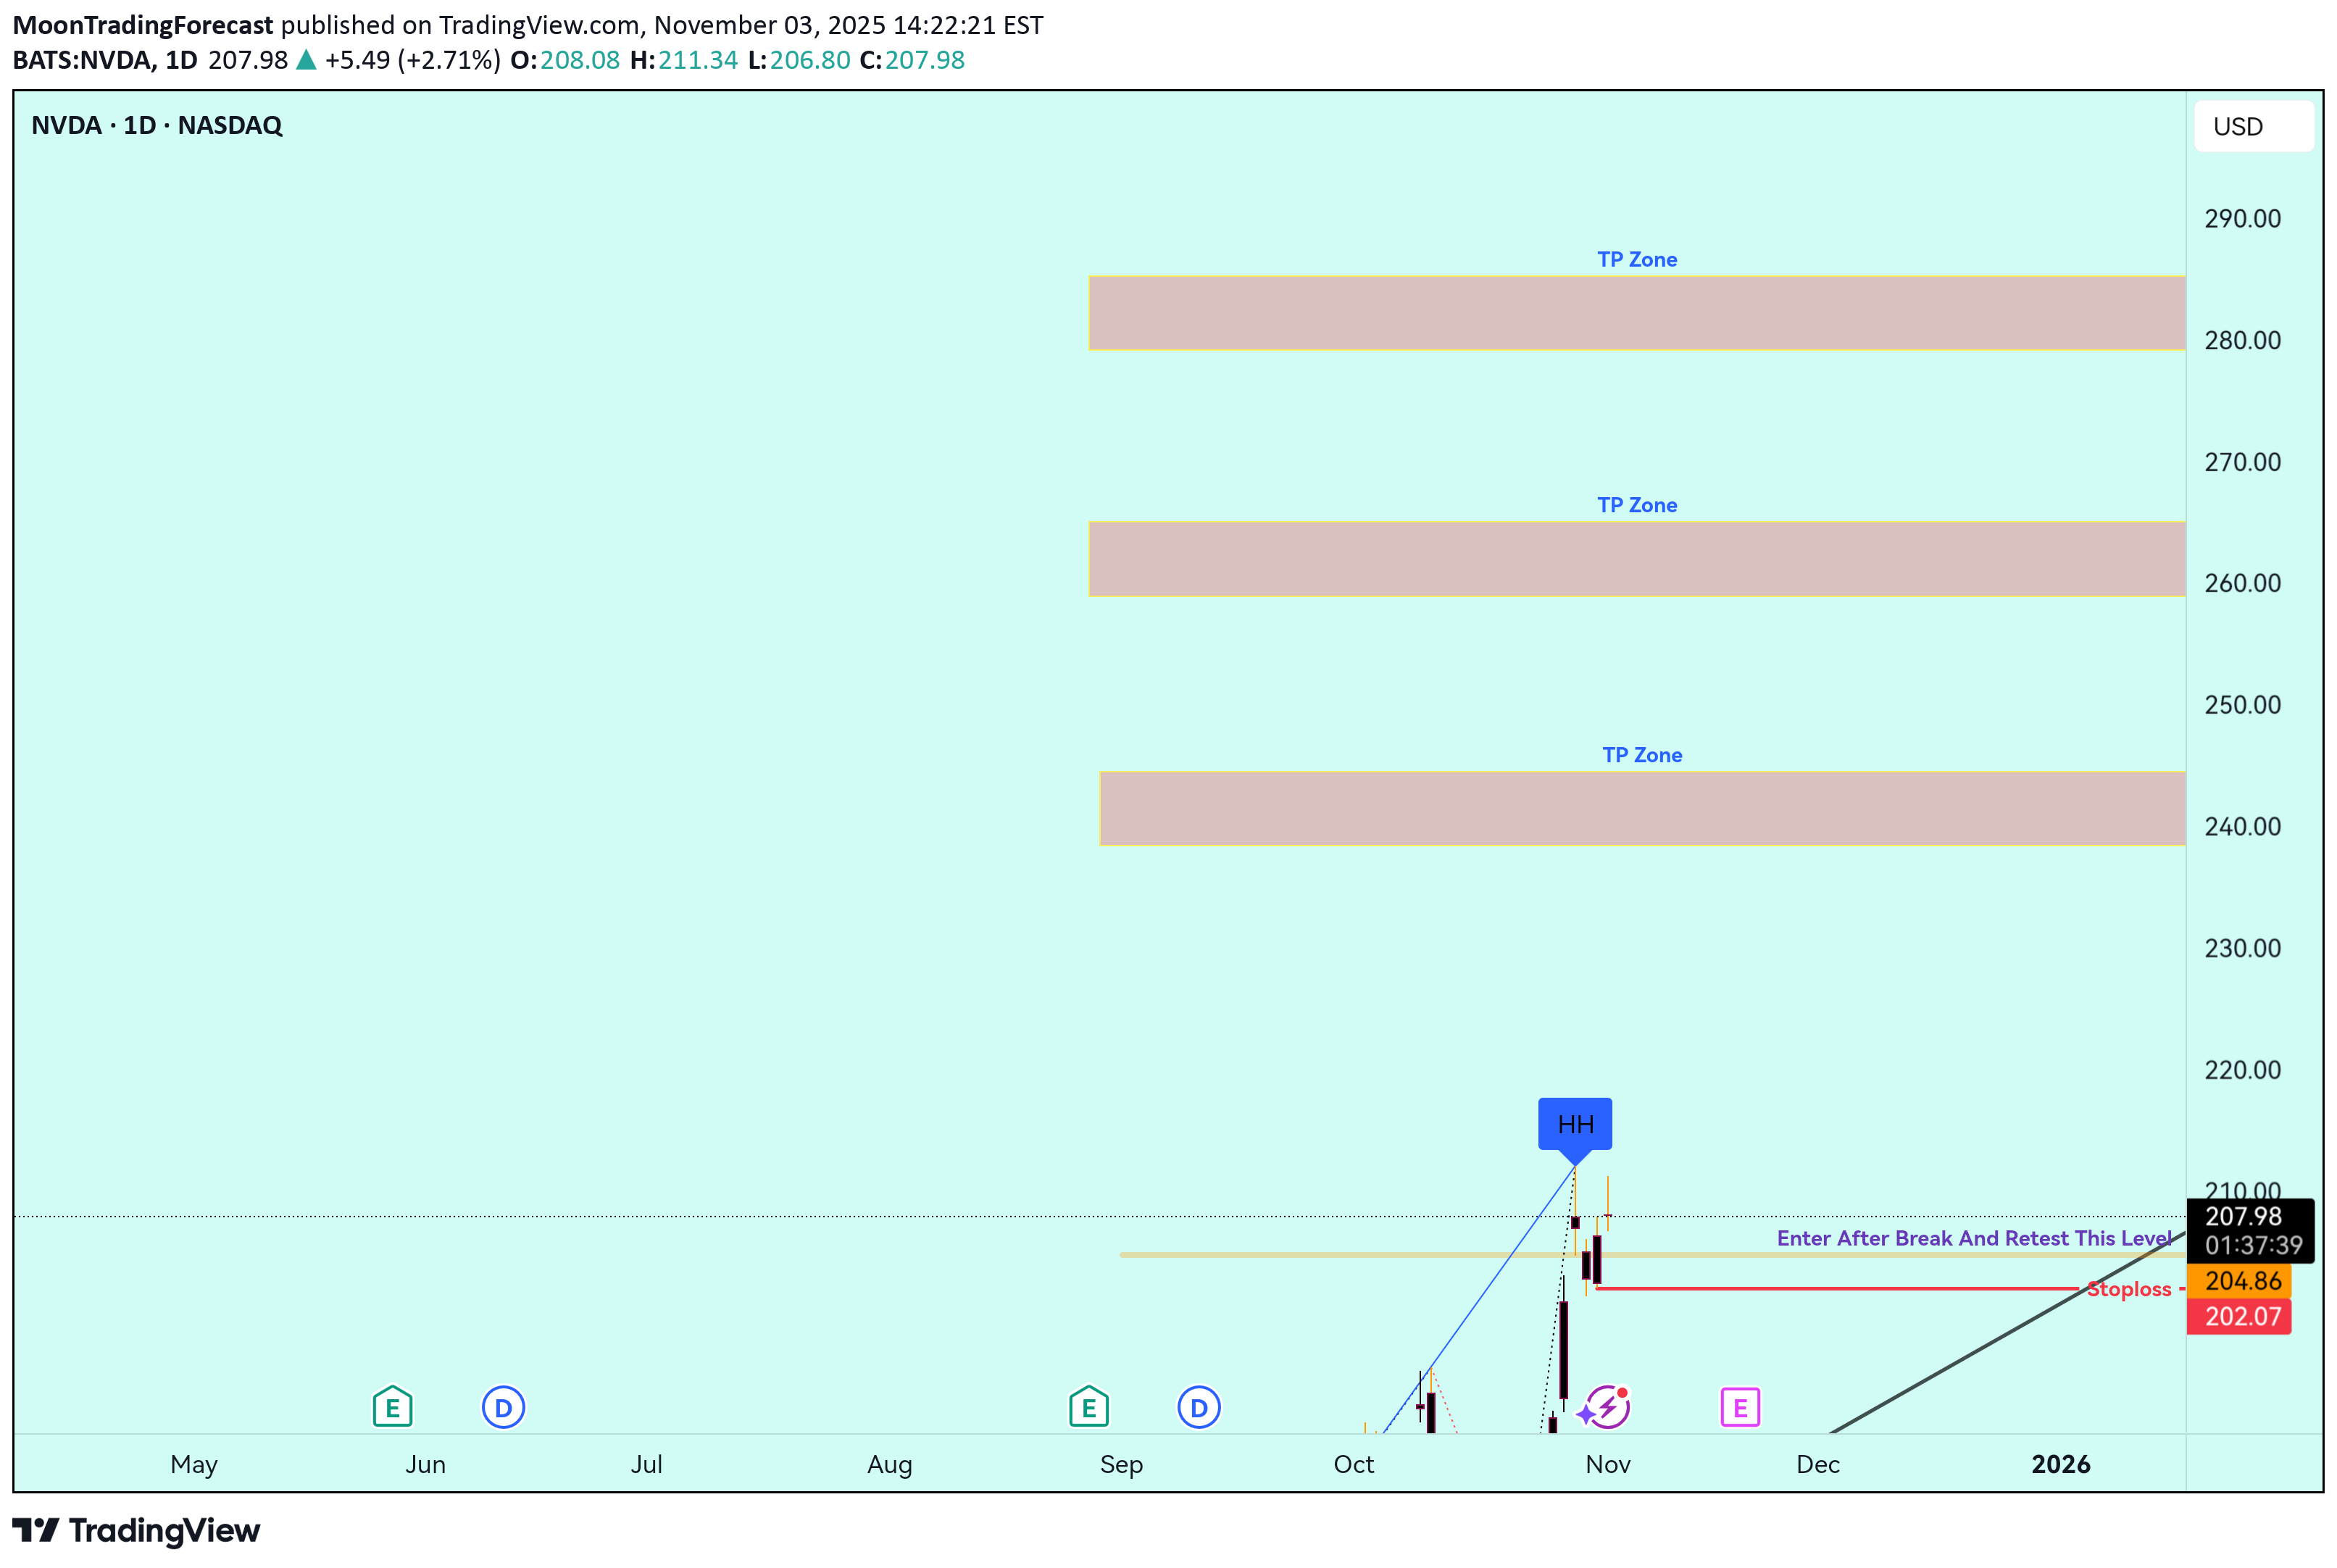
Description: NVIDIA Corporation (NASDAQ: NVDA) remains one of the most influential players in the AI and semiconductor sector, driving innovation across GPU, data center, and AI infrastructure markets. Despite short-term volatility, NVDA continues to attract institutional interest due to strong fundamentals, revenue growth, and leadership in AI-driven technology. In this analysis, I highlight key support and resistance levels, momentum shifts, and possible breakout zones based on price structure, RSI behavior, and volume confirmation. The chart focuses on identifying potential continuation or correction phases aligned with broader market sentiment. 📊 Key focus: Price action, RSI divergence, and volume dynamics 💡 Sector: Semiconductors / Artificial Intelligence / Tech Growth 💼 Ticker: NVDA | Exchange: NASDAQ ⚠️ Disclaimer: This is not financial advice. The content is for educational and informational purposes only. Always do your own research before making any investment or trading decision. #NVIDIA #NVDA #StockMarket #AI #Semiconductors #TradingView #TechnicalAnalysis #PriceAction #Investing #ChartAnalysis #RSI #NASDAQ #MomentumTrading #SwingTrading
بیت کوین دوباره خیز برداشت: آیا زمان چرخش فرا رسیده است؟ (سناریوهای صعودی و نزولی)

🚀 #BITCOIN is Once Again Attempting a Reversal! Here’s what we’re watching closely 👇 📈 Bullish Scenario: If Bitcoin manages to break above Arrow #3, #4, and #5, it could confirm a strong bullish breakout, signaling potential upside momentum and renewed market confidence. 📉 Bearish Scenario: If the price fails to break those levels, keep an eye on Arrow #6 — this could act as the next strong support zone where a possible rebound might start. ⚡️ If Bitcoin breaks above successfully, the next key resistance levels to watch are Arrow #1 and #2 — where the next major decision point awaits. 💪 Stay focused, stay disciplined — this is where patience and strategy pay off! #BTC #Crypto #Trading #Reversal #Breakout
تحلیل تکنیکال WAL: سطوح کلیدی و ساختار بازار؛ آماده جهش یا سقوط؟

Western Alliance Bancorporation (WAL) is a regional U.S. bank listed on the NYSE, known for serving commercial and real estate clients across the western states. The company’s fundamentals show stable earnings and moderate growth, though the stock remains sensitive to interest rate policy and financial sector sentiment. In this analysis, we review technical structure, price action, and potential breakout/reversal zones using multi-timeframe confluence, RSI momentum, and volume flow. The chart highlights areas of interest for both short-term and swing perspectives. 📊 Key Focus: Support–Resistance Dynamics, Trend Confirmation, RSI Divergence, and Volume Reaction Zones. ⚠️ Disclaimer: This content is for educational purposes only and does not constitute financial advice. Always perform your own due diligence before making investment decisions. #WAL #WesternAllianceBancorporation #Stocks #TechnicalAnalysis #TradingView #SwingTrading #MarketStructure #PriceAction #VolumeAnalysis #RSI #Breakout #Finance #Investing
تحلیل تکنیکال دش (DASH): رمزگشایی سطوح کلیدی و لحظه انفجار قیمتی!

💡 Description: DASH, one of the early privacy-focused cryptocurrencies, aims to provide fast and low-cost digital payments through its unique two-tier network and masternode system. Despite declining market attention compared to its peak years, DASH continues to maintain strong fundamentals in transaction efficiency and governance decentralization. In this analysis, I highlight potential breakout zones, trend structure, and dynamic support/resistance areas. Key price levels will determine whether DASH continues its short-term bullish momentum or faces rejection near the upper range. Volume confirmation and RSI divergence are closely monitored for validation. This setup is for educational and informational purposes only — not financial advice. Always do your own research and manage risk accordingly. #DASH #DASHUSDT #CryptoAnalysis #PriceAction #TechnicalAnalysis #BreakoutTrading #RSI #ChartPatterns #CryptoTrading #Altcoins #MarketStructure #TraderCommunity #TradingView
سقوط شوکهکننده بیت کوین به زیر ۱۰۰ هزار دلار: تحلیل امروز و سطوح کلیدی برای خرید مجدد!

🚨 #BTC Update | 12.10.2025 🚨 Bitcoin had a massive drop, making a deep wick near the 100K zone — a true disaster day for many traders with huge liquidations across the market 😬💥 As I mentioned in my previous analysis, once BTC lost the support at Arrow #1 and #2, the bullish momentum weakened, opening the door for a deeper retracement on the weekly timeframe. 📉 The weekly retracement zone was marked around 104,669, and guess what? — on Friday’s wick, price tapped it perfectly. 🎯 Now, the focus shifts to Arrow #3 and #4 — once the price breaks above these levels, we can look to re-enter buy positions confidently. ✅ Remember, on the bigger timeframes, the overall structure remains bullish, so this pullback could just be a healthy correction before the next leg up. 🚀 I expect a strong recovery move after Monday, which could confirm the breakout. Next up 👉 I’ll post the #BTC.D and #ETH analysis, so stay connected, stay patient, and trade smart! 💪🔥 #Bitcoin #Crypto #Trading #BTCAnalysis #SwingTrade
Disclaimer
Any content and materials included in Sahmeto's website and official communication channels are a compilation of personal opinions and analyses and are not binding. They do not constitute any recommendation for buying, selling, entering or exiting the stock market and cryptocurrency market. Also, all news and analyses included in the website and channels are merely republished information from official and unofficial domestic and foreign sources, and it is obvious that users of the said content are responsible for following up and ensuring the authenticity and accuracy of the materials. Therefore, while disclaiming responsibility, it is declared that the responsibility for any decision-making, action, and potential profit and loss in the capital market and cryptocurrency market lies with the trader.