
Grey_SB
@t_Grey_SB

What symbols does the trader recommend buying?
Purchase History
پیام های تریدر
Filter
Grey_SB
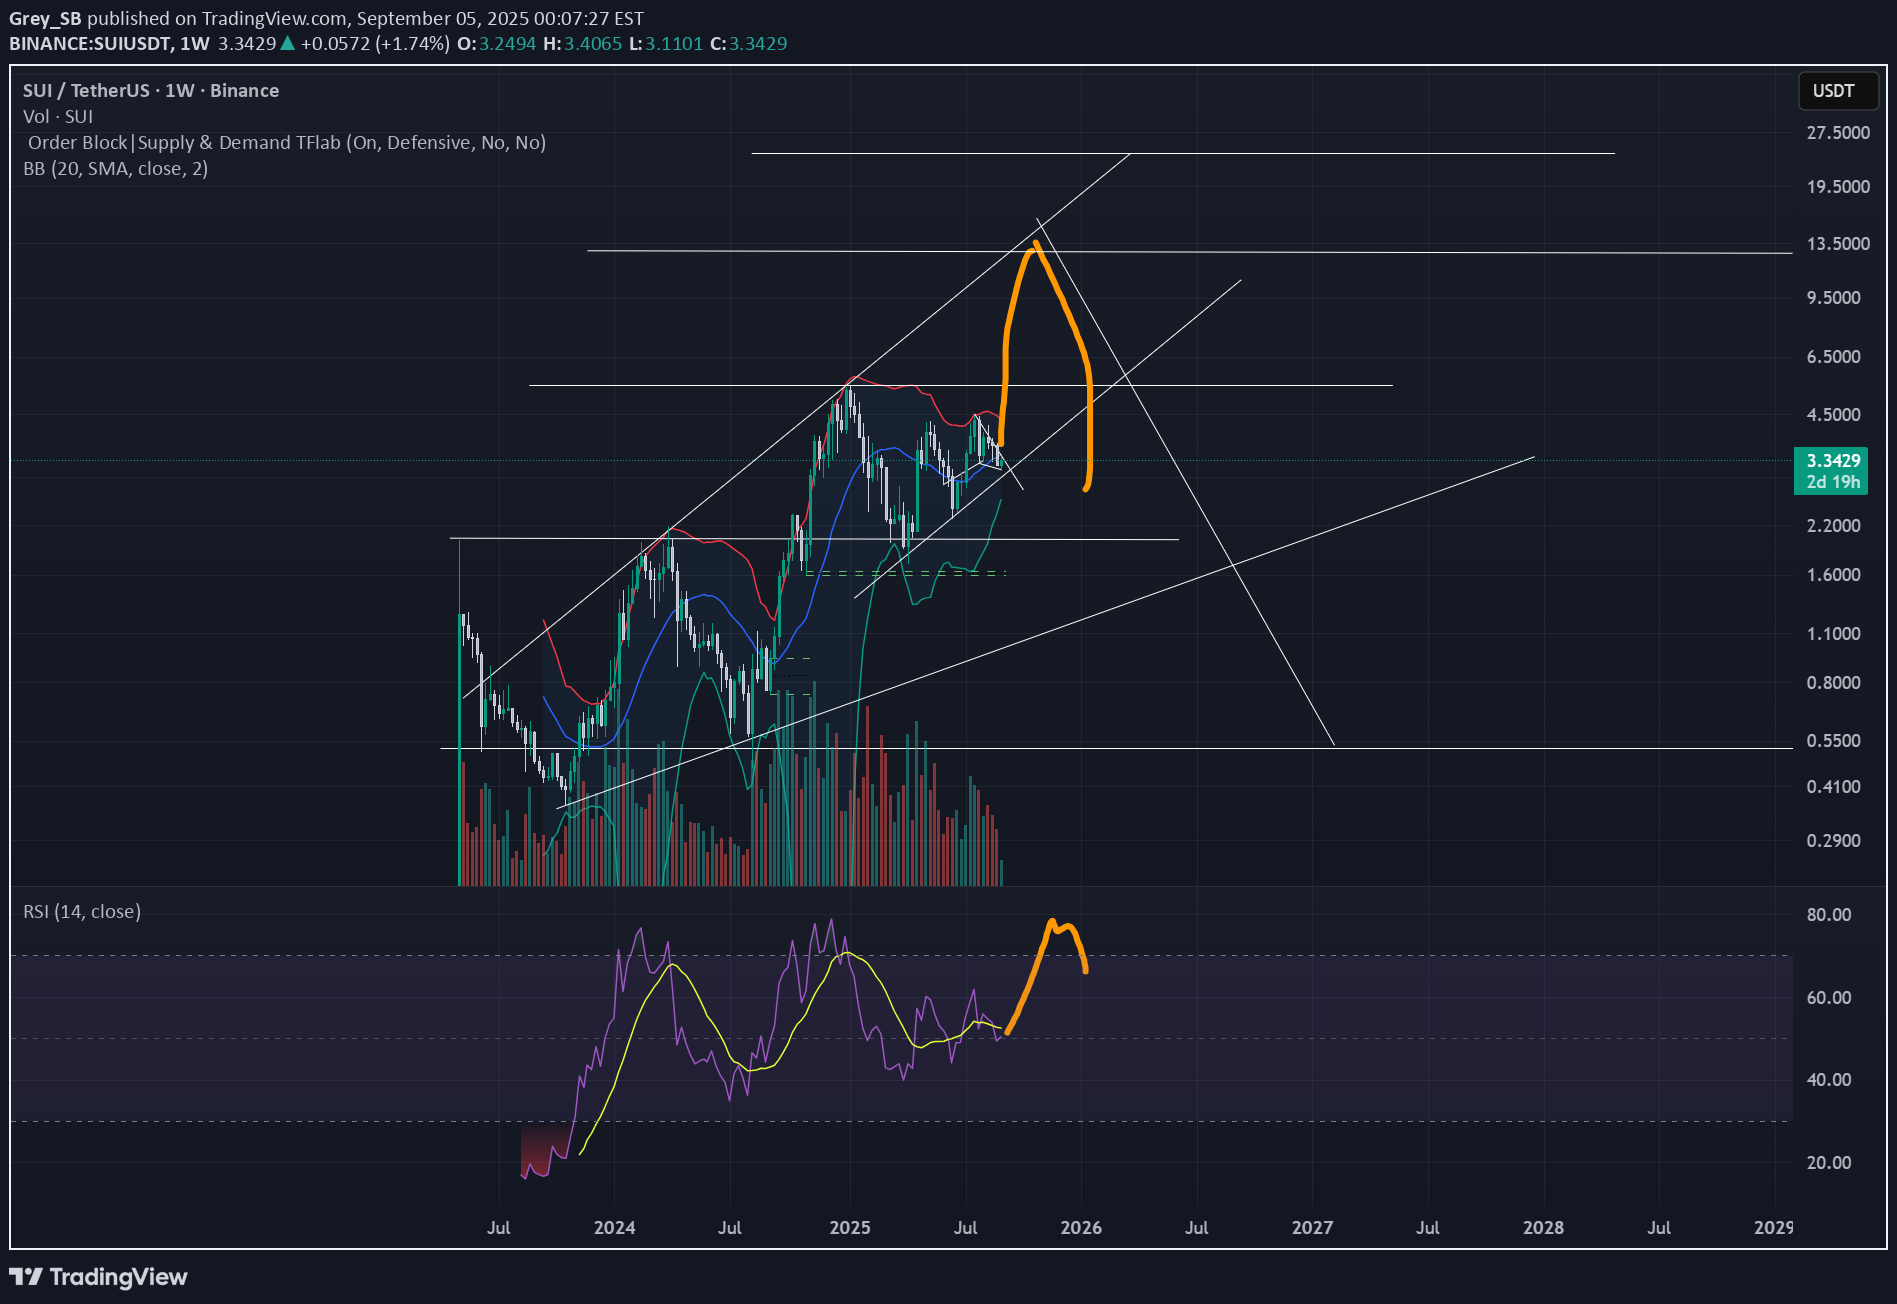
SUI W back test consolidation could be time for a parabolic move

SUI W back test consolidation could be time for a parabolic move When you go deep into a W it allows for conformation on price lower were able to test, the higher we can go after. Now we have cleared the levels we are clean to find new high and potentially fast. Good luck i see this playing out fingers crossed if BTC behaves. Also good indication on MACD and RSI. There is LOT OF ROOM ON THE RSI TO THE UPSIDE
Grey_SB
Grey_SB
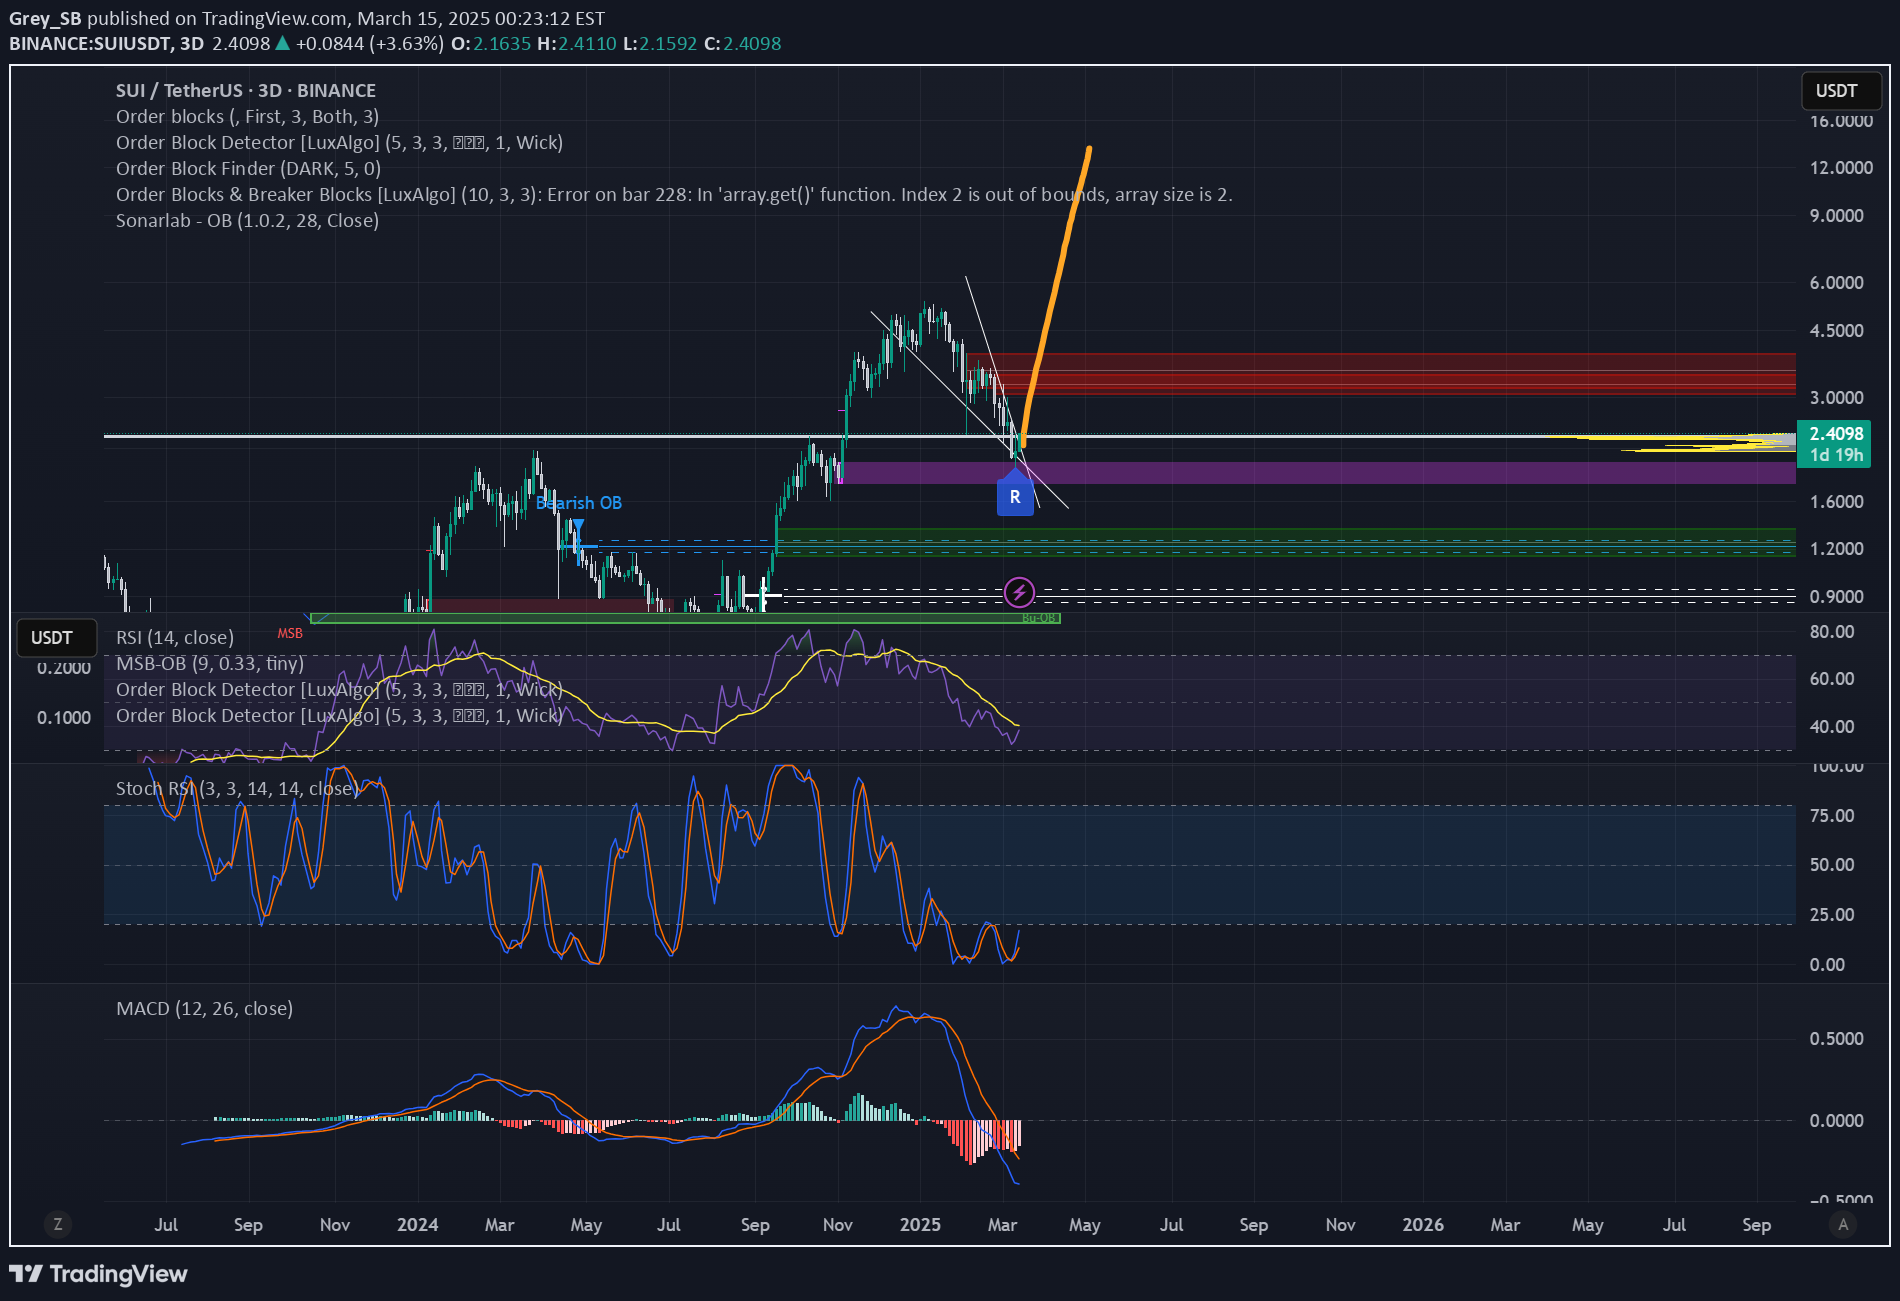
Pre-emptive W pattern
W pattern forming double bottom here then send to $12 that simple potentially down to $2.30 - $2.50 max pain then if not here onwards and at 4 we tab off for the W and then boom rocket town. Buckel up this is what I think, SUI loves W's DYOR I spoke to the one of the CO founders in an interview and everything is pointing towards this....
Grey_SB
WALRUS

SIDEWAYS then $1 Bullish Divergence's everywhere looks good key support should be departing for new ATH's no return zones almost done with
Grey_SB
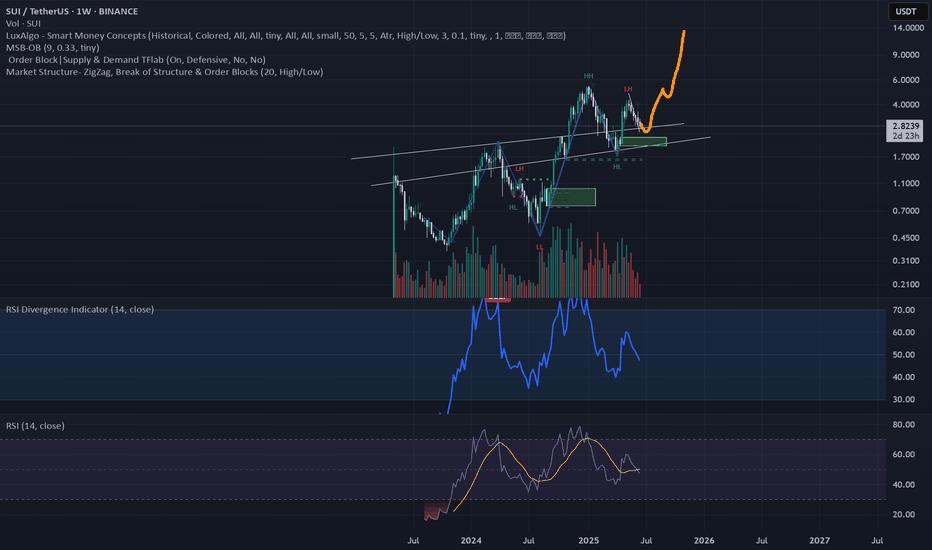
W back Test impulsive move to ATH on SUI

Grey_SB
Invalidated M pattern and a Tripple Bottom with W pa to finish.

Invalidated M pattern and a Tripple Bottom with W pattern to finish. Looks bullish to me, 144 million raised at 0.40 cents give or take in the bull with sui on a run I would say the likely hood for an impulse breakout of W is high because the price has already reached above the neckline for a 4th break to the downside, I would say the triple bottom is confirmed by ending in a double bottom. SUI WAL
Grey_SB
W back test explosive run
W back test explosive run due, long, is very clear and plays out a lot in bullish scenario
Grey_SB
SEI is going to everyone looks like i hope not, but ...

IT's clear this crypto is going to M very similar to WIF chart and that went and just liquidated everyone, this TOKEN seems as thought it was made just to liquidate not bullish on this token, i hope it doesn't but it's obvious what this token was made for. Seen this play out too many time this will not hold and will fall out and take out all newbies that longed it like myself hahaha should of cut it ages ago
Grey_SB
Bearish Div plus lots of unfilled orders

Bearish Div, left over orders and liquidity, looks like it is more interest to go lower than higher now that's just my take from what i see. could be wrong. wait for entry for a long at these levels 3.05 looks like the safest levels i have orders from 3.16 down to 2.95 as it moves so fast at the moment.
Grey_SB

Disclaimer
Any content and materials included in Sahmeto's website and official communication channels are a compilation of personal opinions and analyses and are not binding. They do not constitute any recommendation for buying, selling, entering or exiting the stock market and cryptocurrency market. Also, all news and analyses included in the website and channels are merely republished information from official and unofficial domestic and foreign sources, and it is obvious that users of the said content are responsible for following up and ensuring the authenticity and accuracy of the materials. Therefore, while disclaiming responsibility, it is declared that the responsibility for any decision-making, action, and potential profit and loss in the capital market and cryptocurrency market lies with the trader.