
VIC
Viction
| تریدر | نوع سیگنال | حد سود/ضرر | زمان انتشار | مشاهده پیام |
|---|---|---|---|---|
No results found. | ||||
Price Chart of Viction
سود 3 Months :
سیگنالهای Viction
Filter
Sort messages by
Trader Type
Time Frame

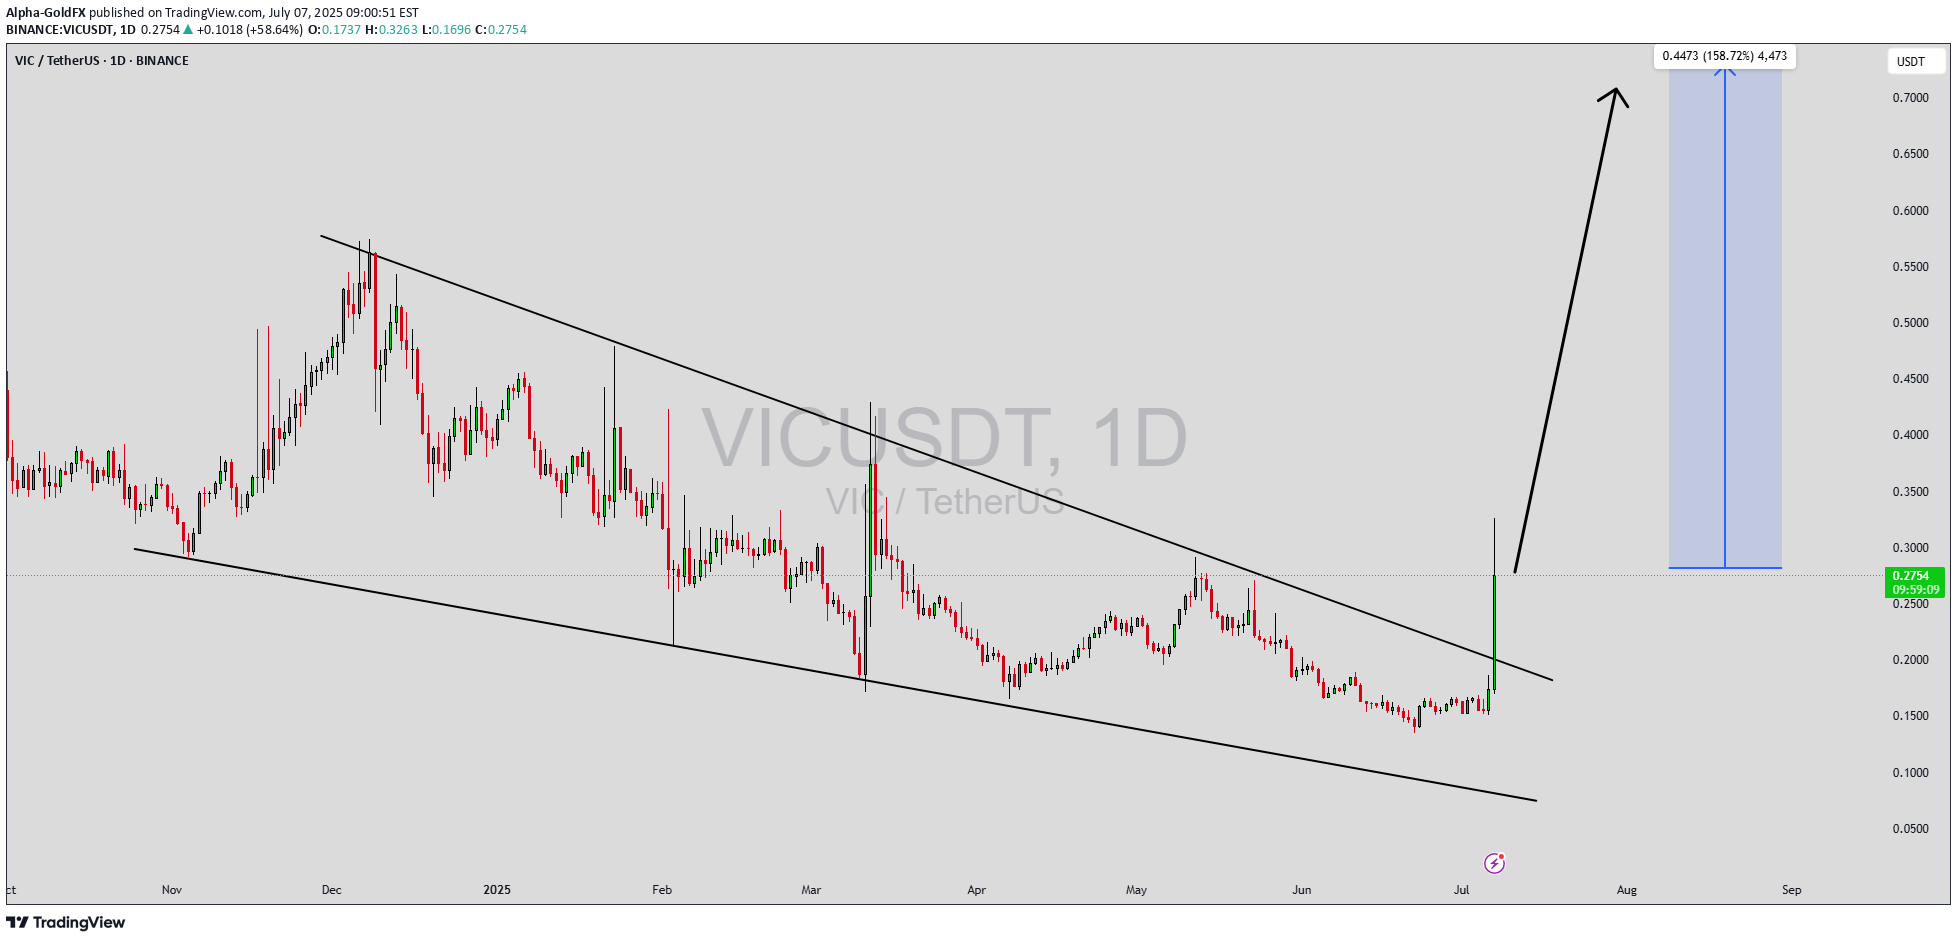
Alpha-GoldFX
VICUSDT Forming Descending Channel

VICUSDT is currently showing a classic descending channel pattern, which often signals a potential bullish reversal upon breakout. After a sustained downtrend, the price appears to be stabilizing and respecting the lower boundary of the channel, while volume remains healthy. This combination of falling price within a defined channel and consistent volume is often a precursor to an explosive breakout. A breakout above the upper resistance line of this descending structure would validate a trend reversal and trigger a wave of bullish momentum. What makes VICUSDT particularly compelling is the aggressive profit potential of 140% to 150%+. This high reward expectation aligns with typical breakouts from descending channels, especially when paired with strong investor interest and favorable market conditions. The technical setup suggests that the asset is currently undervalued, and any breakout move could quickly be followed by a sharp rally as buyers rush to capitalize on the momentum. Recent market sentiment around VICUSDT has turned positive, with increasing attention from retail traders and investors alike. As capital rotates into mid-cap altcoins showing strong breakout formations, VIC is positioned to benefit significantly. Traders should closely watch for confirmation of a breakout with strong candle closes above the upper trendline and rising volume. That would be the green light for entering long with a well-defined risk. This is a prime candidate for traders who prefer breakout setups and are seeking high-risk, high-reward opportunities. Given the technical indicators, volume support, and increasing investor interest, VICUSDT could be one of the most explosive plays in the coming sessions. ✅ Show your support by hitting the like button and ✅ Leaving a comment below! (What is You opinion about this Coin) Your feedback and engagement keep me inspired to share more insightful market analysis with you!
Alpha-GoldFX
VICUSDT Forming Descending Wedge

VICUSDT is currently displaying a classic descending wedge pattern, which is often recognized as a bullish reversal signal in technical analysis. This pattern typically emerges after a prolonged downtrend, and when paired with good volume — as we’re now seeing — it suggests that selling pressure is weakening and a breakout to the upside could be imminent. VIC has respected its wedge boundaries well, and now it's approaching the breakout zone, making this an ideal time for technical traders to watch closely. Volume has been steadily increasing, which supports the idea of accumulation at the current levels. This convergence of price and volume dynamics signals that smart money may be positioning itself ahead of a potential rally. Based on the measured move from this wedge pattern, a 140% to 150% gain could be on the horizon once confirmation of breakout is secured. The price is also hovering near historical support, which adds another layer of confluence to the bullish outlook. With investor interest rising and sentiment shifting, VICUSDT has the potential to outperform in the coming sessions. Altcoins that consolidate in well-defined reversal patterns and attract volume are often primed for explosive moves. Traders looking for setups with strong technical structure, breakout confirmation, and momentum alignment may find VICUSDT to be one of the top candidates for mid-term gains. This is a high-reward opportunity for patient and disciplined traders. Keep an eye on resistance breakout levels and volume surges, as they may trigger the start of a powerful trend reversal. ✅ Show your support by hitting the like button and ✅ Leaving a comment below! (What is You opinion about this Coin) Your feedback and engagement keep me inspired to share more insightful market analysis with you!
Alpha-GoldFX
VICUSDT Forming Bullish Wave

VICUSDT is currently exhibiting a powerful bullish wave pattern that could signal the beginning of a significant upward move. After a period of consolidation and corrective decline, the price has begun to carve out a series of higher highs and higher lows—often a precursor to explosive momentum. The volume profile also aligns with this structure, showing increased interest from buyers who seem to be positioning ahead of a breakout. This pattern often aligns with Elliott Wave Theory’s impulsive leg, suggesting a sharp upside move could soon unfold. Technically, VICUSDT is showing signs of entering a new bullish phase. With a potential breakout already brewing, this asset could see an impressive gain of around 140% to 150% if current momentum continues. Traders should pay attention to resistance breakouts and volume surges, as these will be key confirmations of the wave pattern's validity. The bullish wave formation indicates not just a short-term pump, but the possibility of sustained upward movement in line with broader market recovery. Investor sentiment is steadily improving around the VICUSDT project. Increased trading volume and stronger community buzz suggest that accumulation is underway, potentially ahead of major catalyst events or market-wide bullishness. This aligns well with technical projections, making VICUSDT a high-risk, high-reward opportunity for traders watching for altcoin season setups. In a market driven by momentum and wave-based patterns, VICUSDT stands out with a structure that supports a strong continuation. Traders and investors alike should keep a close eye on this pair, as the technicals align for a breakout scenario that could exceed expectations. ✅ Show your support by hitting the like button and ✅ Leaving a comment below! (What is You opinion about this Coin) Your feedback and engagement keep me inspired to share more insightful market analysis with you!

weslad
Vicusdt buy opportunity

VICUSDT broke out of a falling wedge but encountered strong resistance at the supply zone, leading to a pullback for a potential retest of the wedge structure. The plan is to re-accumulate within the highlighted zone and monitor price action as it progresses toward the outlined targets on the chart.

bakbak88
vicusdt falling wedge trying to breakout
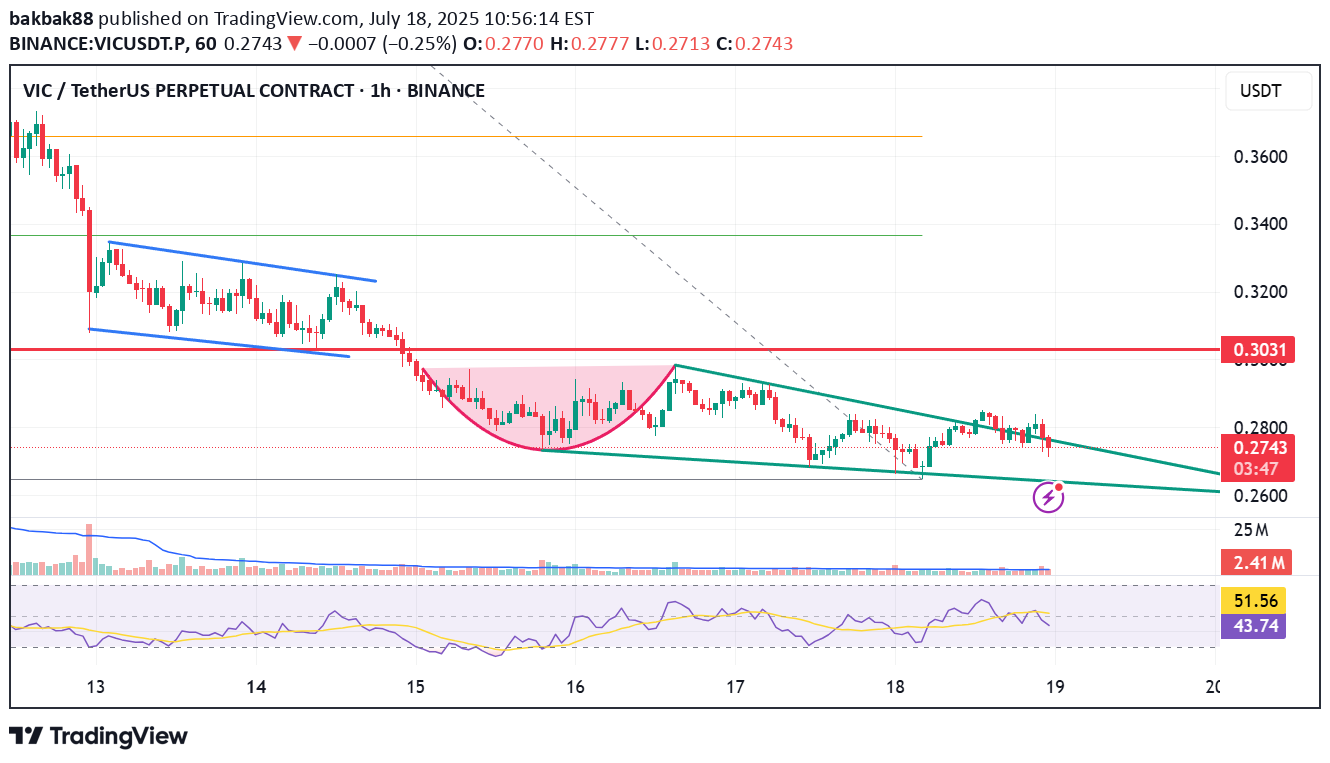
vicusdt (previously known as tomochain), currently is doing falling wedge pattern trying to breakout. initially trying do a round bottom to breakout but eventually failed, and currently formed falling wedge to do reversal and change the behavior.

SupertradeOfficial
VICUSDT 15-Minute Technical Analysis With 2:1 Reward
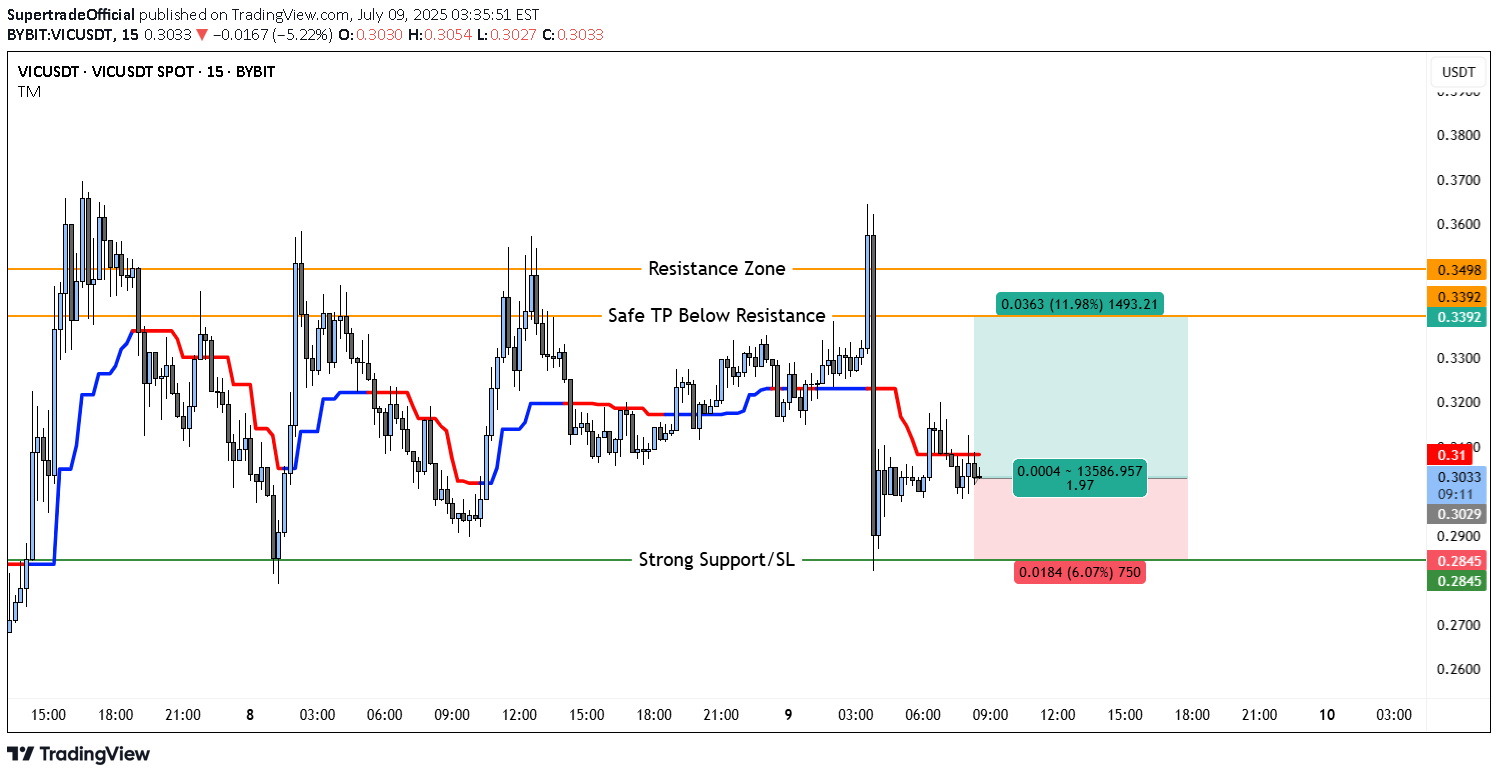
This chart shows a clear range-bound market, with price oscillating between a strong support and a well-defined resistance zone. Overall, momentum has been choppy, and frequent reversals are visible.Support and ResistanceAt the top of the chart, you have the Resistance Zone marked at 0.3498 USDT. This level has been tested multiple times and rejected. Each attempt to close above this area resulted in sharp selling pressure, confirming it as a significant ceiling for price action.A slightly lower level, labeled Safe Take Profit, is set at 0.3392 USDT. This is a strategic target that allows traders to secure gains before price collides with the stronger resistance.The lower part of the range is defined by Strong Support around 0.2845 USDT. This support level has been respected after previous sell-offs, showing that buyers have consistently defended this zone.Trend and StructureMarket structure is consolidative. Price has printed lower highs over several sessions, but at the same time, it has held onto higher lows closer to the support. This compression indicates an upcoming breakout, either toward the resistance or through the support.Short-term momentum is indecisive. The colored moving average ribbon you applied (likely a Supertrend or fast EMA) flips repeatedly between red and blue, showing the market has no persistent trend.A notable volatility spike occurred during one of the recent candles, sweeping the lows and immediately rebounding—classic behavior near strong support. This long wick suggests that some stop-loss liquidity was taken, and buyers reacted swiftly to reclaim the level.Volume ConsiderationsAlthough the chart doesn’t show volume, it is reasonable to assume there was a volume surge during those sharp wicks, which typically precedes either a reversal or acceleration. Before entering a trade, confirming volume is critical for validation.Current Price BehaviorThe current price (~0.3028 USDT) is stuck below the mid-range, facing hesitation. The moving averages have flattened. This is a textbook sign that the market is accumulating orders in preparation for the next decisive move.Trade IdeaBelow is a simple, clear trade idea you can consider, with bullets for clarity:•Entry: Near 0.3028 USDT, ideally after a bullish confirmation candle that closes above recent small consolidation.•Take Profit: The Safe TP level at 0.3392 USDT, positioned just under resistance.•Stop Loss: Just below the Strong Support at 0.2845 USDT.•Risk/Reward Ratio: Approximately 2:1. This offers reasonable upside relative to the risk.This setup is effective only if price holds above the support and begins to trend higher. If price fails to sustain above 0.30, it could signal a deeper retest of support.Scenarios to WatchIf you are trading this setup, it’s important to watch for three potential outcomes.In the bullish scenario, price holds above ~0.300 and forms a higher low. A strong bullish candle closing near 0.31 or higher would add confirmation. If this happens, the path to 0.3392 becomes more likely, and possibly even to the full resistance zone at 0.3498.In the bearish scenario, price loses the support at 0.2845 decisively. A clean close below this level opens up downside risk, possibly accelerating liquidations from trapped long positions.In a consolidation scenario, price remains compressed between ~0.295 and ~0.315. If this happens, patience is necessary until a breakout confirms direction.Execution TipsWhen you plan to enter this trade, consider the following:If you enter near 0.303, monitor the next 2–3 candles carefully. You want to see buyers stepping in with higher lows and a steady move toward 0.32. If price instead hovers sideways or moves lower, be prepared to exit quickly to protect capital.Avoid moving your stop loss further down if the trade moves against you. This is a common mistake that often leads to larger losses.Scaling out partial profit before the final target is a smart tactic. For example, consider closing 50% of your position near 0.325 if the price shows signs of hesitation.SummaryYour VICUSDT 15m chart reveals a clean trading range between 0.2845 and 0.3498. The market has no clear trend, but the setup you highlighted can work if buyers confirm strength above 0.30. The plan combines a relatively tight stop, a realistic target under resistance, and a favorable risk/reward profile.

Saitamasignal
SHORT TRADE SIGNAL - VIC/USDT
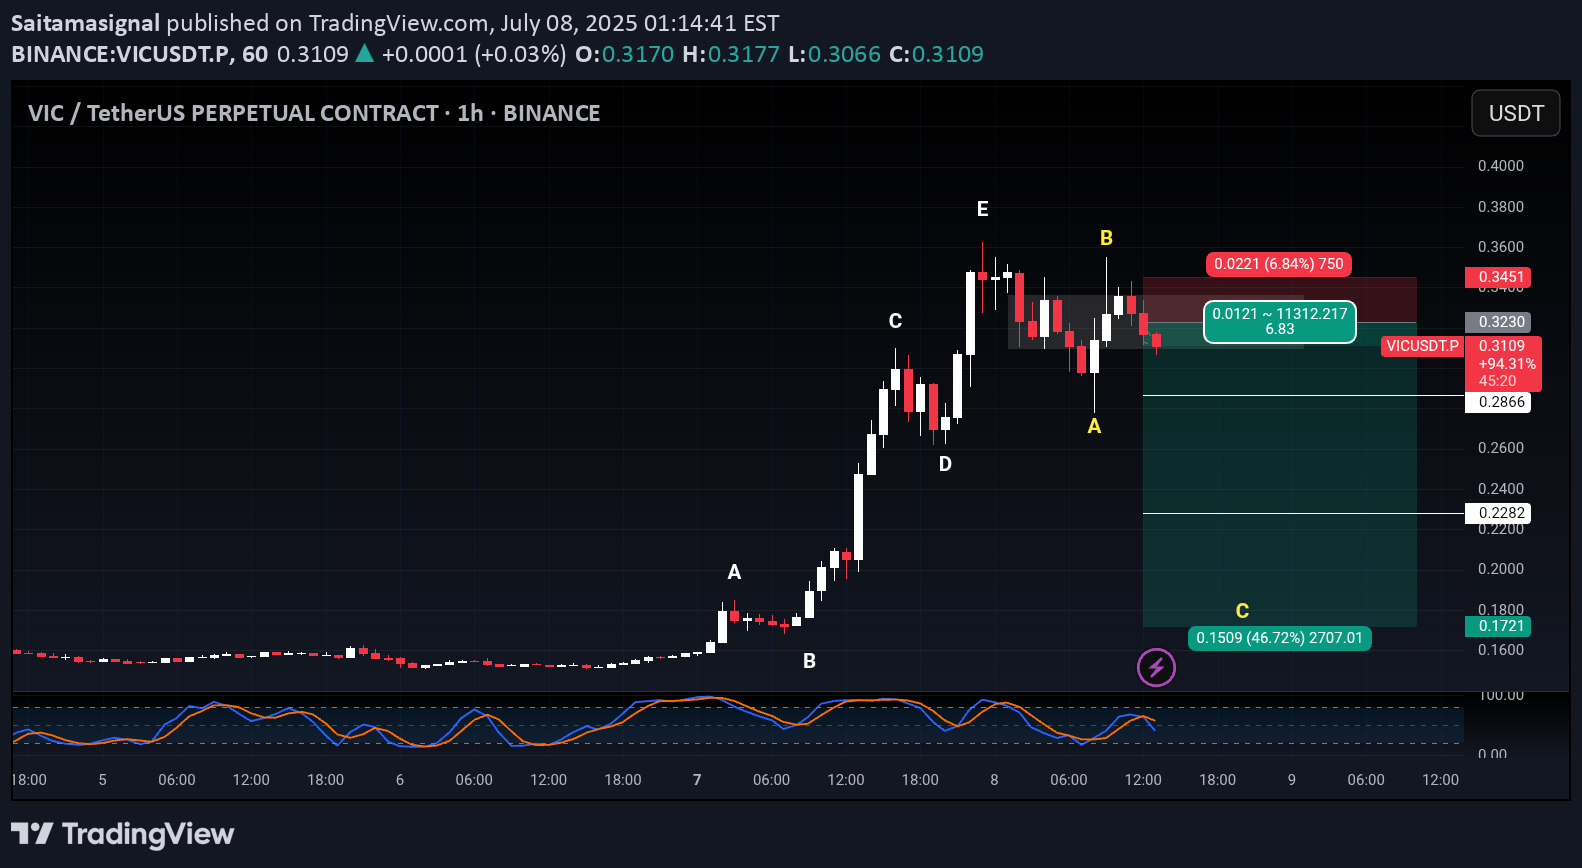
📉 SHORT TRADE SIGNAL - VIC/USDTExchanges: Binance FuturesSignal Type: Regular (Short)Leverage: Isolated (3.0X)Amount: 5.0%🔽 ENTRY:🔹 0.3230 rejection zone📌 TARGETS:🎯 TP1: 0.2866🎯 TP2: 0.2282🎯 TP3: 0.1721 (Projected C point - full correction zone)🛑 STOP LOSS:❌ 0.3451 (Above recent local high)📉 Technical Notes:Completed 5-wave impulse (A-B-C-D-E)Current structure suggests beginning of ABC corrective phaseStochastic RSI crossing downward from overbought zoneIdeal for short-term to medium-term short position

unichartz
VIC Faces Crucial Resistance Test After Explosive Rally

VIC just popped over 100% and is now testing a key resistance trendline.After weeks of sideways chop and downside pressure, VIC has made a strong bounce off the demand zone and is now pushing right into the falling resistance trendline.This is a crucial level, if it breaks and holds above this trendline, we could see a shift in structure and more upside toward the next supply zone.But if it gets rejected again, price might cool off and retest lower supports.DYOR, NFA
Alpha-GoldFX
VICUSDT Forming Falling Wedge
VICUSDT is displaying a classic falling wedge breakout pattern, which is often seen as one of the most reliable bullish reversal signals in technical analysis. This pattern suggests that the downtrend may be losing steam and a significant trend reversal could be underway. With a well-formed falling wedge and a strong breakout confirmation, VIC is now positioned to potentially deliver impressive gains in the range of 90% to 100%+, capturing the attention of traders looking for high-potential altcoins.Recent spikes in trading volume further validate the strength of this breakout move. Higher volume during a breakout often indicates that both retail traders and larger investors are stepping in, adding conviction to the trend reversal. This strong volume profile could drive sustained upward momentum, making VICUSDT a crypto pair worth monitoring closely over the coming weeks.The fundamentals surrounding VIC’s project are also contributing to growing investor interest. As the crypto space evolves, innovative projects with real-world use cases and active development teams tend to attract capital faster. VIC appears to be aligning with these factors, offering a compelling combination of solid technicals and supportive market sentiment.✅ Show your support by hitting the like button and✅ Leaving a comment below! (What is You opinion about this Coin)Your feedback and engagement keep me inspired to share more insightful market analysis with you!

Captain-MAO
VIC/USDT 150% !!
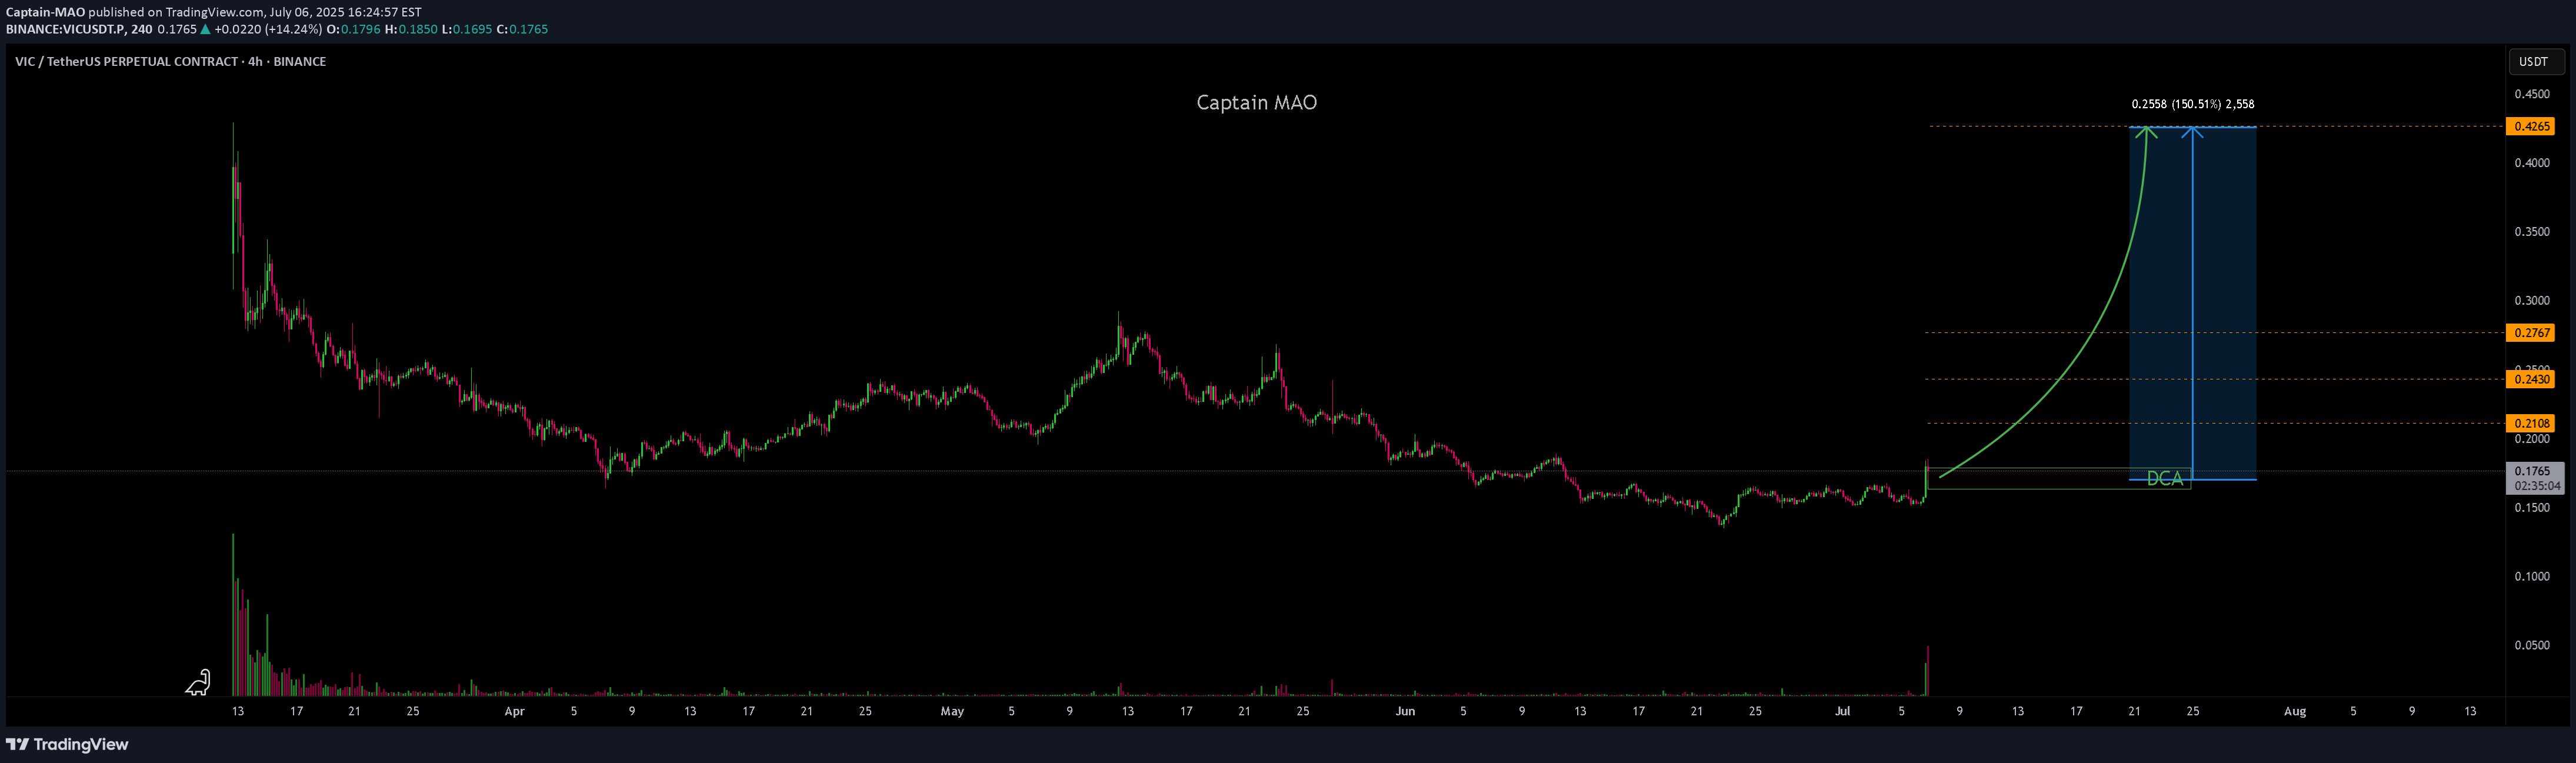
VIC has been ranging for the past 11 days between $0.15 – $0.166, and that consolidation phase has now been broken with a strong 4H bullish candle, giving us the first solid sign of a potential trend reversal. Entry Zone: DCA from current price down to $0.163 Target 1: $0.277 Target 2 (Full Target): $0.42 Invalidation: Close back below the broken range (~$0.15) would weaken this setupAll targets at once 67%thats is insance 210% from entry hope you do made profit
Disclaimer
Any content and materials included in Sahmeto's website and official communication channels are a compilation of personal opinions and analyses and are not binding. They do not constitute any recommendation for buying, selling, entering or exiting the stock market and cryptocurrency market. Also, all news and analyses included in the website and channels are merely republished information from official and unofficial domestic and foreign sources, and it is obvious that users of the said content are responsible for following up and ensuring the authenticity and accuracy of the materials. Therefore, while disclaiming responsibility, it is declared that the responsibility for any decision-making, action, and potential profit and loss in the capital market and cryptocurrency market lies with the trader.