
SupertradeOfficial
@t_SupertradeOfficial

What symbols does the trader recommend buying?
Purchase History
پیام های تریدر
Filter
SupertradeOfficial
XRPUSDT, Ripple Bearish Short Scenario

Price Action & Structure •The chart clearly shows lower highs and lower lows, a classic downtrend structure. •After the sharp sell-off around the 21st, XRP attempted a small rebound, but it stalled near the $2.99 – $3.00 resistance zone, aligning with the Fibonacci 0.5 retracement and pivot level. •Since then, price has rejected again and is consolidating near $2.72, which is sitting close to the Fibonacci 1.618 extension. This suggests continuation pressure from sellers. ________________________________________ Fibonacci Levels & Resistance Zones •$2.88 – $2.99 (Fib 0.382–0.5 + Pivot cluster): Heavy resistance. Sellers defended this zone aggressively, proving that bulls are weak at higher levels. •$3.09 (Fib 0.618 + R2): Next resistance above, but price failed to even test it, further validating bearish strength. •$2.62 (Fib support zone): First potential bearish target, as price seems to be heading in that direction. •$2.57 – $2.50: Deeper extension support if breakdown accelerates. ________________________________________ Volume & Momentum •The heavy red candles around the 21st–22nd show that sellers had much stronger momentum than buyers. •Recent green candles are smaller in size and lack follow-through, which usually signals weak buying attempts in a bearish market. •Momentum remains tilted toward the downside as long as XRP stays under $2.88–$2.99. ________________________________________ 📌 Trade Setup (Bearish Bias) •Entry: $2.72 (current levels or on a pullback to $2.85 resistance) •Stop-Loss: $3.00 (above Fib 0.5 and pivot cluster) •Take-Profit 1: $2.62 (Fib support) •Take-Profit 2: $2.50 (extended bearish target) •Risk/Reward: Approx. 1:2. ________________________________________ ✅ Justification for Bearish Bias: The trend structure is clearly bearish (lower highs/lows), XRP is failing to reclaim strong resistance zones ($2.88–$3.00), and Fibonacci + pivot confluence points confirm sellers are in control. Unless bulls break and sustain above $3.00, downside remains the path of least resistance. ________________________________________
SupertradeOfficial
SOL/USDT (4H chart) Bearish Bias

🔎 Technical Outlook •Trend: After a strong rally toward $250, Solana has started forming lower highs and lower lows, a clear sign of weakening momentum. •Resistance Zone: Price faced rejection near $237 – $240, which aligns with a previous supply zone. This has turned into a ceiling for the market. •Support Levels: Current price is hovering around $222, but if sellers maintain control, the next strong demand zone lies near $200 — also your marked target. •Candlestick Behavior: The recent sharp decline shows strong bearish pressure, and recovery attempts have been weak, signaling more downside potential. ________________________________________ 📉 Trade Setup (Bearish) •Entry Zone: $222 – $223 (current area) •Stop-Loss: $238 (above resistance and last swing high) •Take Profit 1: $210 (interim support) •Take Profit 2: $200 (major support) •Risk/Reward: ~1:2 (attractive setup) ________________________________________ 🛡 Risk Management •📉 Partial Profits: Secure partial gains at $210 before targeting $200. •🔒 Trailing Stop: Once $210 is hit, move SL to breakeven ($222) and trail down to lock profits. •🚫 Invalidation: A sustained break above $240 would cancel the bearish outlook and could push SOL back to $250+. ________________________________________ ✅ Summary Solana looks weak after repeated rejections at $237 – $240, and bears are in control. If sellers maintain momentum, a drop toward $210 and $200 is likely. The setup favors shorting rallies with a tight stop-loss above resistance. ________________________________________Start Booking Profits and Move You SL to Breakeven
SupertradeOfficial
XRPUSDT Bullish Scenario Updated
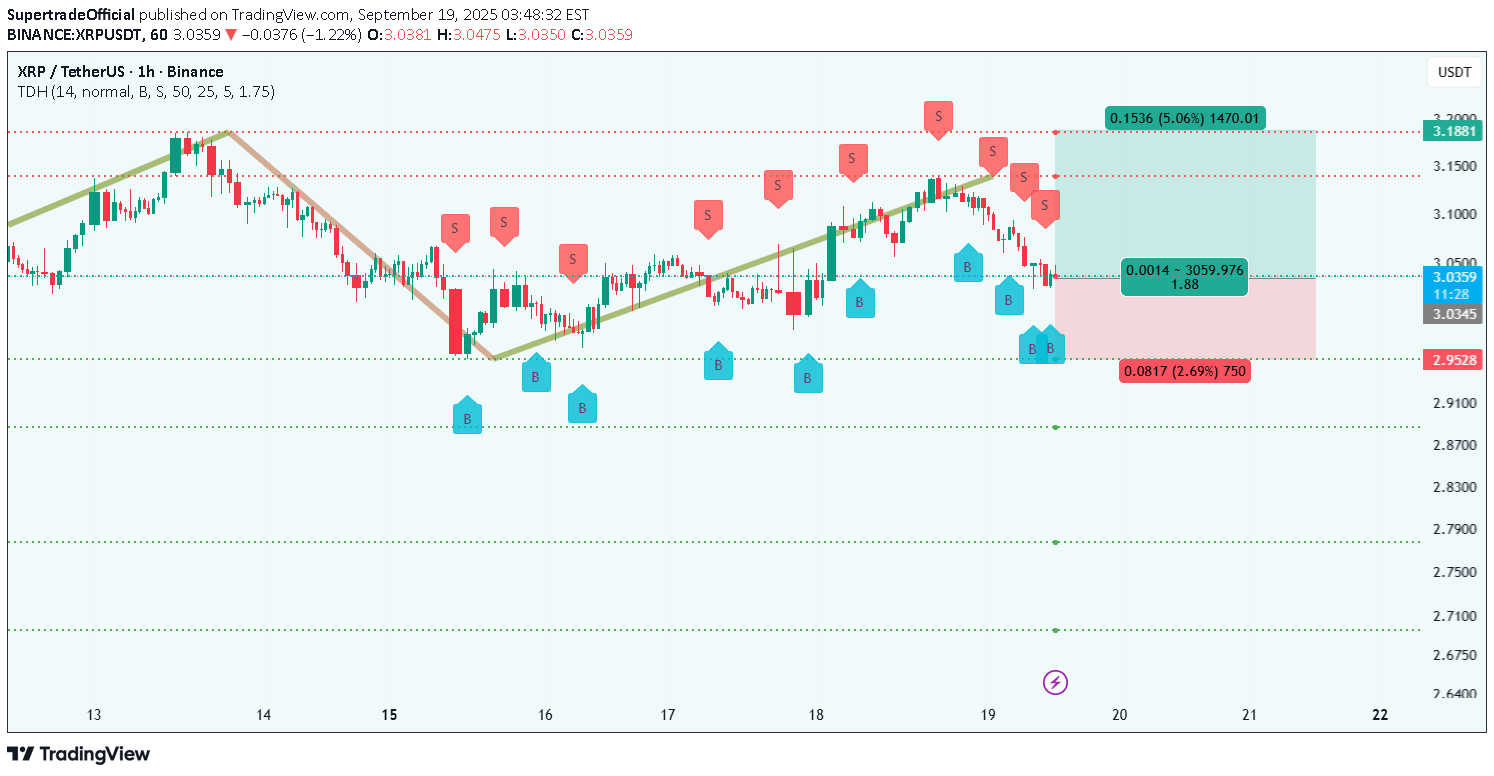
🔎 Technical Outlook XRP is currently trading around 3.03 – 3.04 USDT, after bouncing from a key support zone near 2.95 USDT. The chart shows a sequence of higher lows with multiple buy signals clustering near the base, suggesting strong accumulation. The resistance zone sits around 3.18 USDT, which is also marked as your target area. A clean breakout above minor intraday resistance at 3.05 USDT would open the way for bullish continuation. The structure favors buyers as long as price holds above 2.95 support. ________________________________________ 📈 Trade Setup (Bullish Bias) •Entry: 3.03 – 3.05 USDT (current market zone) •Stop-Loss: 2.95 USDT (below recent support & invalidation level) •Take Profit 1: 3.12 USDT (intermediate resistance) •Take Profit 2: 3.18 USDT (major resistance target) •Risk/Reward: ~1:2 ________________________________________ 🛡 Risk & Trade Management •🔒 Partial Profit Booking: Secure some profits at 3.12 USDT to reduce risk exposure. •📈 Trailing Stop: Once TP1 is hit, move stop-loss to breakeven (3.03) and trail along higher lows to ride momentum. •🚫 Invalidation: If XRP breaks below 2.95, the bullish setup is invalid, and exiting quickly protects capital. ________________________________________ ✅ Summary XRP is showing bullish intent after defending the 2.95 support zone and looks set to retest 3.12 – 3.18 USDT. A layered profit-taking approach with a trailing stop allows you to capture the move while managing downside risk effectively. ________________________________________
SupertradeOfficial
ETH Bulls Target $5,200 Next — Is $5,500 Around the Corner?
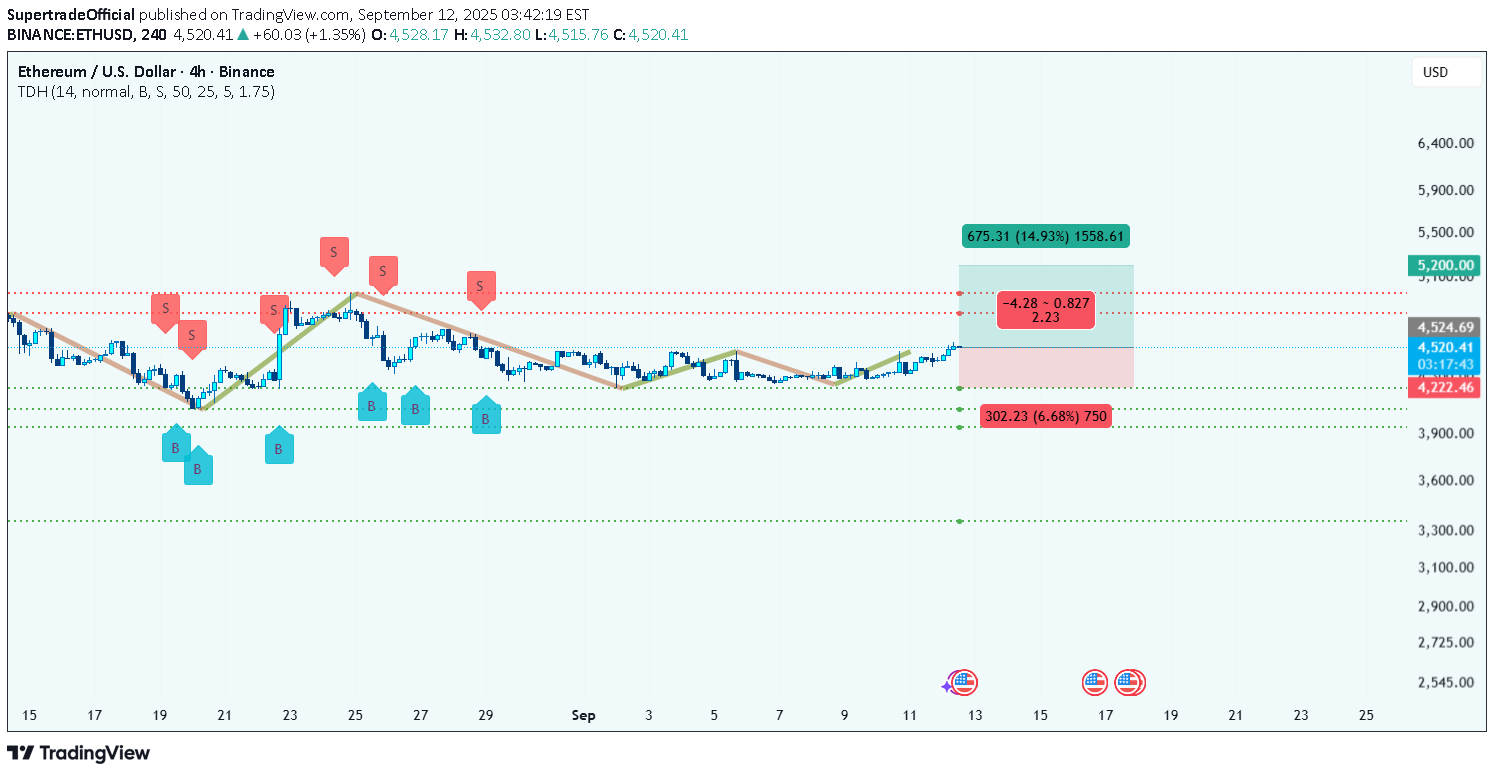
ETH looks like it’s exiting a sideways/accumulation band and moving back into a bullish regime on the 4-hour chart. The structure recently shifted from range-bound to higher lows → higher highs, which is the first quality check for a sustainable push higher. The move is not yet a blow-off — it’s a controlled attempt to reclaim higher resistance. On the chart I see three clean bands to treat differently: •Near-term supply (resistance) sits just under ~$4,950 and extends to ~$5,200. Price has to clear and hold above this zone to confirm a larger breakout and give bulls runway to $5,500+. •Immediate control / pivot is roughly the present area near $4,500–$4,550 (where buyers re-entered). This zone now acts as short-term support if price holds. •Lower structural demand is near $4,220 (primary invalidation for this bullish thesis) and below that $3,940 is the deeper cushion where previous buyers stepped in strongly. Price behavior to watch: a clean 4H close above $4,950 with follow-through opens the path to $5,200; failure there (rejection on heavy tails) turns the move into a “bull trap” and would require caution. Conversely, a breakdown and decisive 4H close below $4,220 invalidates the bullish plan and suggests revisiting lower structural supports. ________________________________________ Level-by-level careful analysis (why each matters) •$4,220 (primary support / invalidation) — multiple prior reactions here: a daily/4H close below this suggests sellers regained control and the bullish case fails. Use this as your hard invalidation. •$4,500 – $4,550 (current control / entry zone) — recent buyers defended this band; it’s where new longs are being accumulated. A hold/clean bounce here is a good risk-controlled entry region. •$4,950 (first major resistance) — the choke point. This is where supply historically clustered; a close above with volume / hourly follow-through confirms breakout. Partial profit-taking is logical here even if continuation follows. •$5,200 (secondary resistance / breakout confirmation) — significant supply cluster; a sustained break here targets extension to $5,500+. •$3,940 (deep support / liquidity pool) — if price collapses through $4,220 this is the next magnet where buyers likely re-appear. ________________________________________ Numeric recap (all important numbers — copy/paste friendly) •Current price area to watch: $4,500 – $4,550 •Hard invalidation (stop area): $4,220 •Short-term target / TP1: $4,950 •Breakout confirmation zone / TP2: $5,200 •Extended target / TP3: $5,500+ •Deeper demand if invalidated: $3,940 Estimated risk/reward (if entry ~$4,520 & SL $4,220): •Risk = $300 (4,520 − 4,220) •Reward to TP1 = $430 → R:R ≈ 1.43 : 1 •Reward to TP2 = $680 → R:R ≈ 2.27 : 1 •Reward to TP3 = $980 → R:R ≈ 3.27 : 1 ________________________________________ 📈 Trade setup (bullets only) •Entry: buy $4,500 – $4,550 (prefer a constructive 4H bounce inside this zone) •Stop-loss: $4,220 (clean 4H close below = invalidation) •Take Profit 1 (TP1): $4,950 → take 30–40% off •Take Profit 2 (TP2): $5,200 → take another 30–40%; move remaining to breakeven •Take Profit 3 (TP3): $5,500+ → leave a small runner, trail stop under 4H higher lows •Trailing stop plan: after TP1, trail SL to breakeven; after TP2, trail SL under each successive 4H higher low or use 1.5× ATR(20,4H) for dynamic trailing •Risk per trade: keep at 1–2% of account equity; size position so $300 risk equals your dollar risk cap ________________________________________ Execution & risk notes (brief) •Prefer confirmation: either a clean 4H bounce from $4,500–4,550 or a clean 4H close above $4,950 (for breakout entries). •Expect whipsaws near $4,950; partials at TP1 reduce exposure to false breakouts. •If macro events/US data are due, reduce size or wait for post-event clarity — ETH can gap around high-impact crypto or macro news. •Re-evaluate if price closes below $4,220 on 4H — cut and re-plan. ________________________________________
SupertradeOfficial
XAU/USD on Fire — Next Stop $3,750?
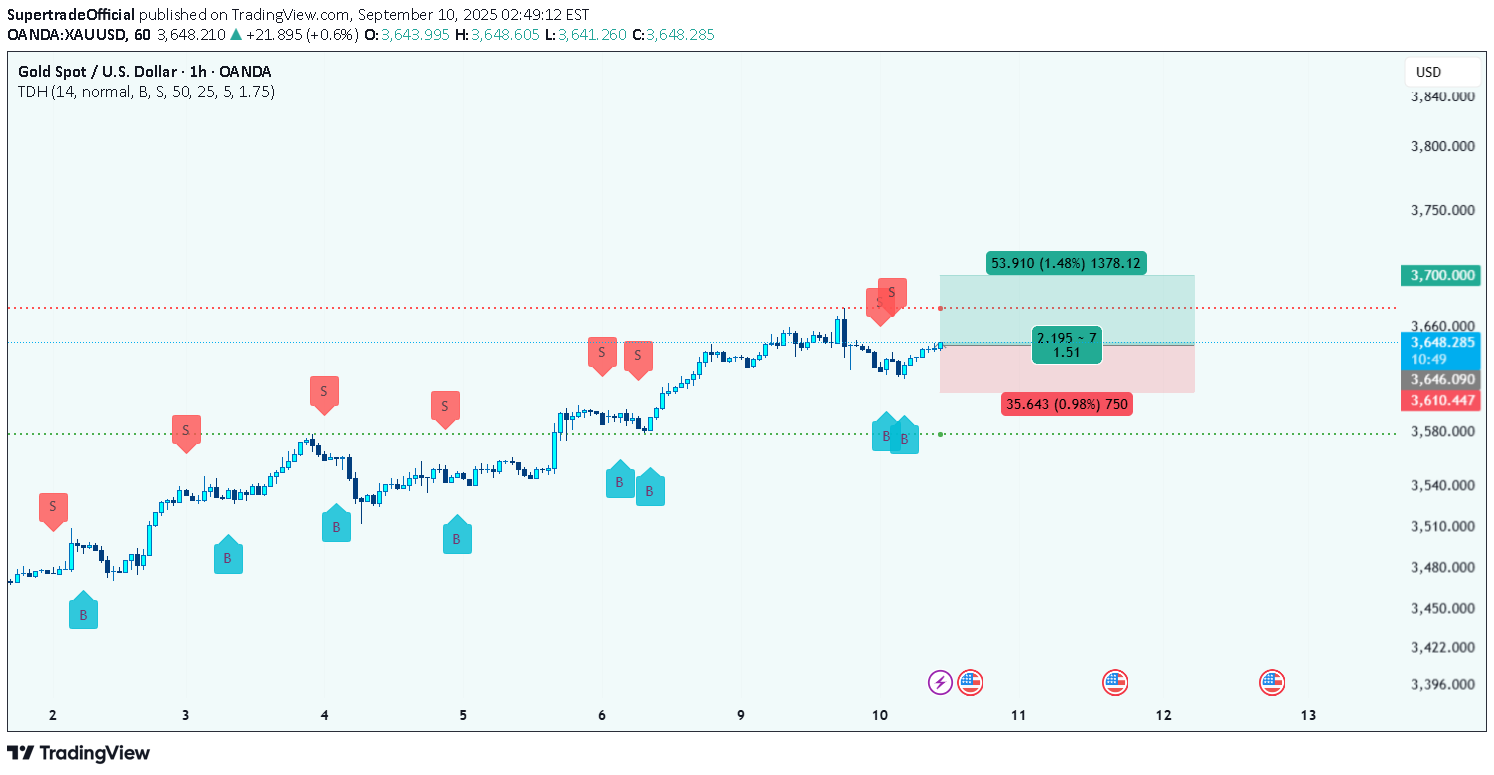
Gold (XAU/USD) on the 1H chart is currently maintaining a bullish structure, with price trading around $3,644 after bouncing from the $3,610 support zone. This area has repeatedly acted as a demand level, confirming that buyers are defending dips. The market has been forming higher lows and higher highs, which reinforces the bullish bias. On the upside, the price faces resistance around $3,674–$3,700, which aligns with the marked take-profit zone. If bulls manage to push above $3,700 with momentum, the next extension target could be near $3,750, a psychological level and a historically reactive price point. On the downside, $3,610 remains a key invalidation level; a break below could shift momentum back toward sellers. From a momentum perspective, recent buying signals around the lower zones confirm continued interest from institutional buyers. The recent cluster of selling signals near $3,670 reflects short-term supply pressure, but price behavior shows that demand is gradually absorbing that. ________________________________________ ✅ Trade Setup (Bullish) •Entry: $3,645 – $3,650 •Stop Loss: Below $3,610 •Take Profit 1: $3,674 •Take Profit 2: $3,700 •Extended Target: $3,750 ________________________________________ Risk handling is critical here. The setup offers a 1:1.5 to 1:2 risk/reward, depending on entry execution. A smart approach would be to book partial profits at $3,674, then trail the stop-loss to breakeven. If price breaks above $3,674 convincingly, use a trailing stop strategy under each new higher low on the 1H chart. This allows traders to lock in gains while still staying exposed to the larger bullish move. In short, Gold remains poised for a bullish breakout, with strong upside potential if resistance levels are cleared. Careful trade management with partial exits and trailing stops will ensure traders maximize profit while limiting risk. ________________________________________Trade is still active but you can start booking profit at this point as well,
SupertradeOfficial
Bitcoin Breakout: $112.4K → $117.4K Target in Play
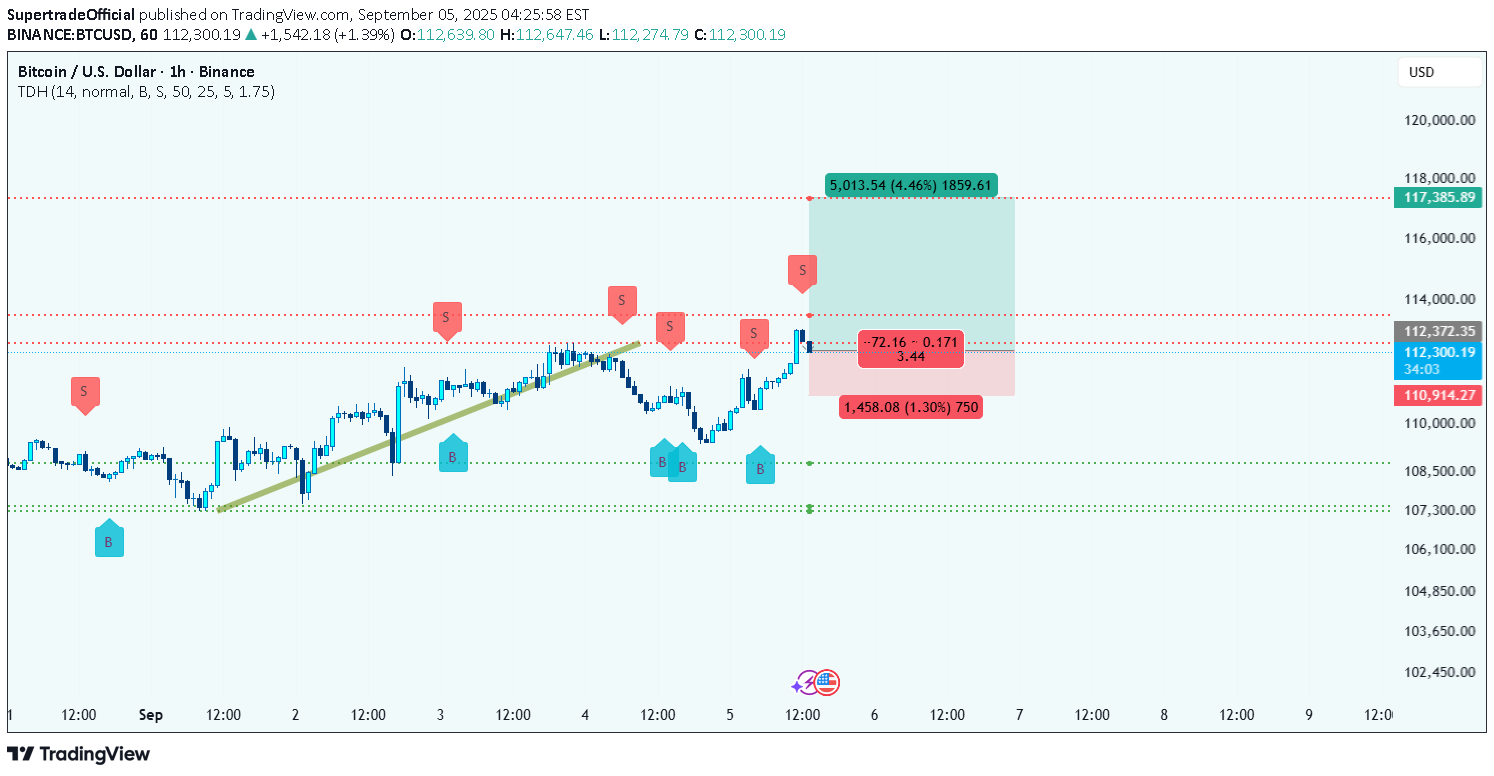
Market context & structure BTC has shown a steady climb into the current area: the market printed a sequence of higher lows through the first days of September and just produced a strong impulse leg into the 112k zone. That move carried price above a short-term trendline and absorbed nearby selling interest, which is bullish structure on the 1-hour timeframe. The recent pullback is shallow and looks like a classic retest of breakout area rather than a failure — buyers keep stepping in around the 107–109k region historically, which supports further upside attempts. Technical reasons to be bullish (justification) •Higher lows / higher highs pattern on the 1H — the structure favors continuation while this remains intact. •Break & retest behavior: price cleared the minor resistance area near 110–112k and is holding above that band after the retest. That suggests a higher-probability long opportunity rather than a fresh breakout-fail. •Clear targets and measured move: the chart’s long setup projects an upside objective near ~117,385, which aligns with a visible supply cluster and a logical liquidity magnet above current price. •Healthy R:R on the plan: the trade on the chart shows a relatively small stop compared with the upside objective, producing a favorable reward-to-risk. Key chart levels (visible on your image) •Entry area: ~112,350 – 112,400 (current price zone). •Stop (chart): 110,914 (invalidation below recent control). •Primary target (T1 / chart): 117,385 (main upside objective / supply cluster). •Lower support band to watch: ~107,300 – 108,800 (previous demand area; if price returns here buyers typically reappear). ________________________________________ Trade setup (clear, bullet format) •Entry: Long around 112,350 – 112,400. •Stop-loss: 110,914 (≈1,445 points below entry; ~1.3% risk). •Take Profit (T1): 117,385 (~5,026 points above entry; ~4.5% upside). •Risk : Reward: ≈ 3.5 : 1 (T1 vs SL). ________________________________________ Trade management & partial-profit rules •Partial profit booking (recommended): take 30–40% off the position once the trade is ~+2% to +2.5% in profit (roughly 114,500 – 115,000 on this setup). Locking a portion early secures gains and reduces emotional pressure. •After partials: move the stop on the remaining position to breakeven (entry) once the partial is taken — this converts the remaining position into a free trade. •Trailing: for the rest, trail the stop under each 1H higher low as price advances (or use a volatility-based trail, e.g., 1.5× ATR(14,1H)). This captures extended upside while protecting profits. •Second take profit: scale out another 30–40% near the charted target 117,385; leave a small runner if you want exposure to an extended move above that level. •If price falls to SL: accept the loss and re-evaluate structure — a clean hourly close below 110,914 invalidates the bullish plan. Risk and event notes •Keep position sizing so the trade risk stays within your rule (commonly 1–2% of account). •Be cautious around macro windows (FOMC, US data, high-impact crypto news) — these can cause slippage and sharp volatility on the 1H. Consider reducing size or tighter management near scheduled events. •Watch for false breakouts: if price stalls and fails to hold the breakout band for several hourly closes, avoid scaling in further. ________________________________________ Short summary The 1H structure favors a bullish continuation as long as price holds above the breakout/control band and 110,914. The charted plan offers a high R:R (~3.5:1) to ~117,385. Use staged profit-taking (30–40% at ~+2% — ~114.5k), move stop to breakeven, and trail the remainder under 1H higher lows to maximize capture while protecting gains. Would you like those same levels formatted as a one-line social caption and a short post-ready blurb you can drop under the chart?
SupertradeOfficial
From $207 to $218: Solana Bullish Setup Ahead
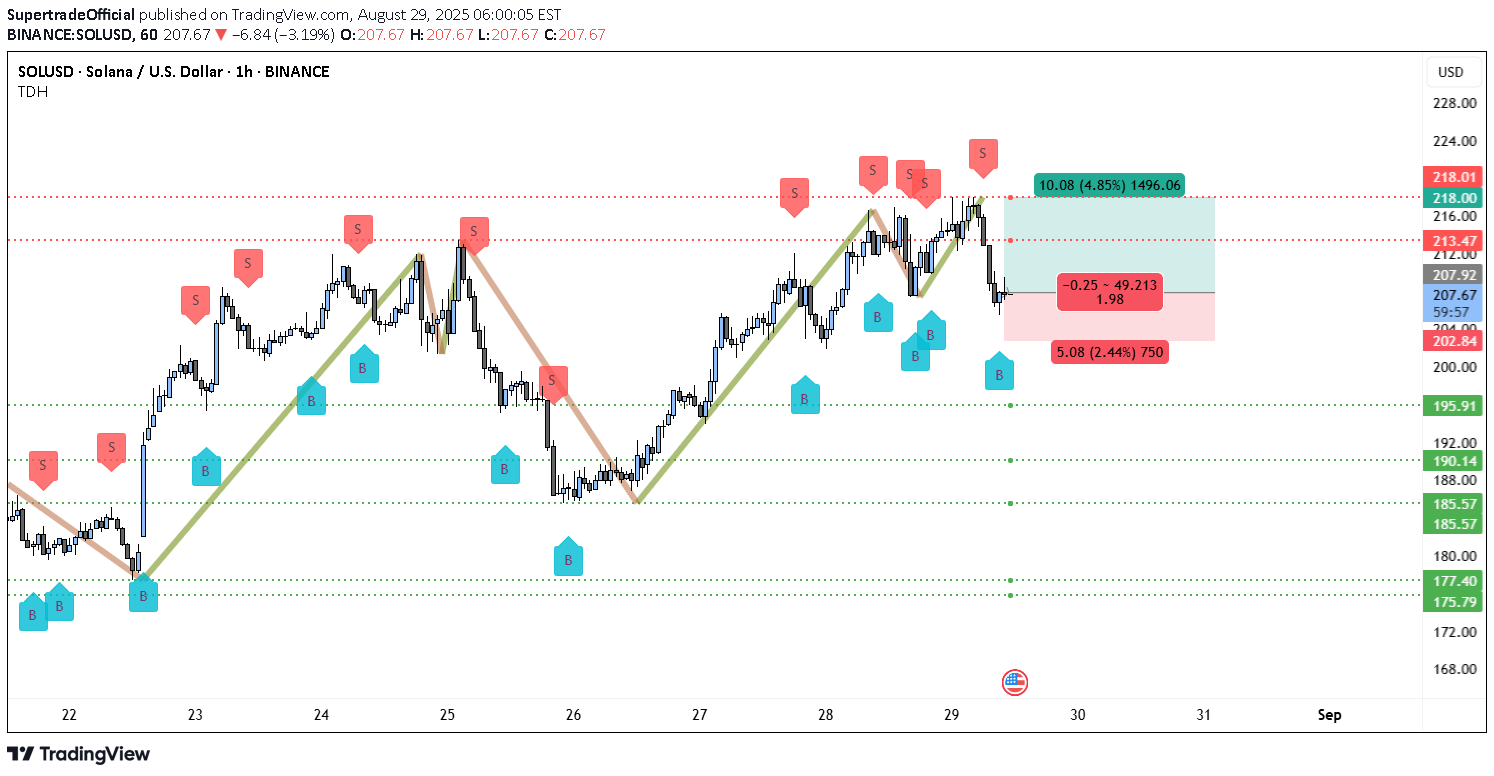
On the 1H chart of SOLUSD, the broader price structure is showing strength, favoring your bullish bias. Solana has been making higher swing lows, which is a strong sign of accumulation and sustained buying pressure. Each dip into support zones has been met with aggressive rebounds, suggesting buyers are still in control. Currently, SOL is trading around $207–$208, after bouncing from the $202 area. This bounce was significant because it shows how well the $202 level is being defended. The price is now pushing toward the $213–$218 resistance band, which has acted as a supply zone multiple times before. A successful break above this band would likely confirm a continuation of the bullish momentum, potentially opening up higher targets in the coming sessions. The immediate supports are clear. The most important one is $202.84, and below that, $195.91 and $190.14 form the next layers of demand. As long as SOLUSD holds above $202, the bullish structure remains intact. On the upside, the key resistance levels are $213.47 and $218.01. These areas are crucial profit-taking zones, and $218 is the major level to watch, as it has capped multiple rallies before. 🟢 Bullish Trade Setup (SOLUSD 1H) •Entry Zone: $207–$208 (current trading area) •Stop Loss: Below $202.84 •Target 1: $213.47 •Target 2: $218.01 For managing the trade, the best approach is partial profit booking. Closing around 30–40% of the position at $213.47 locks in early gains and reduces exposure. Once that level is reached, the stop-loss can be adjusted to breakeven at $207, removing risk from the trade. If the move continues toward $218, a trailing stop strategy should be applied, placing stops just below the most recent higher low on the 1H chart. If a breakout occurs above $218, the path toward $225 and beyond could open up, but for now, $218 remains the major bullish target. In summary, SOLUSD is trading in a bullish structure with strong support at $202 and profit targets at $213 and $218. The setup provides a favorable risk-to-reward scenario, with partial profit booking and trailing stops ensuring profits are protected while leaving room for upside continuation.
SupertradeOfficial
Gold Breakout at $3,405, Next Stop $3,440
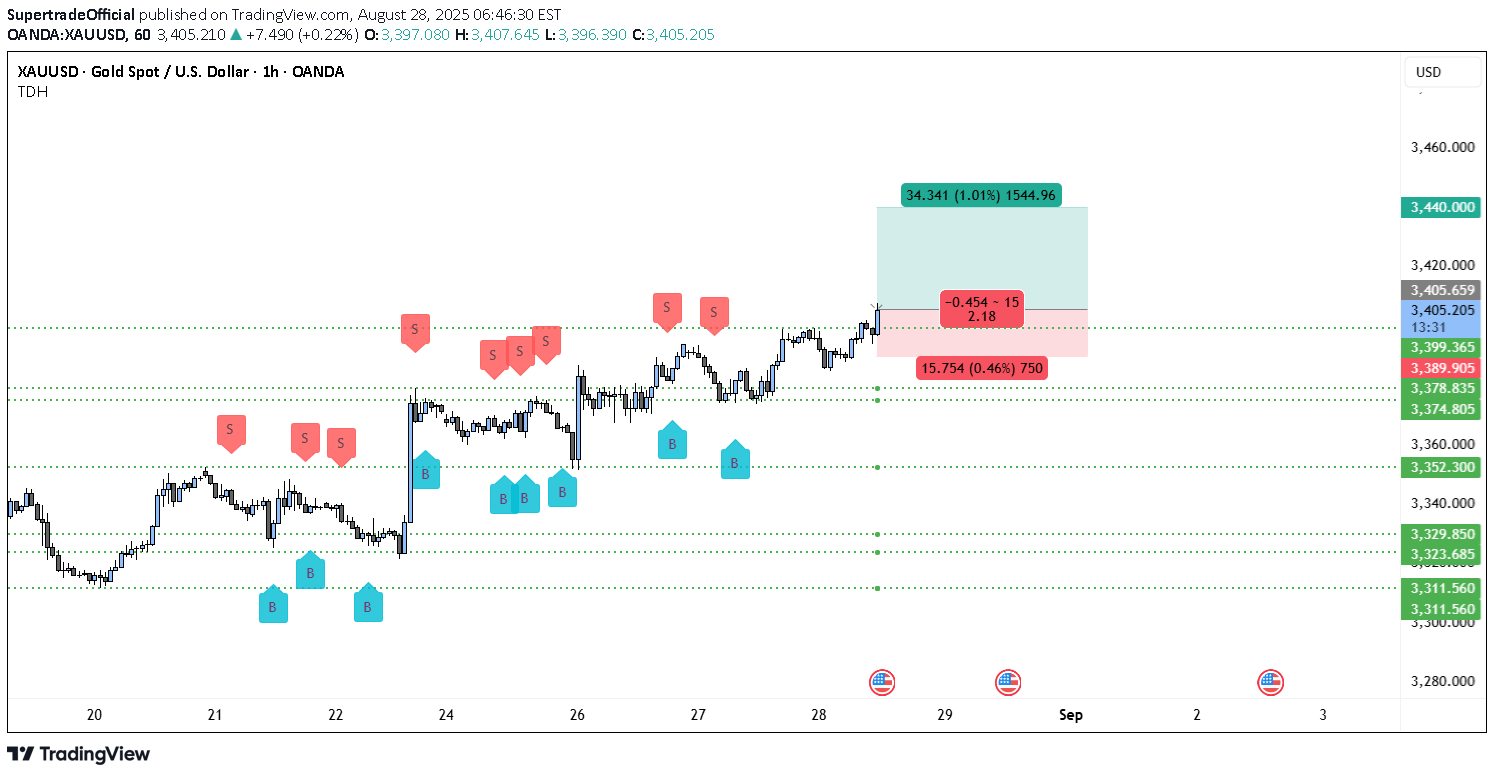
📊 Technical Analysis of XAUUSD (1H) Gold has been in a gradual uptrend over the last few sessions, with higher lows consistently forming. The structure suggests bullish momentum is building, especially after reclaiming the $3,378–$3,389 zone, which previously acted as resistance and has now turned into support. At present, price is trading around $3,404–$3,405, attempting to break higher. The green box on the chart indicates a long trade setup with a favorable risk-to-reward ratio. Key Observations: •Support Levels: Immediate support lies around $3,389–$3,378, followed by deeper supports at $3,352 and $3,329. These are key zones where buyers may step in if retracements occur. •Resistance Levels: The next major resistance is projected at $3,440, which is also the target zone highlighted on the chart. If bulls push past this level, momentum could extend further, though $3,440 remains the near-term cap. •Candle Structure: Price has broken above the minor consolidation range between $3,389–$3,405. If this breakout sustains, the bullish case strengthens toward $3,440. •Volume & Momentum: Recent price action shows strong breakout candles supported by follow-through. This indicates buyers are currently in control, and sellers are being absorbed at resistance levels. ________________________________________ 🟢 Bullish Trade Setup (XAUUSD 1H) •Entry Zone: Around $3,404–$3,405 (current breakout area) •Stop Loss: Below $3,389 (recent structural support) •Target 1: $3,440 (major resistance level) •Risk/Reward: Approx. 1:2 ________________________________________ 📌 Trade Management •Partial Profit Booking: At $3,440, it’s wise to secure at least 50% profits, as this is a strong resistance where sellers may re-enter. •Trailing Stop: Once price moves decisively above $3,420, adjust stop-loss to breakeven at $3,404. If the rally extends beyond $3,440, trail stops under each higher low to capture extended gains. ________________________________________ ✅ Summary XAUUSD on 1H is showing strong bullish momentum after reclaiming critical support zones. The breakout above $3,405 sets up a clean run toward $3,440. Trade management should focus on partial profit booking at resistance and using trailing stops to ride any extended move while locking in gains.
SupertradeOfficial
ETH Bulls Eye $4,300 – Can This Rally Hold?
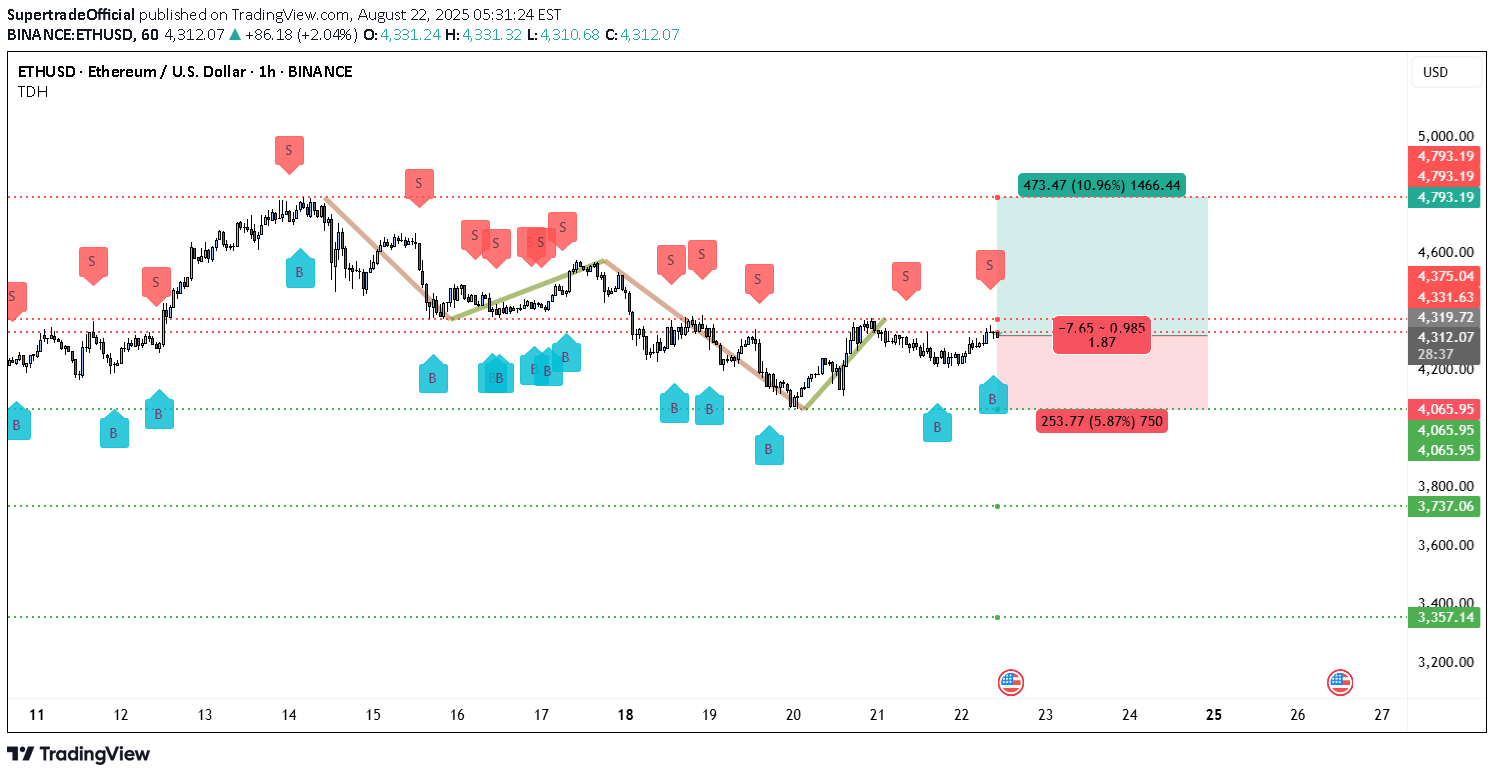
ETH has spent the last week unwinding a down-leg from the upper supply band around 4,793.19 (top red dashed line). That decline stalled and based above the major demand shelf marked by the repeated green dashed line at 4,065.95. Notice how the blue B tags cluster along that shelf on Aug-18–21 and again on the latest pullback—each test was absorbed, then followed by impulsive buying. That’s the anchor of the bullish case: buyers have repeatedly defended 4,065.95, converting it into a primary swing floor. From that base, price printed a higher low on Aug-21 and then a bullish impulse that reclaimed the prior breakdown area around 4,319.72–4,331.63 (mid red dashed band). The candle structure after the reclaim is constructive: shallow pullbacks, overlapping bodies, and no immediate rejection wicks at the reclaimed band. On this timeframe, that looks like a change of character from distribution to accumulation. Above, you’ve got a series of upside reference points that stack neatly as targets. The first is the mid-range pivot at 4,375.04, which lines up with the center of the short red dashed channel and where sellers showed up previously (red S tags). If bulls chew through that, the path opens toward the unfilled pocket into 4,793.19 (top band, shown twice on the scale). The long box drawn on your chart reflects a similar idea: long from just above the reclaim, risk tucked below the demand shelf, and reward mapped into the prior supply. Downside invalidation is straightforward. If ETH loses 4,065.95 on a closing basis, the next demand zones are well below at 3,737.06 and 3,357.14 (lower green dashed bands). Those levels only come into play if buyers capitulate at the shelf; until then, the market keeps rewarding dips into support. A quick read of the swing map you’ve marked: •Support cluster: 4,065.95 (primary), then 3,737.06, then 3,357.14. •Reclaimed resistance/now pivot: 4,319.72–4,331.63. •Interim target/resistance: 4,375.04. •Major supply: 4,793.19. The distribution of S tags is also telling. Earlier in the week they appeared aggressively near the mid-band; today, they’re thinner as price hugs the reclaimed zone, suggesting supply is being absorbed. Meanwhile, B tags continue to populate each higher low above 4,065.95, reinforcing that buyers are stepping in on dips rather than chasing highs—constructive behavior for a trend build. Trading setup (from the chart) •Bias: Long while price holds above 4,319.72–4,331.63 and especially 4,065.95. •Entry zone: Retests of 4,319.72–4,331.63 or shallow dips into 4,312–4,325. •Invalidation: 1H close below 4,065.95 (structure break). •Targets: 4,375.04 (T1) → 4,431.63 (T2, top of the reclaimed band) → 4,793.19 (T3 major supply). •Management: If T1 hits, trail to break-even; after a 1H close over 4,375.04, trail under the most recent higher low to stay with momentum. Why this favors the bulls now The market has established a sturdy floor at 4,065.95 with multiple successful defenses. Price has since reclaimed a prior breakdown region (4,319.72–4,331.63), which often flips to support on the next pullback and becomes a springboard. The lack of sharp rejection at that reclaim hints sellers are less aggressive than they were earlier in the week. With the next dense liquidity pocket at 4,375.04 and a vacuum above toward 4,793.19, the risk-reward of buying dips into the reclaimed band is attractive, provided risk is controlled under the shelf. What would weaken this view A failure to hold the next pullback into 4,319–4,332 followed by heavy selling back into the shelf would signal absorption is incomplete. If the shelf at 4,065.95 breaks on a closing basis, the bullish structure is invalidated and you’d expect a swift slide into 3,737.06 where the next meaningful demand sits. Until that happens, the sequence of higher lows above 4,065.95 is intact. Tactical notes Into 4,375.04, expect at least some reaction: that level capped several prior bounces and carries memory. If momentum is strong on approach (wide bodies, rising lows, no long upper wicks), partials at T1 and a tight trail can keep you in for 4,431.63 and 4,793.19. If momentum is weak (overlapping, small bodies), respect the level and get paid—don’t let a green trade turn red waiting for the extension. Bottom line: as long as 4,065.95 holds and 4,319.72–4,331.63 acts as a launching pad on dips, the 1H structure supports a push first into 4,375.04 and—if buyers maintain pressure—an extension toward the 4,793.19 supply band.
SupertradeOfficial
Gold’s Shine Is Fading: XAUUSD Signals Steep Drop Ahead
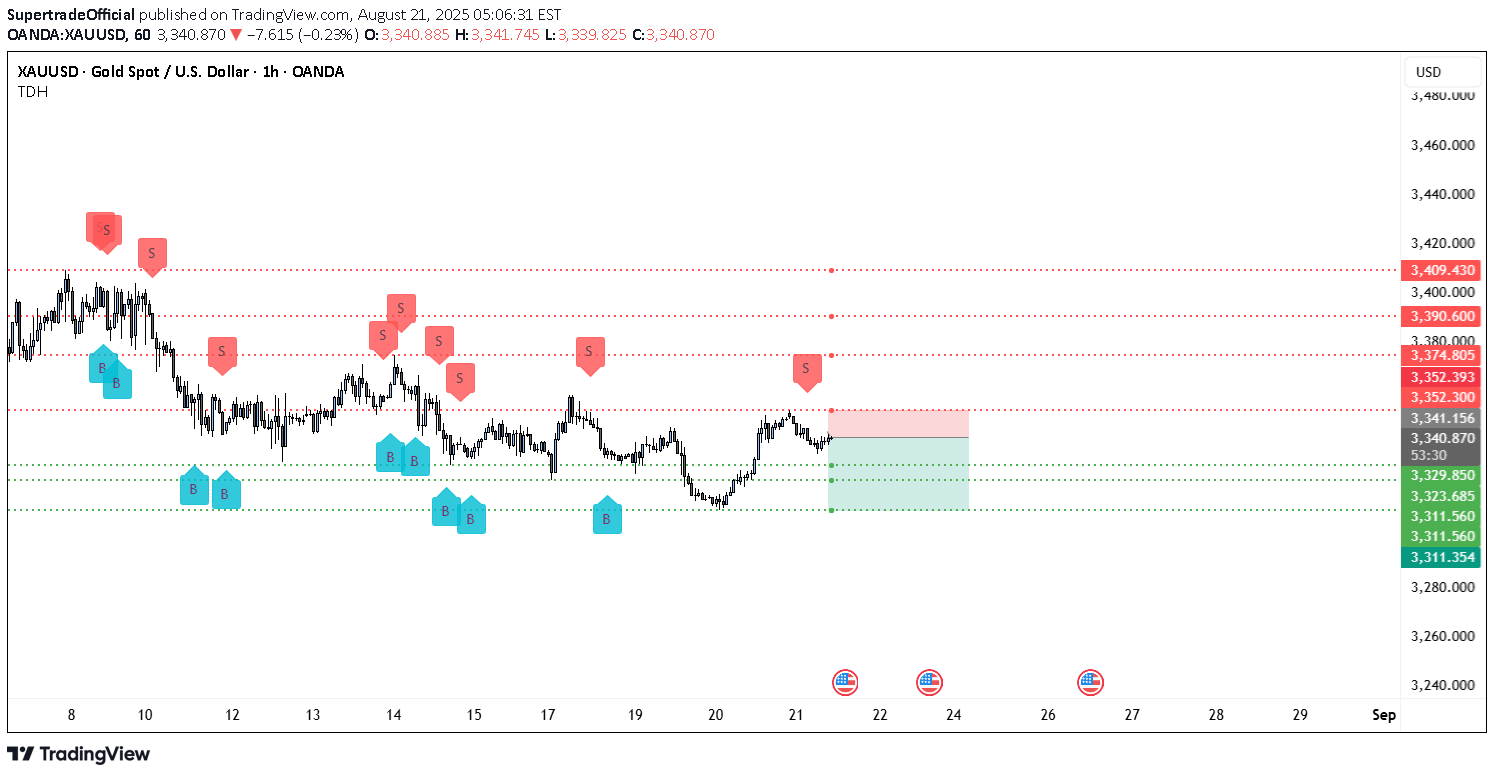
Gold has been in a persistent downtrend on the 1-hour: a sequence of lower-highs from the left of the chart keeps price capped beneath stacked supply. The latest bounce ran into the 3,352 area, which aligns with a prior breakdown and a red dotted resistance line. That area has repeatedly attracted “S” (sell) signals on your chart, confirming it as the near-term ceiling. Price is now rotating lower from just under that band, keeping the bearish structure intact while we hold below it. Key Levels Resistance stack above: 3,352.300 / 3,352.393 (immediate), then 3,374.805, 3,390.600, and 3,409.430. This ladder of red lines shows heavy overhead supply—each rally has met sellers sooner. •Current pivot: Price is sitting around 3,341.310 (blue price marker), just under micro resistance at 3,341.156. •Supports below / profit magnets: 3,329.850 → 3,323.685 → 3,311.560 → 3,311.354 (green dashed cluster). These are the levels price has respected on prior sweeps and where buyers previously appeared. Structurally, the retest-and-roll from ~3,352 looks like a classic bearish continuation: a rally into prior supply, failure to clear, and a drift back toward the green support band. The distribution of “S” markers near 3,352–3,375 and “B” markers only at the lows underscores that sellers control the mid-range. Until bulls can reclaim and hold above 3,352.393, the path of least resistance remains down. You’ve also got U.S. event ahead on the timeline (those small flags), which often spike intraday volatility in XAUUSD. Into those releases, fading into resistance and locking partials into nearby supports is the higher-probability play versus chasing moves. ________________________________________ 🎯 Trading setup (from your chart) •Entry: 3,341.310 (≈ current level) •Stop-loss: 3,352.300 (aggressive) or just above 3,352.393 (safer buffer) 🔒 •Take-profits (scale out): oTP1: 3,329.850 (≈ 1.0R) oTP2: 3,323.685 (≈ 1.6R) oTP3: 3,311.560 (≈ 2.7R) oStretch: 3,311.354 Management idea: If price accepts below 3,341.156, consider moving stop to breakeven; then trail above lower highs as you tag 3,329.850 and 3,323.685. Book small profits 💰 at each objective and let a runner attempt the deeper supports. ________________________________________ Invalidation & alternate path A 1H close back above 3,352.393 would neutralize the immediate short and put 3,374.805 back in play; above that, 3,390.600 → 3,409.430 are the next supply shelves. If that reclaim happens, the short thesis is invalid—step aside and reassess rather than fight the tape. ________________________________________ Risk note (important) XAUUSD can whip around on data and headlines. Size positions to your risk tolerance, keep risk per trade fixed, and take the wins early when the market offers them—especially into those green dashed supports. Consistently booking small profits and protecting capital is how you stay in control during a trend day.
Disclaimer
Any content and materials included in Sahmeto's website and official communication channels are a compilation of personal opinions and analyses and are not binding. They do not constitute any recommendation for buying, selling, entering or exiting the stock market and cryptocurrency market. Also, all news and analyses included in the website and channels are merely republished information from official and unofficial domestic and foreign sources, and it is obvious that users of the said content are responsible for following up and ensuring the authenticity and accuracy of the materials. Therefore, while disclaiming responsibility, it is declared that the responsibility for any decision-making, action, and potential profit and loss in the capital market and cryptocurrency market lies with the trader.