
unichartz
@t_unichartz

What symbols does the trader recommend buying?
Purchase History
پیام های تریدر
Filter
unichartz
اتریوم در کف قیمتی: آیا شوک نزولی ادامه دارد یا زمان جهش است؟
ETH is forming a solid base near the bottom, which is a positive sign for a potential short-term bounce. However, the overall trend remains bearish, with price still capped below the descending trendline and resistance zone. Any upside from here is likely corrective unless ETH breaks and holds above key resistance. DYOR, NFA Please hit the like button if you like it, and share your views in the comments section.
unichartz
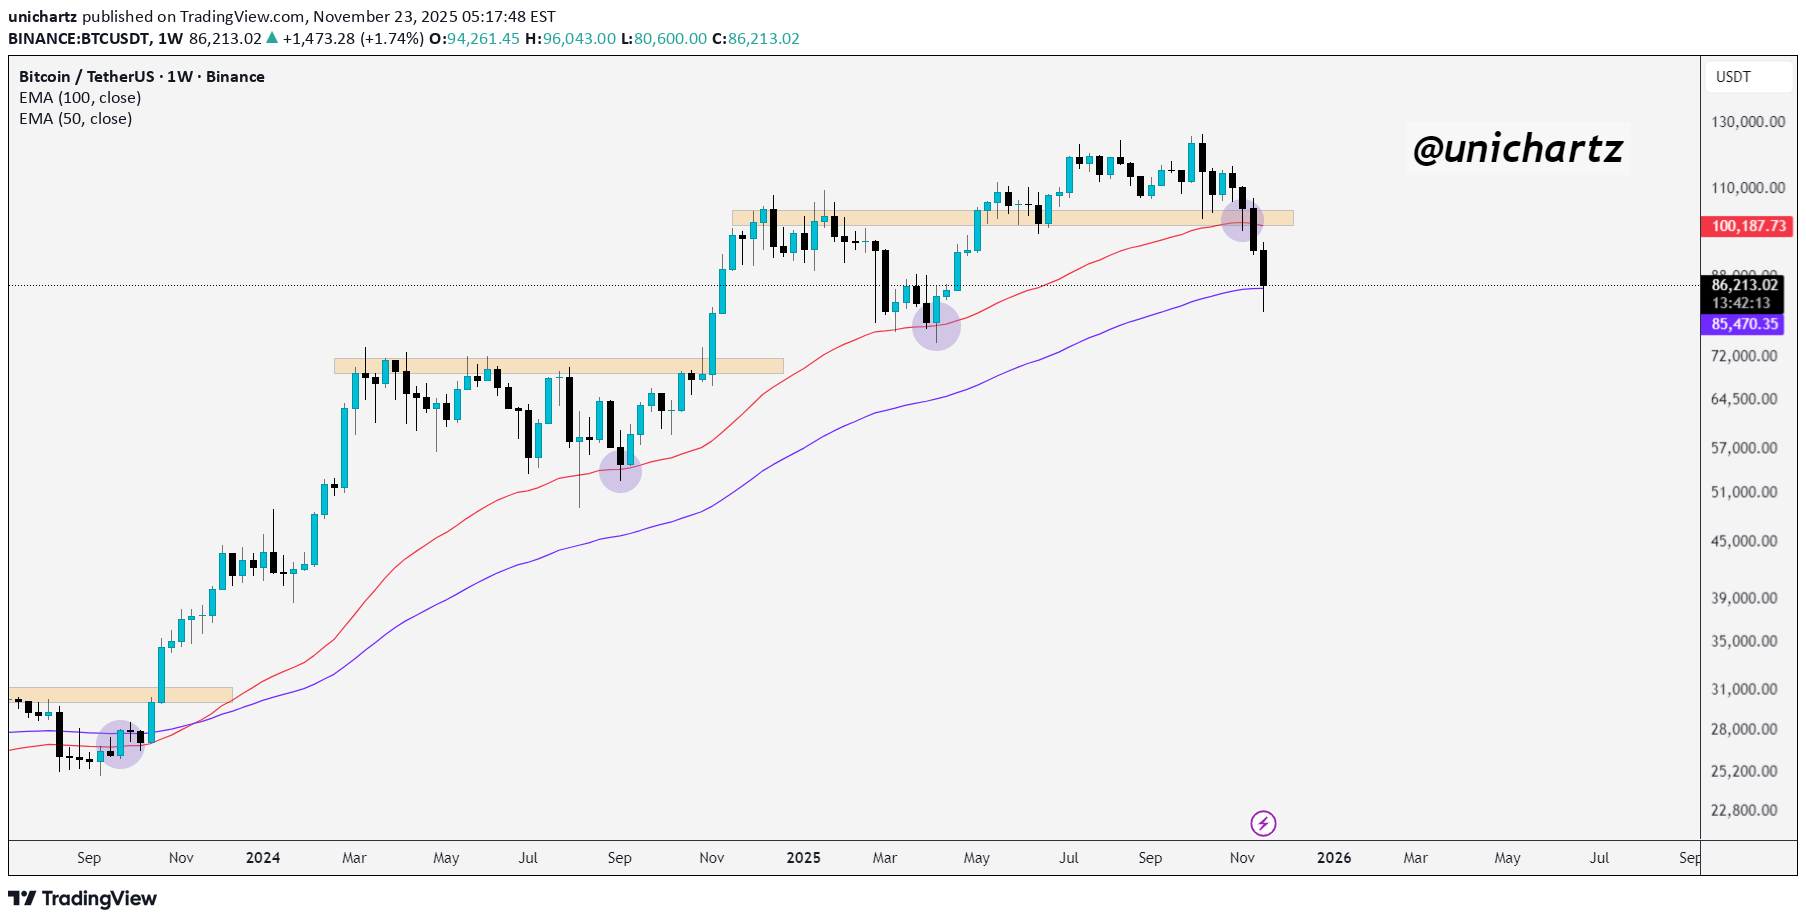
BTC Structure Under Pressure
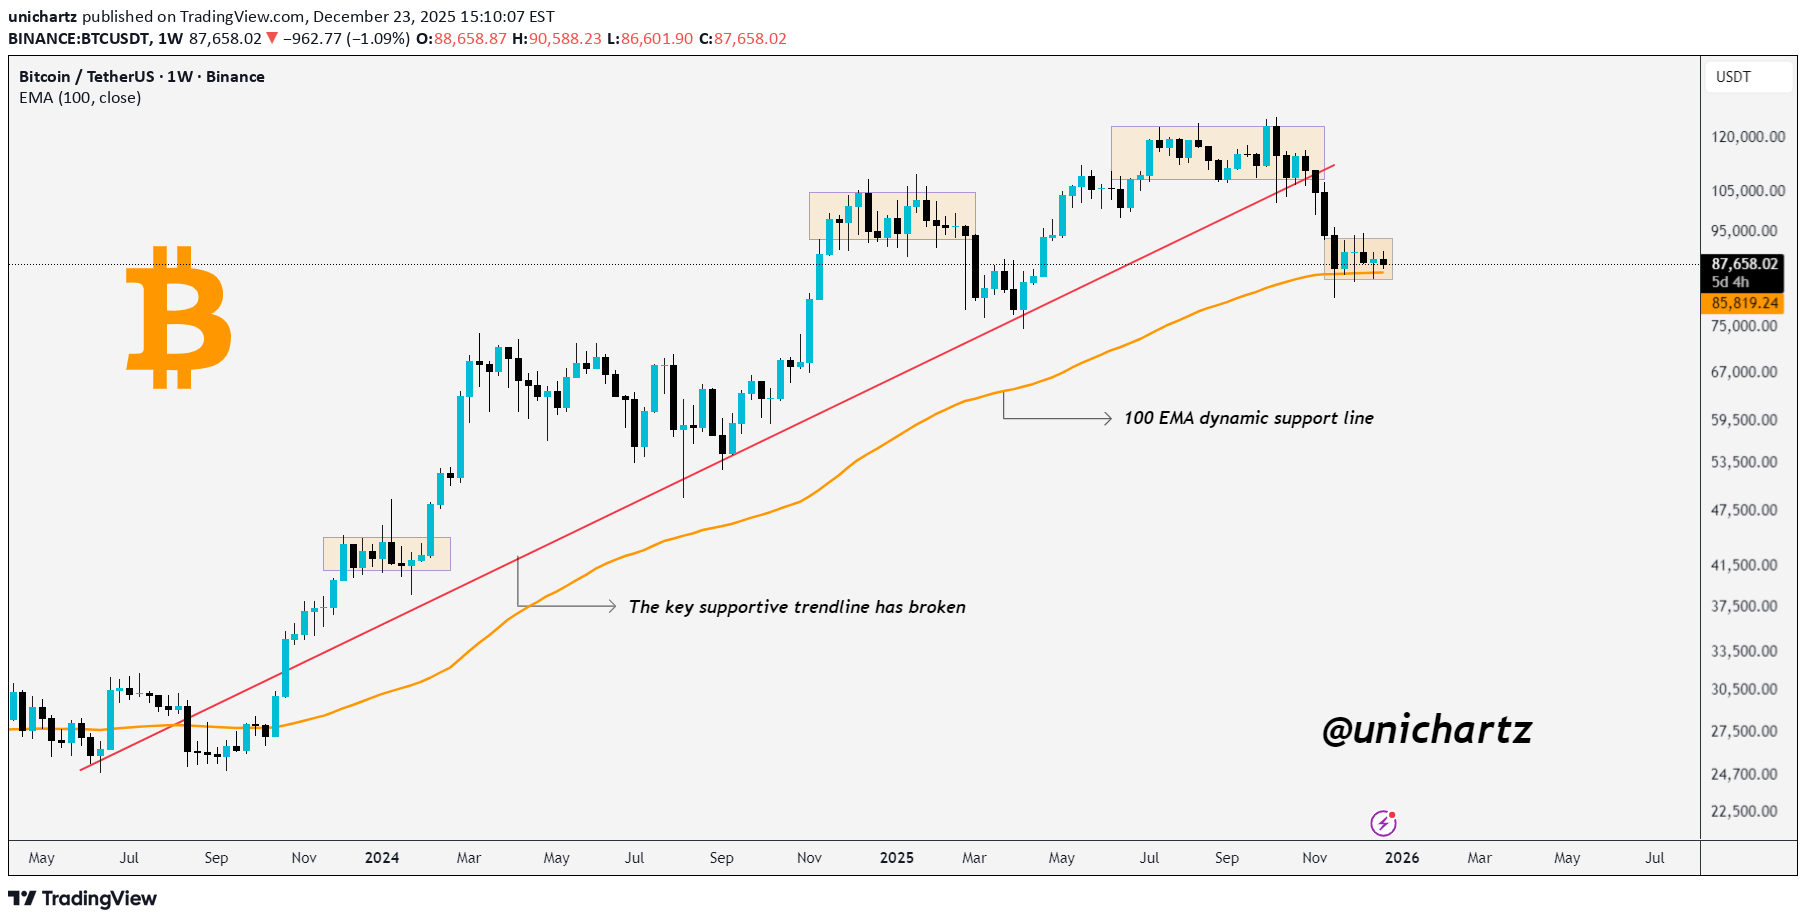
BTC has broken its key rising trendline, signaling a loss of bullish momentum. Price is now consolidating around the 100 EMA, which is acting as the last major dynamic support. As long as BTC holds this zone, we may see stabilization or a bounce, but a clean breakdown below the 100 EMA could open the door for further downside and a short-term shift in market structure. DYOR, NFA Please hit the like button if you like it, and share your views in the comments section.
unichartz
ریسک بزرگ بیت کوین: فروپاشی ساختار و هشدار جدی RSI!
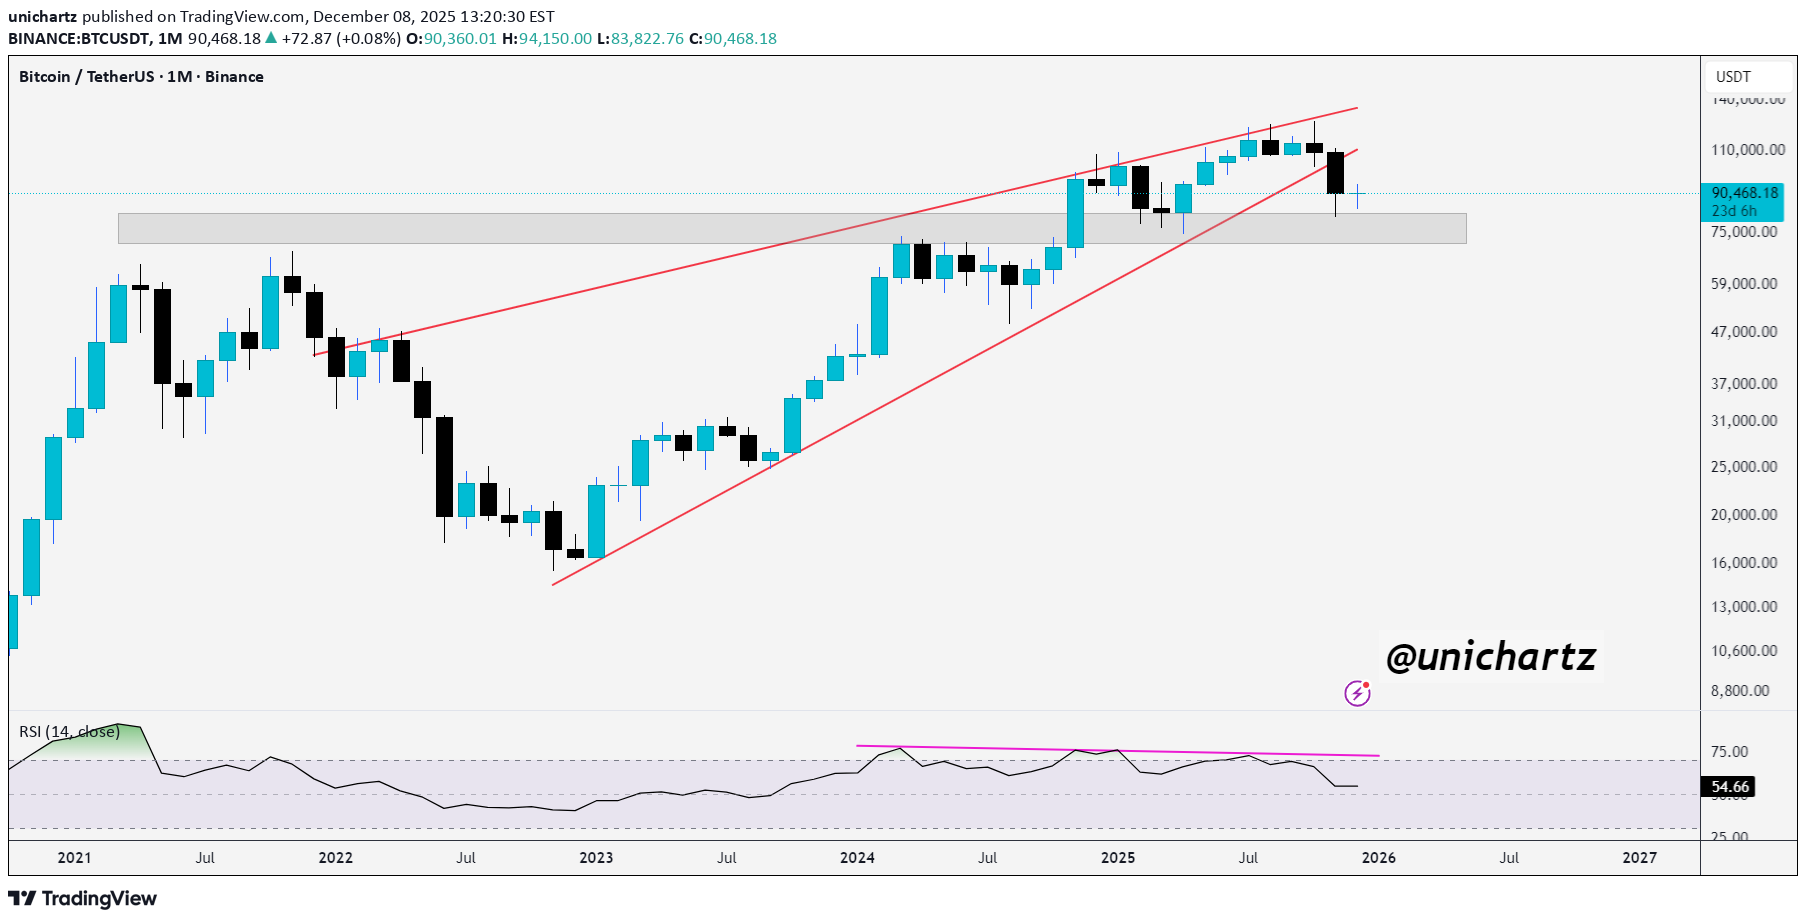
B BTC/USDT is showing some concern on the monthly chart as price has broken below the rising wedge and is now retesting a major demand zone. Losing this zone could trigger a deeper correction. At the same time, RSI is showing a clear multi-year bearish divergence, highlighting weakening momentum. Until BTC reclaims the wedge support or closes back above the resistance band, downside risk remains elevated. DYOR, NFA Please hit the like button if you like it, and share your views in the comments section.
unichartz
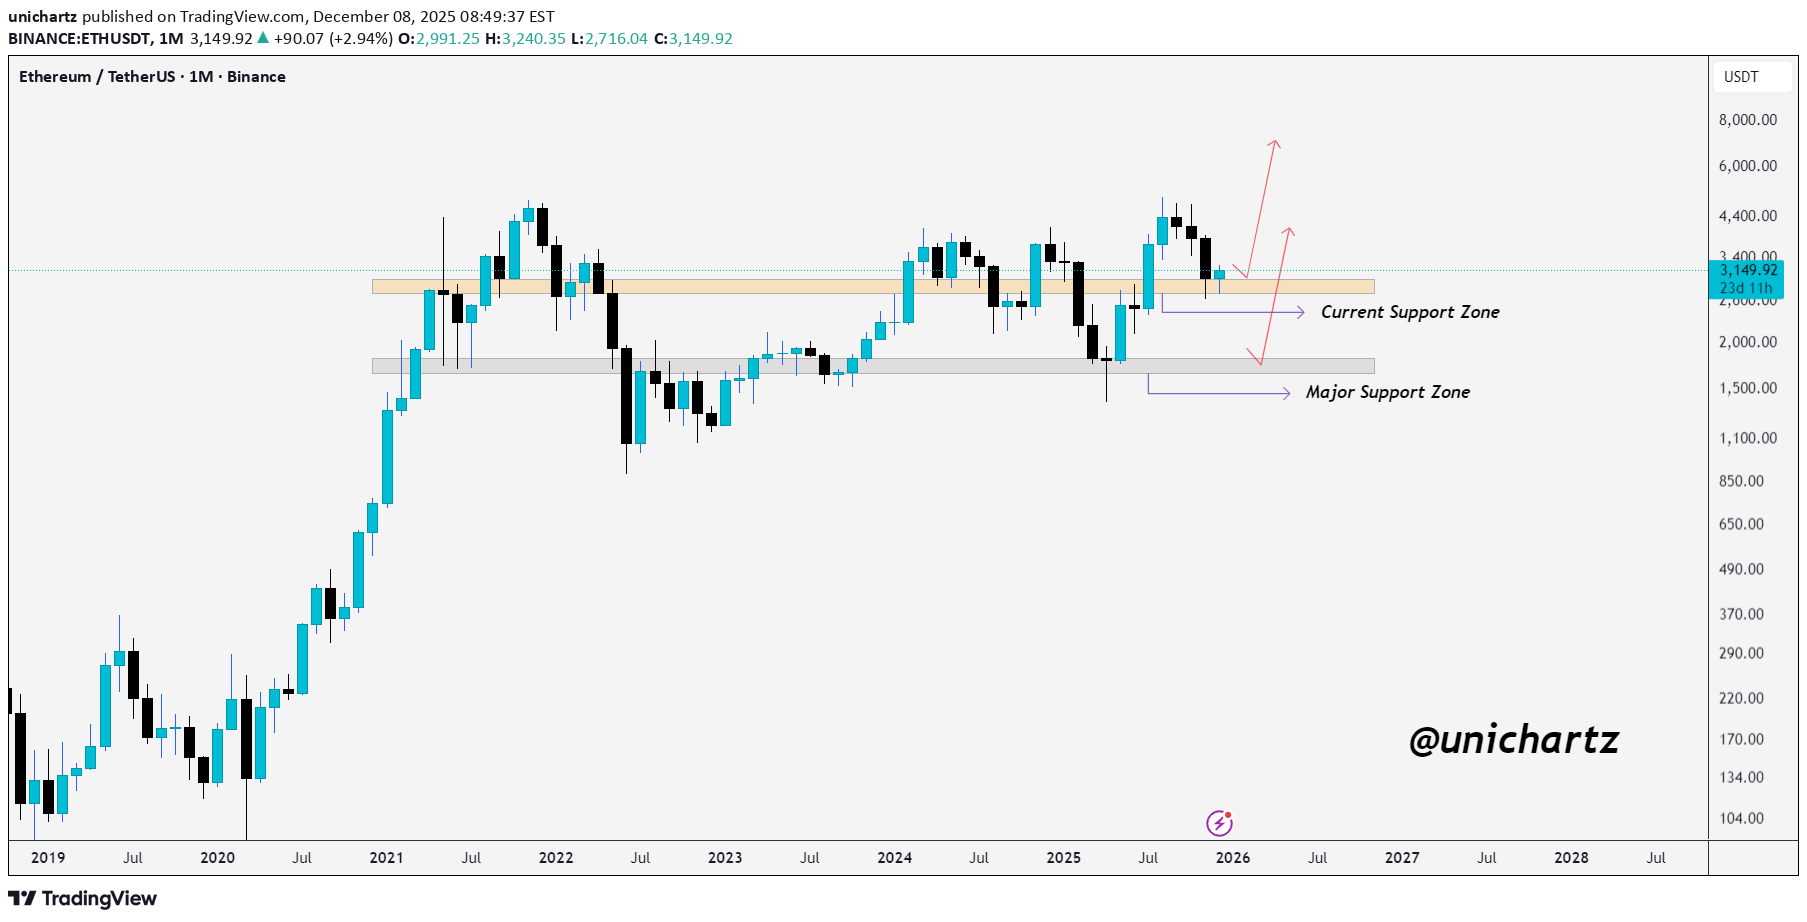
ساختار ماهانه اتریوم زیر حمایت: آیا خریداران کنترل را حفظ میکنند؟
unichartz
نقطه عطف سولانا کجاست؟ آیا خیز صعودی یا سقوط به ۸۰ دلار؟
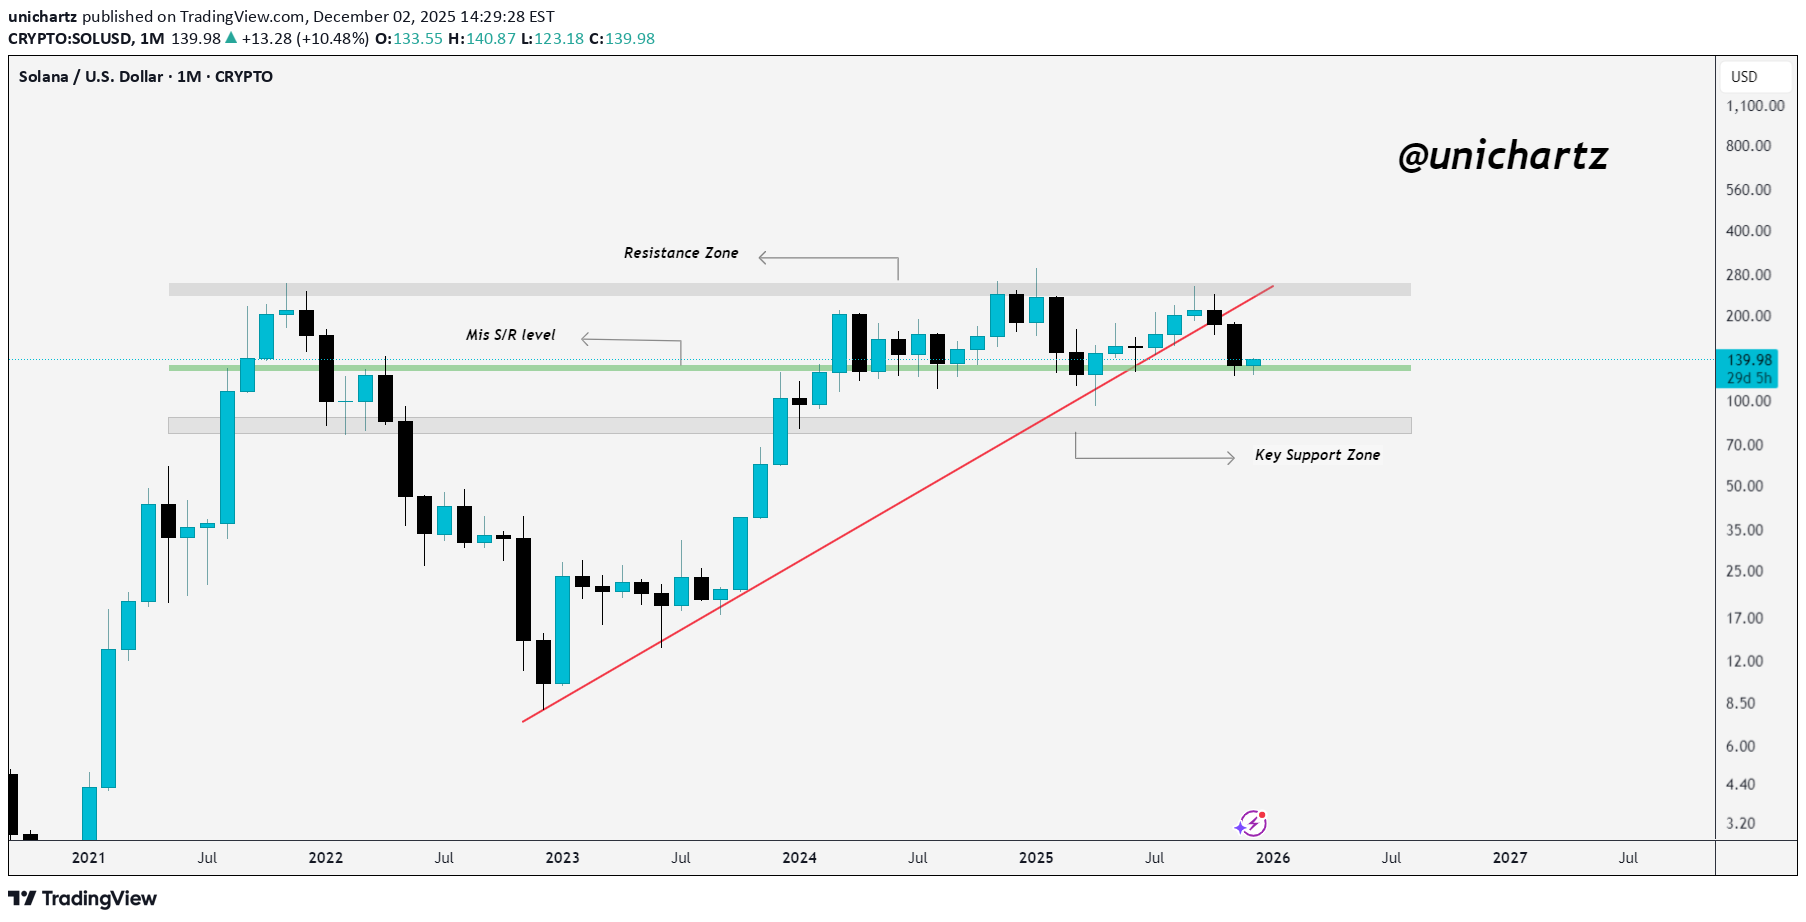
SOL is holding well above the mid S/R zone and showing solid strength. If it continues to rebound from this area, price could push back toward the upper resistance. But if SOL breaks below this zone, it may slide down toward the $80 levels. DYOR, NFA Please hit the like button if you like it, and share your views in the comments section.
unichartz
لینک (LINK) قویتر شد: آیا زمان جهش بزرگ بعدی فرا رسیده است؟
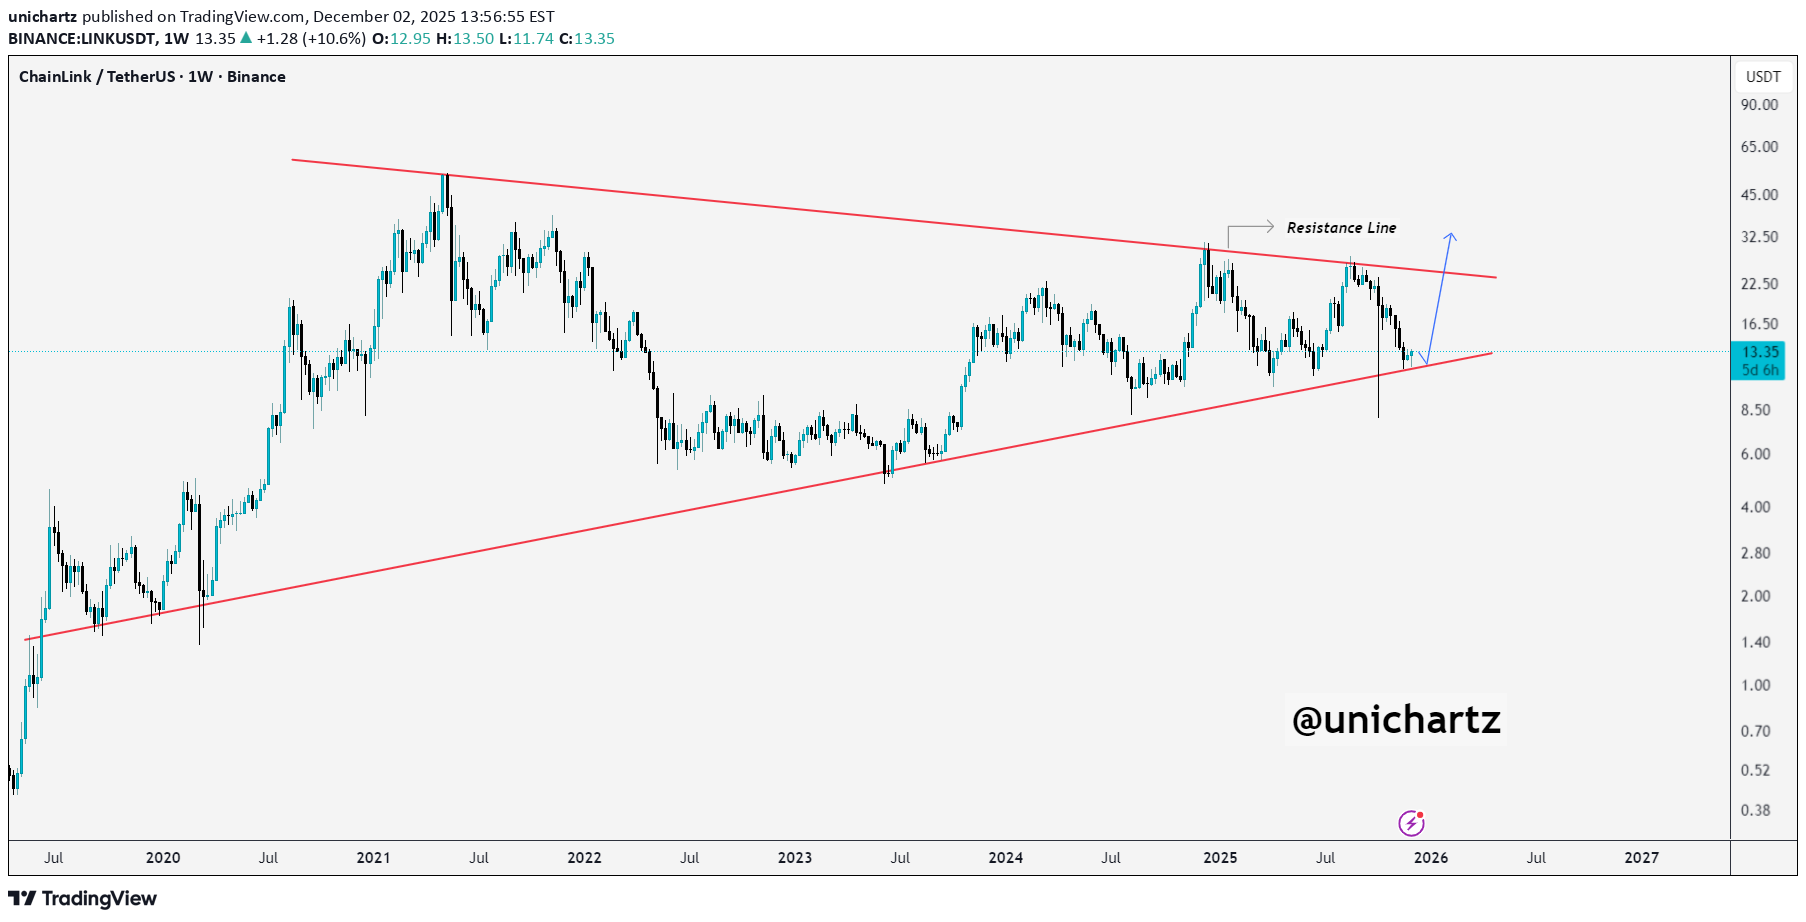
LINK is bouncing cleanly from its long-term weekly trendline support, keeping the bullish structure intact. Price is still moving inside a large wedge, and if this rebound continues, a retest of the upper resistance line is likely. A breakout above that level could open the door for a stronger move. DYOR, NFA Please hit the like button if you like it, and share your views in the comments section.
unichartz
آیا ساختار روزانه اتریوم در شرف صعودی شدن است؟ تحلیل کلیدی
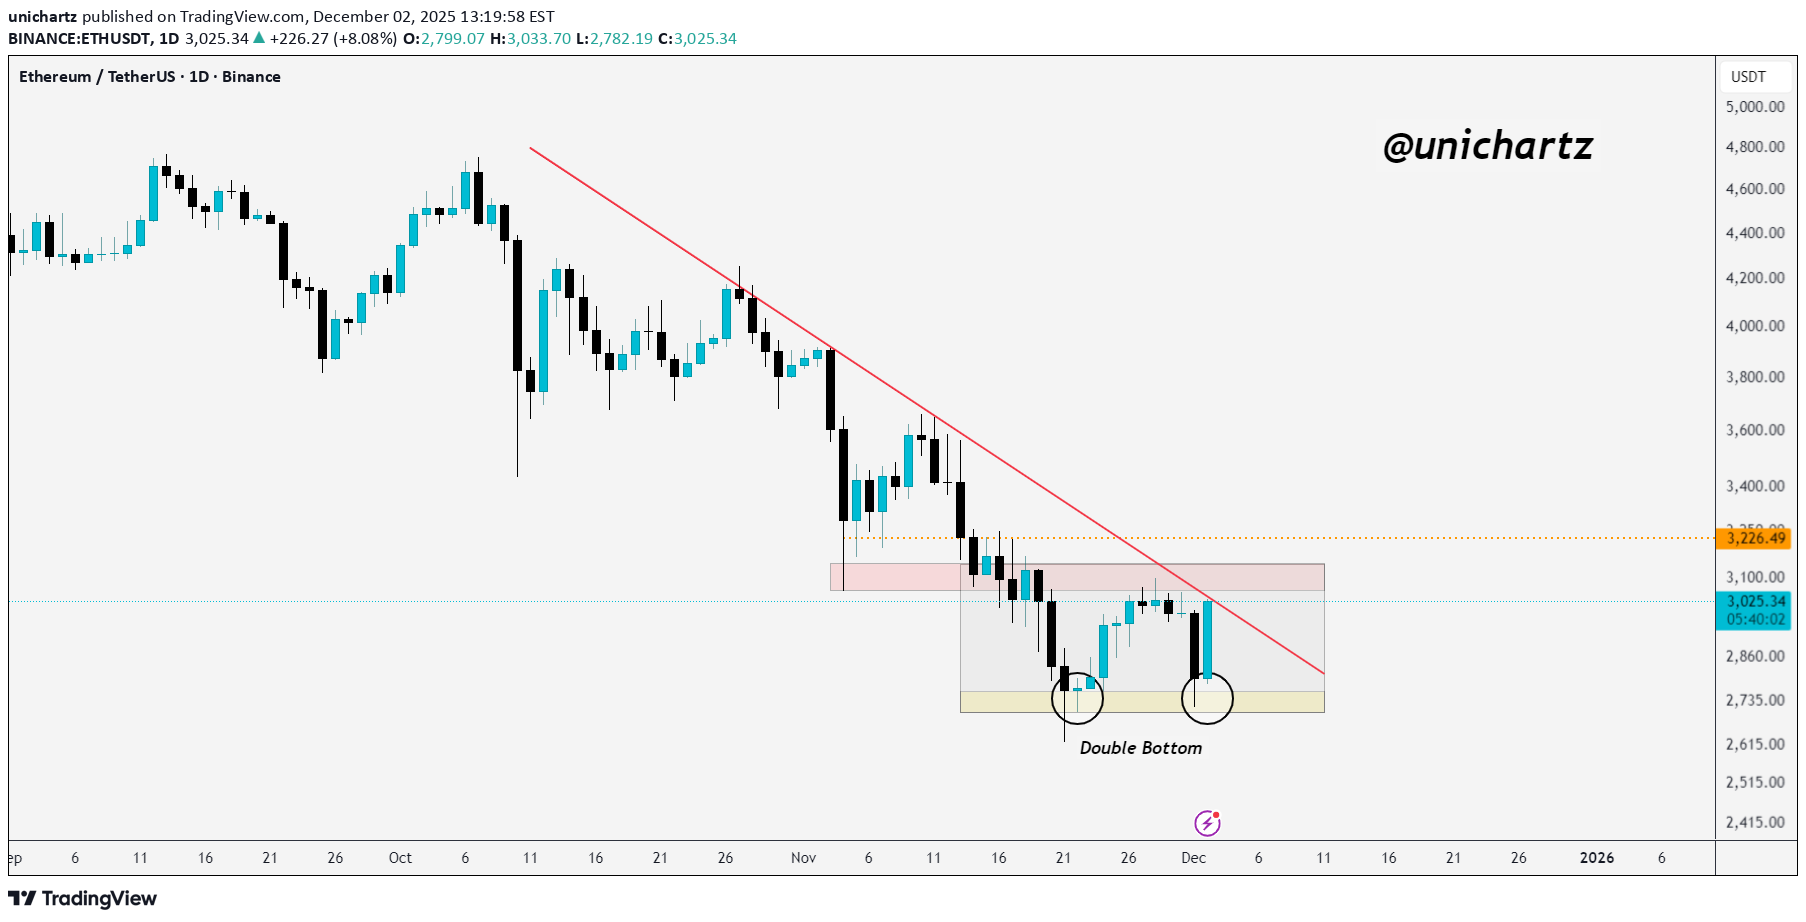
ETH has formed a clear double-bottom pattern on the daily timeframe. A breakout above the trendline and the consolidation zone would be a strong signal of a potential trend reversal. Keep an eye on this setup, it could turn bullish quickly if confirmed. DYOR, NFA Please hit the like button if you like it, and share your views in the comments section.
unichartz
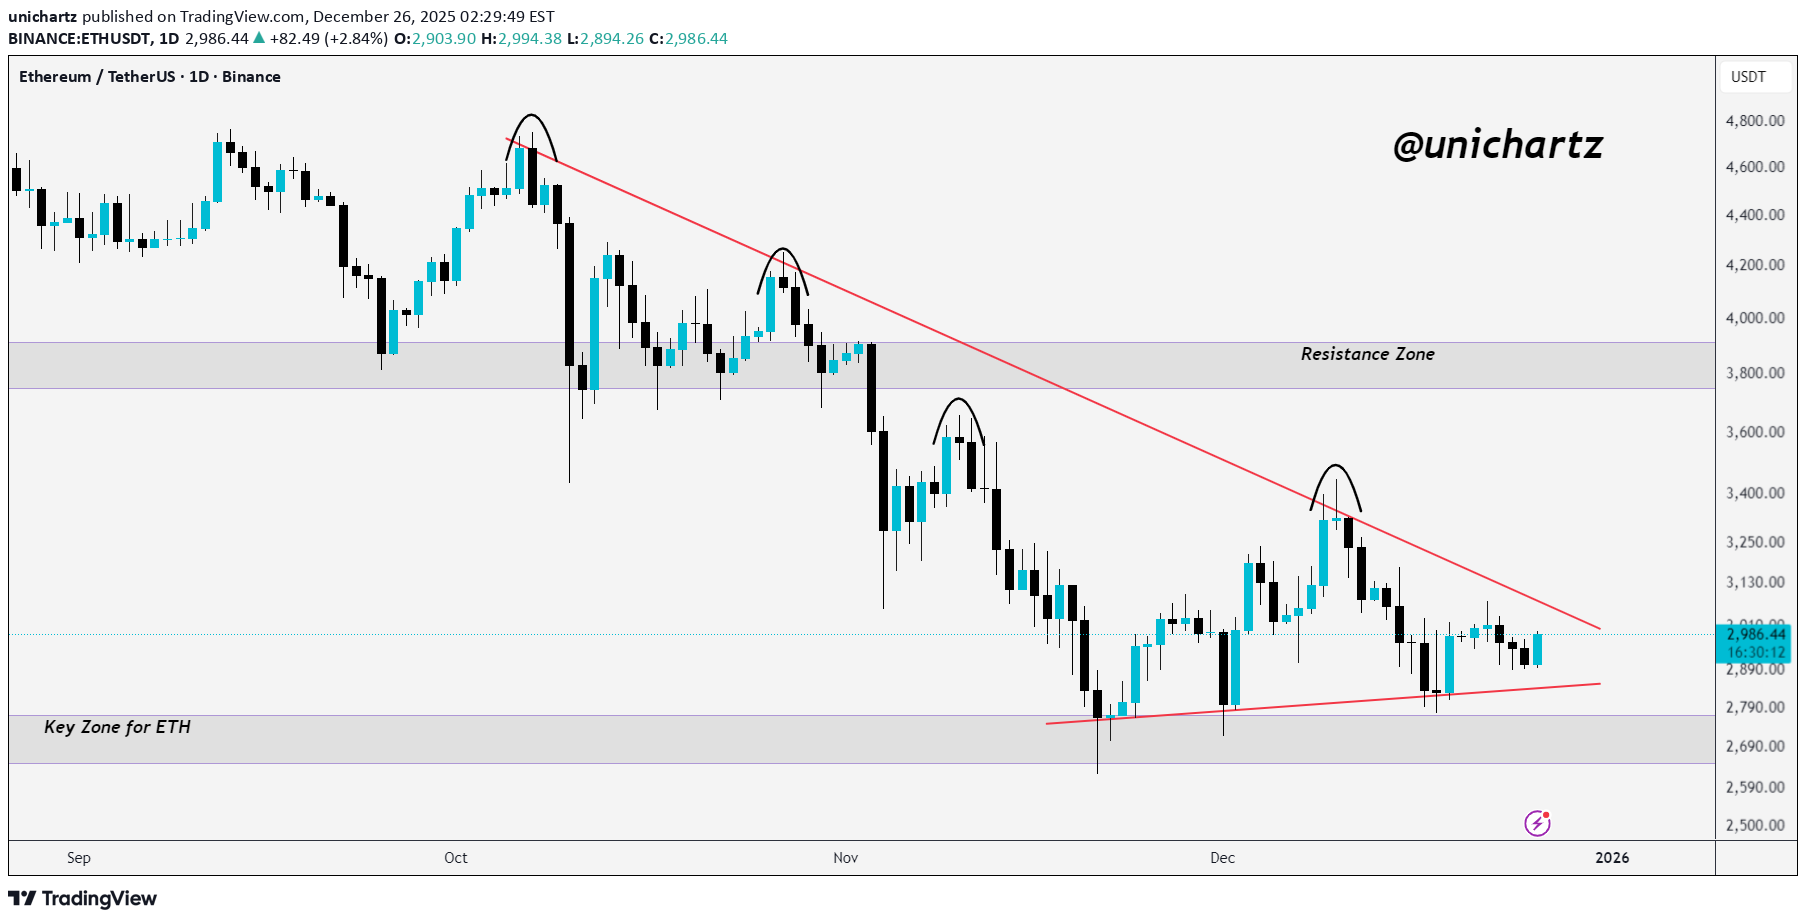
قیمت اتریوم در آستانه سقوط؟ ناحیه حمایتی کلیدی که باید زیر نظر بگیرید!
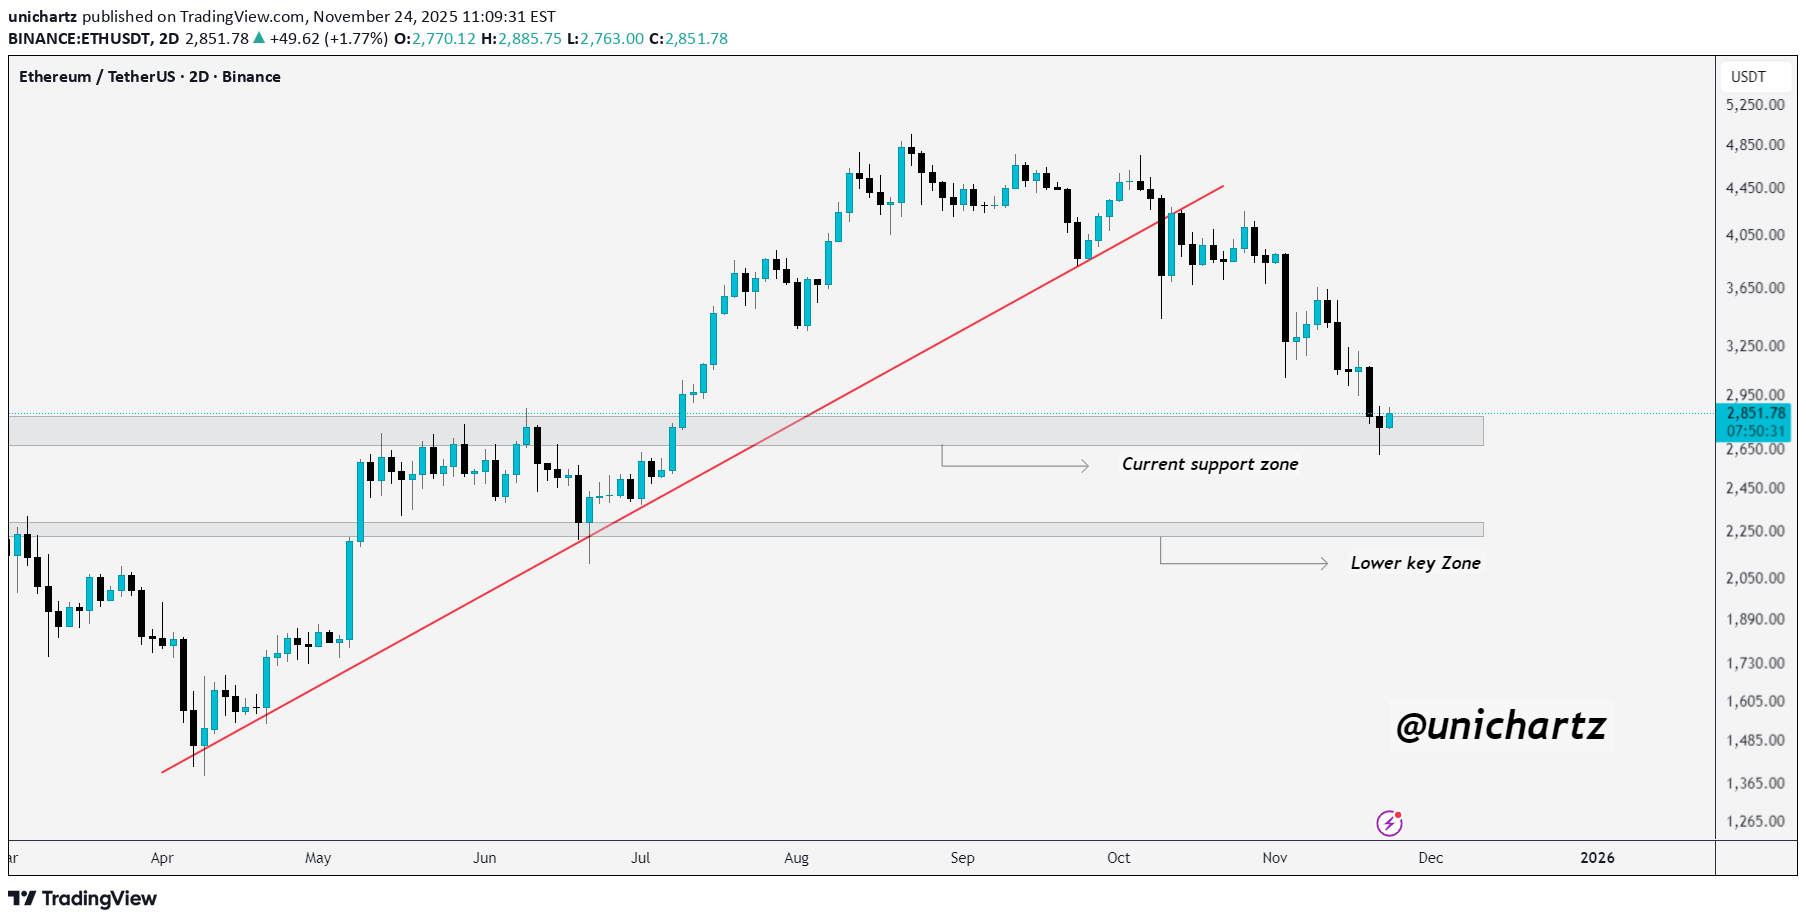
ETH is holding the current support zone after a sharp decline, showing its first signs of slowing down. As long as this zone holds, we could see a short-term bounce or consolidation. But if this support breaks, price may head toward the lower key zone highlighted on the chart. For now, this support acts as the main level to watch. DYOR, NFA
unichartz
بیت کوین زیر حمایت ۵۰ EMA! آیا خط حمایت ۱۰ EMA ناجی خواهد بود؟
#BTC/USDT has slipped below the 50 EMA, which was acting as dynamic support. However, price is now showing a small bounce around the 100 EMA. If Bitcoin manages to hold this level, we could see a healthy rebound from here. But if it fails to maintain this support, further correction in the coming days becomes likely. DYOR, NFA Please hit the like button if you like it, and share your views in the comments section.
unichartz
بیت کوین سقوط کرد: آیا ۷۳ هزار دلار کف جدید BTC است؟
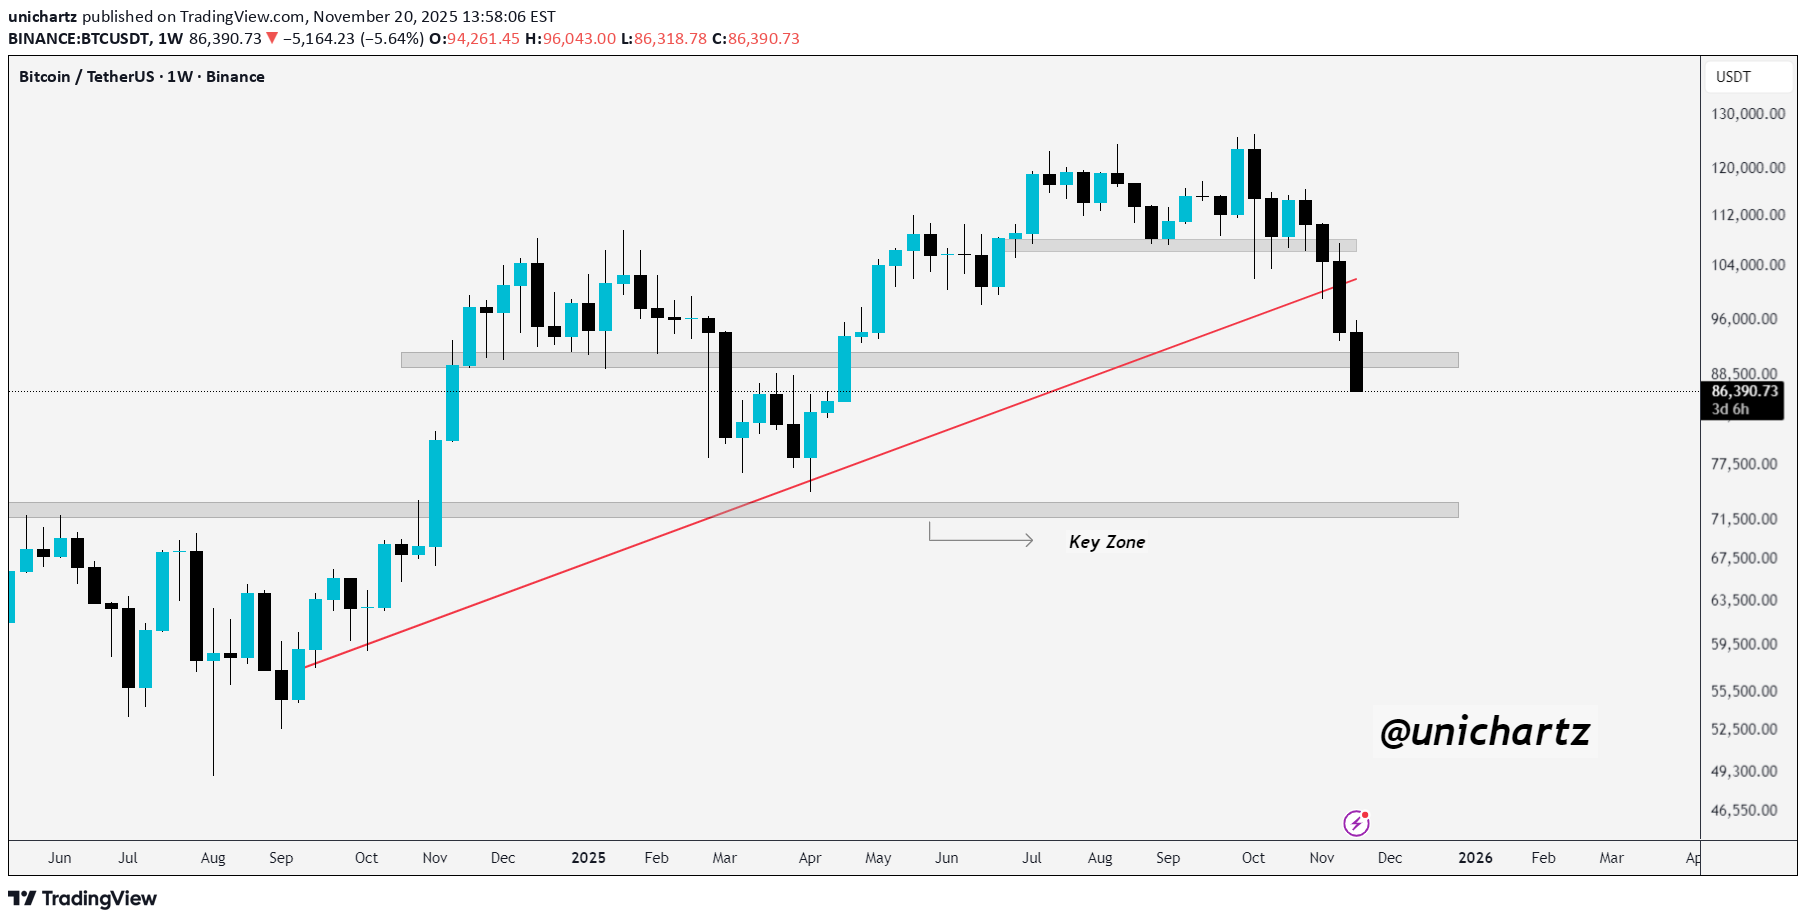
B BTC/USDT has broken below the support trendline and the key support zone. The next major support to watch is around the $73K level. DYOR, NFA
Disclaimer
Any content and materials included in Sahmeto's website and official communication channels are a compilation of personal opinions and analyses and are not binding. They do not constitute any recommendation for buying, selling, entering or exiting the stock market and cryptocurrency market. Also, all news and analyses included in the website and channels are merely republished information from official and unofficial domestic and foreign sources, and it is obvious that users of the said content are responsible for following up and ensuring the authenticity and accuracy of the materials. Therefore, while disclaiming responsibility, it is declared that the responsibility for any decision-making, action, and potential profit and loss in the capital market and cryptocurrency market lies with the trader.